
Houses for sale & to rent in ML1 3EZ, Wellpark Road, Motherwell West, Motherwell
House Prices in ML1 3EZ, Wellpark Road, Motherwell West
Properties in ML1 3EZ have no sales history available within the last 3 years. ML1 3EZ is a postcode in Wellpark Road located in Motherwell West, an area in Motherwell, North Lanarkshire, with 6 households².
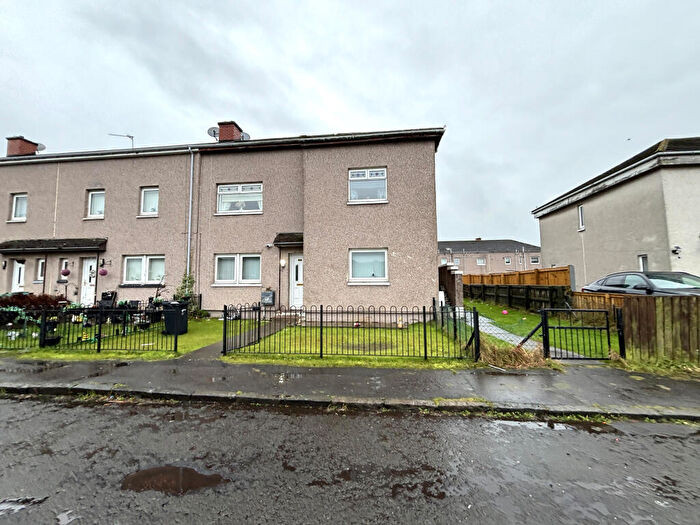
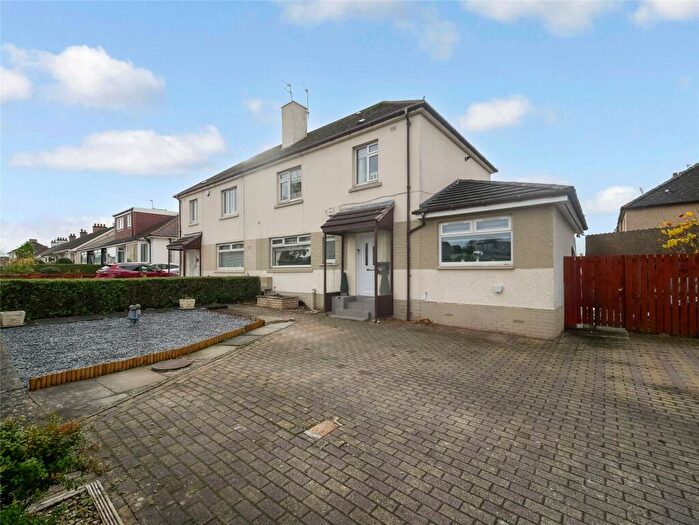
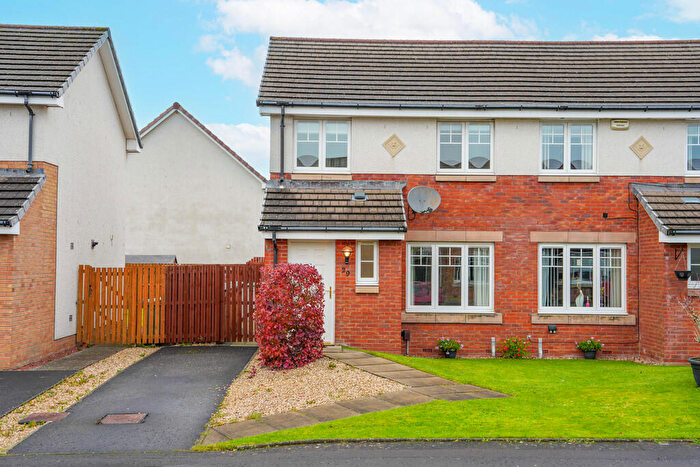
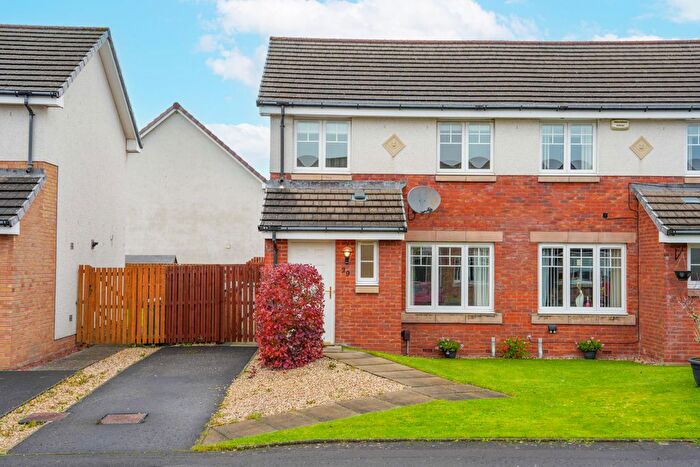
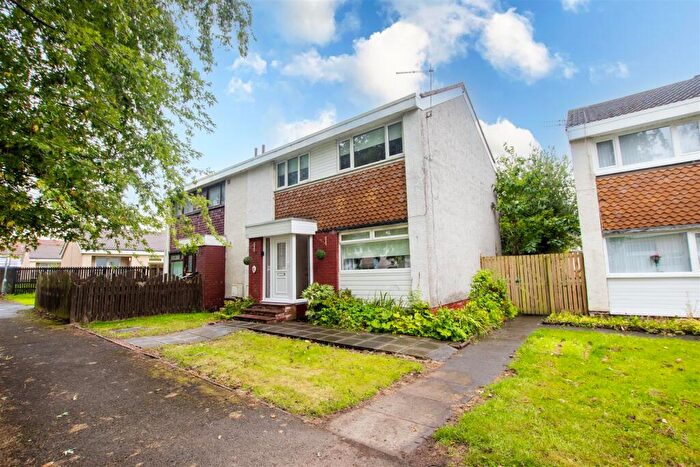
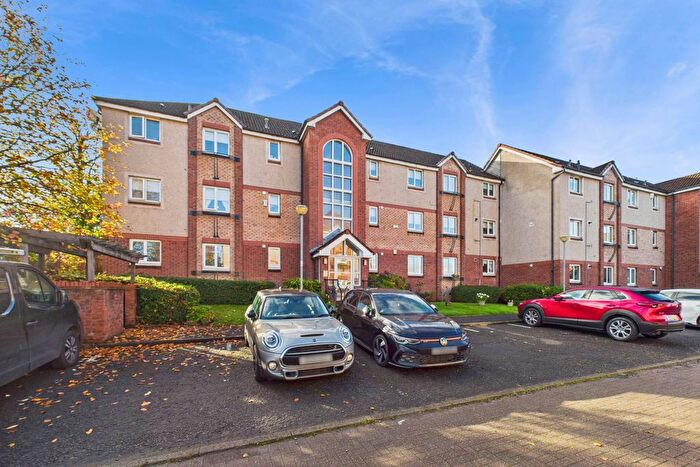
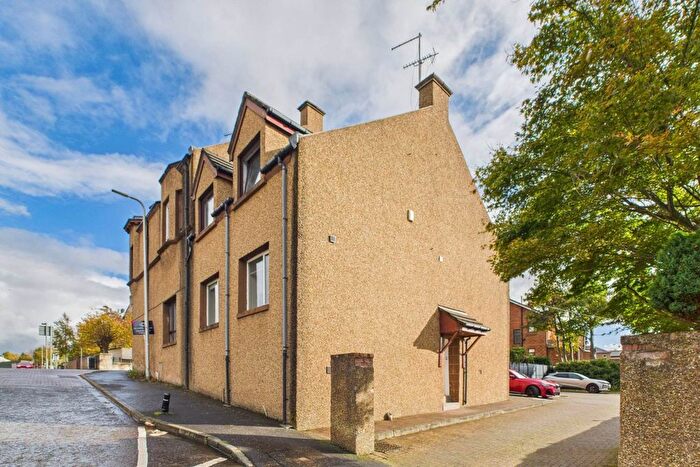
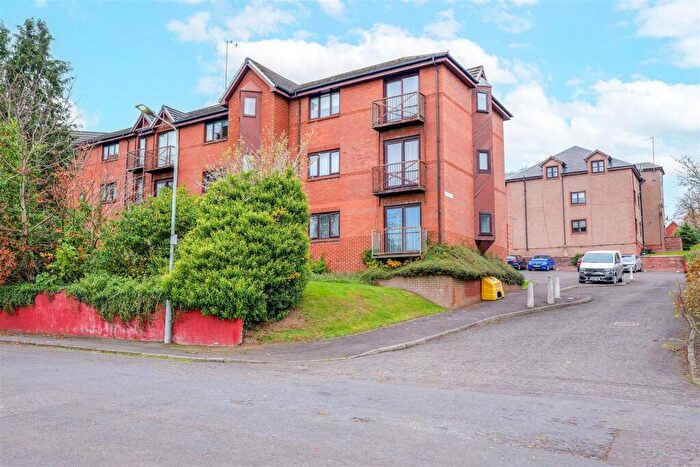
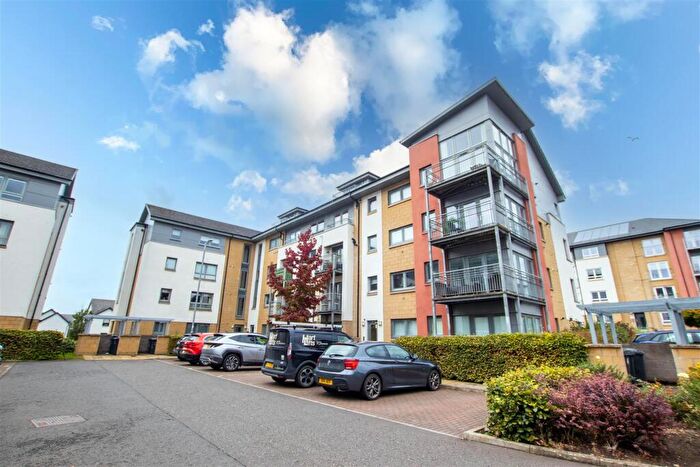
Properties for sale near ML1 3EZ, Wellpark Road
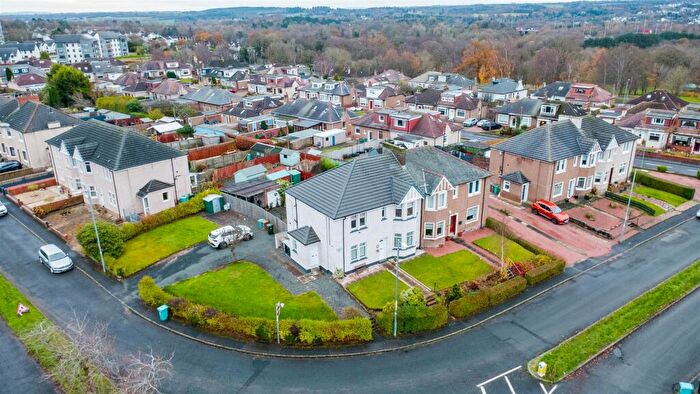
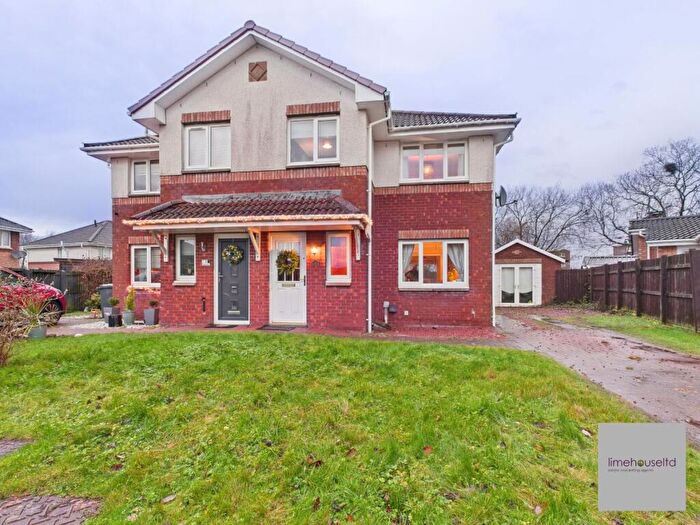
![]()
If you are looking to sell your house, let it out, or receive a property valuation, an expert can help you.
Click the button below to get started.

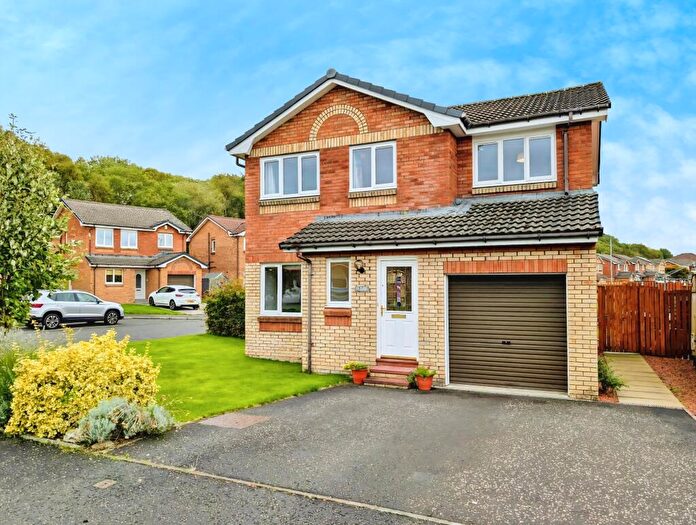
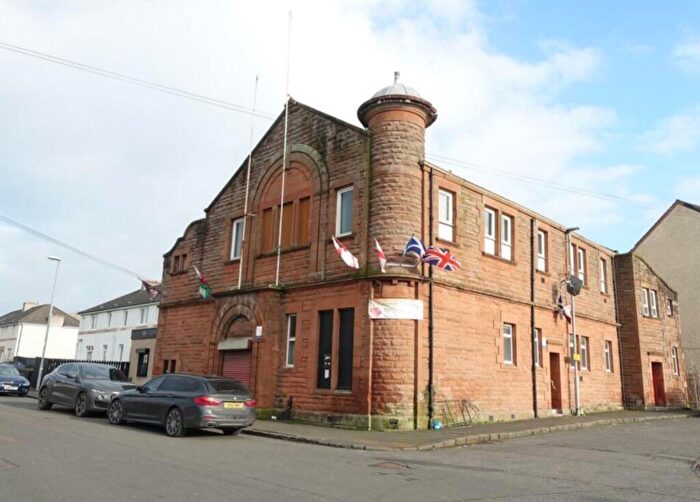
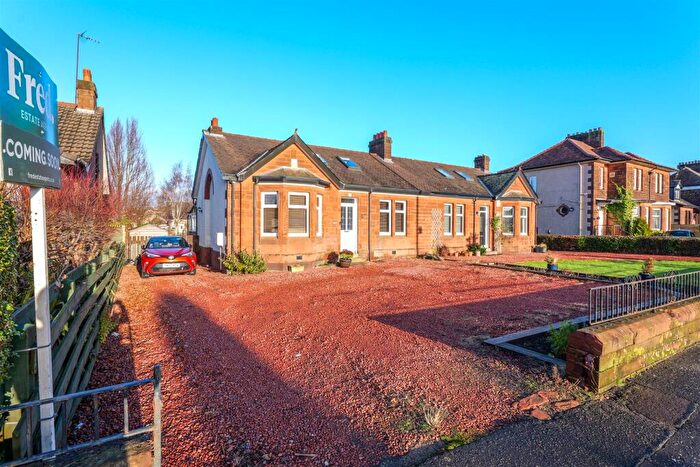
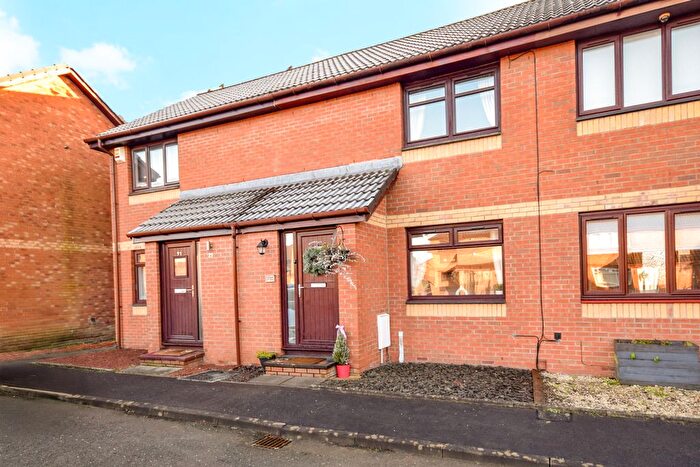
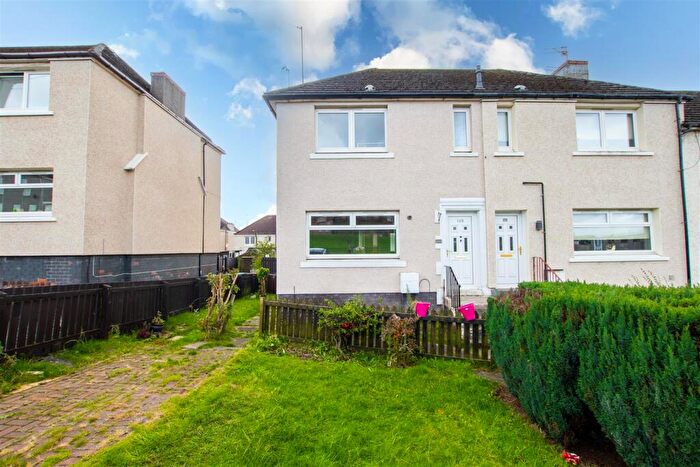
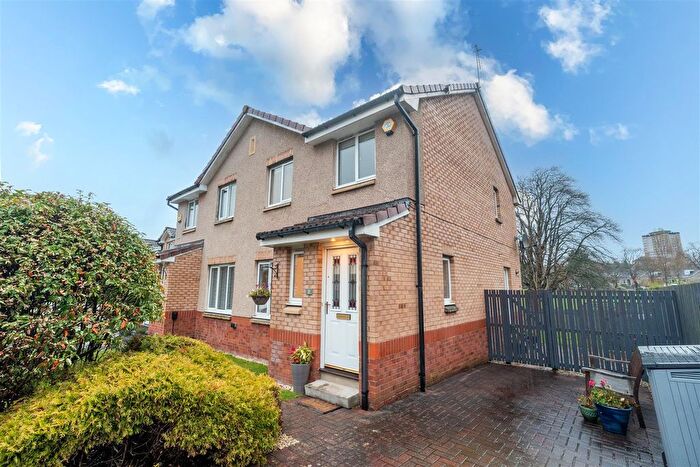
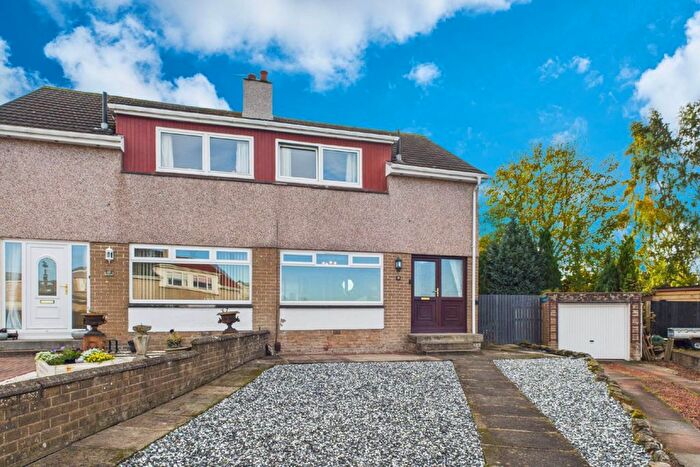
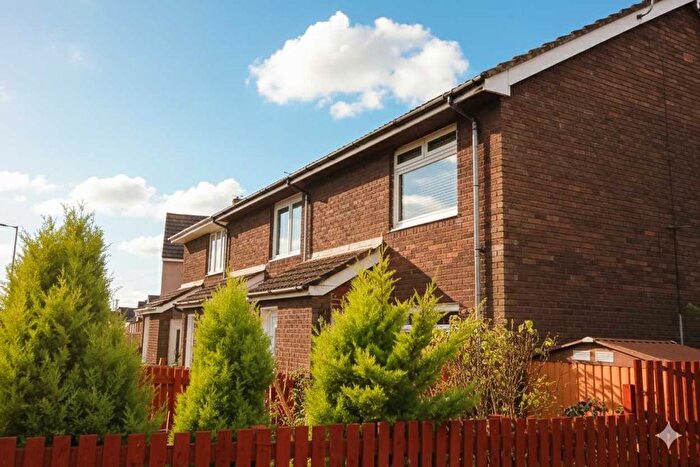
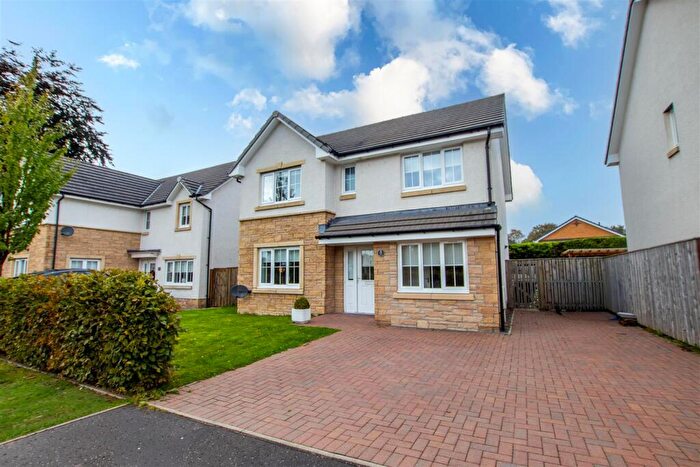
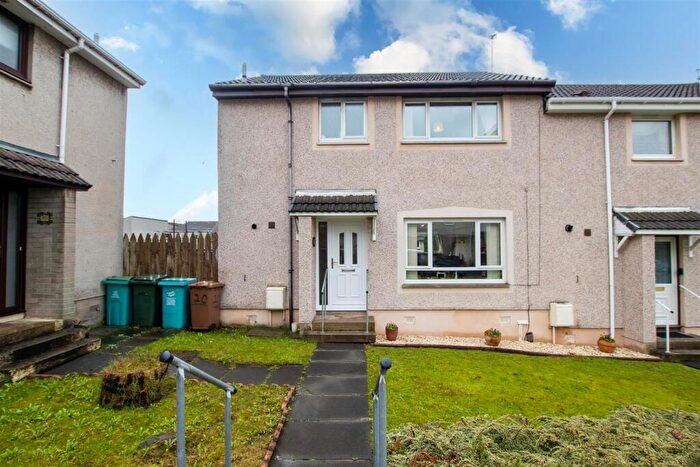
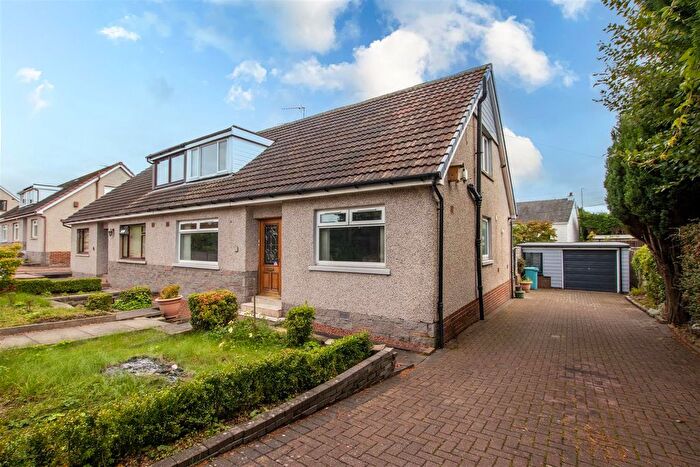
Previously listed properties near ML1 3EZ, Wellpark Road

![]()
If you are looking to sell your house, let it out, or receive a property valuation, an expert can help you.
Click the button below to get started.
Price Paid in Wellpark Road, ML1 3EZ, Motherwell West
4 Wellpark Road, ML1 3EZ, Motherwell West Motherwell
Property 4 has been sold 1 time. The last time it was sold was in 23/11/2020 and the sold price was £272,500.00.
This is a Property which was sold as an Established Building in 23/11/2020
| Date | Price | Classification |
|---|---|---|
| 23/11/2020 | £272,500.00 | Established Building |
6 Wellpark Road, ML1 3EZ, Motherwell West Motherwell
Property 6 has been sold 2 times. The last time it was sold was in 08/04/2015 and the sold price was £167,000.00.
This is a Property which was sold as an Established Building in 08/04/2015
| Date | Price | Classification |
|---|---|---|
| 08/04/2015 | £167,000.00 | Established Building |
| 06/09/2007 | £125,000.00 | Established Building |
3 Wellpark Road, ML1 3EZ, Motherwell West Motherwell
Property 3 has been sold 1 time. The last time it was sold was in 23/04/2014 and the sold price was £142,525.00.
This is a Property which was sold as an Established Building in 23/04/2014
| Date | Price | Classification |
|---|---|---|
| 23/04/2014 | £142,525.00 | Established Building |
Transport near ML1 3EZ, Wellpark Road
-
 Motherwell Station
 -
Airbles Station
-
Chatelherault Station
-
Hamilton Central Station
-
Shieldmuir Station
-
Hamilton West Station
-
Holytown Station
-
Bellshill Station
-
Carfin Station
-
Merryton Station
House price paid reports for ML1 3EZ, Wellpark Road
Click on the buttons below to see price paid reports by year or property price:
- Price Paid By Year
Property Price Paid in ML1 3EZ, Wellpark Road by Year
The average sold property price by year was:
| Year | Average Sold Price | Price Change |
Sold Properties
|
|---|---|---|---|
| 2020 | £272,500 | 39% |
1 Property |
| 2015 | £167,000 | 15% |
1 Property |
| 2014 | £142,525 | 12% |
1 Property |
| 2007 | £125,000 | - |
1 Property |