
Houses for sale & to rent in Shotts, North Lanarkshire
House Prices in Shotts
Properties in Shotts have an average house price of £134k and had 328 Property Transactions within the last 3 years.¹
Shotts is an area in North Lanarkshire with 6,286 households², where the most expensive property was sold for £490k.
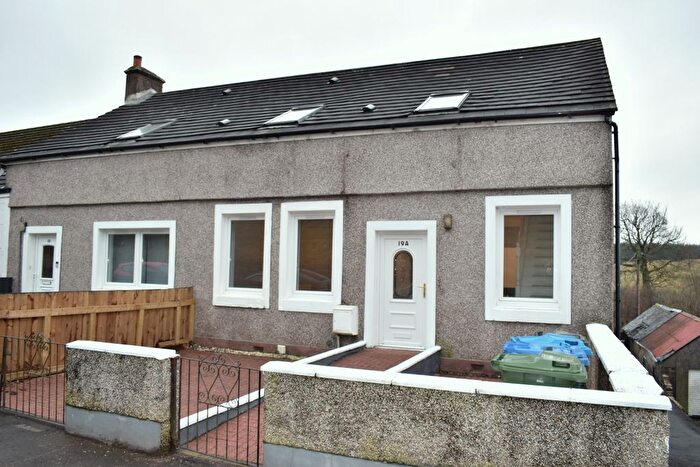
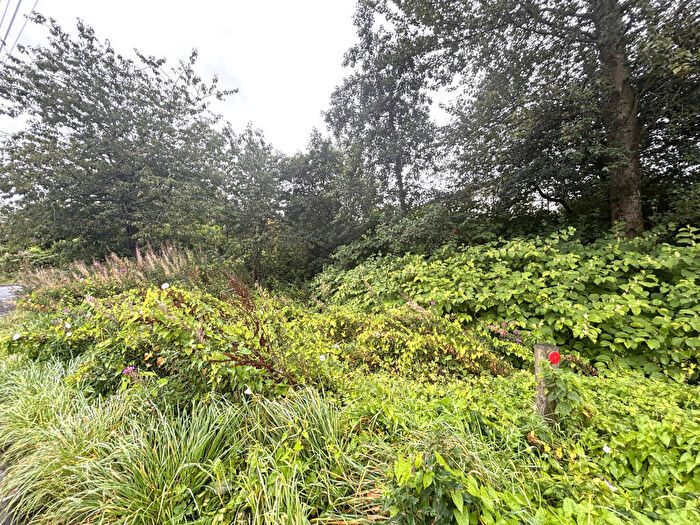
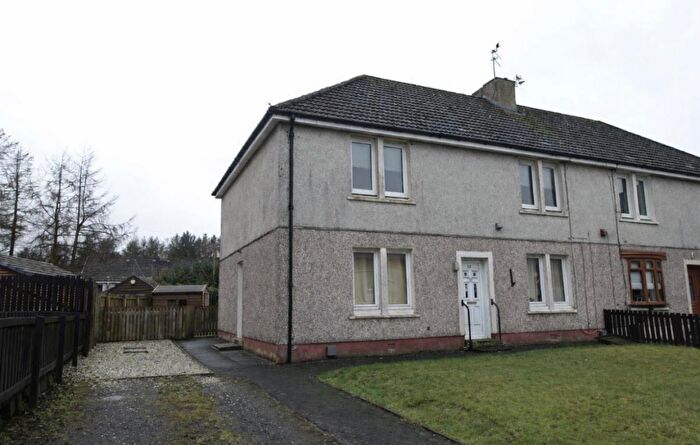
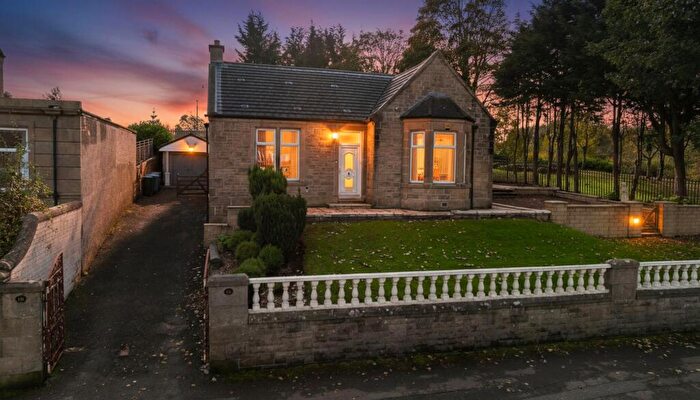
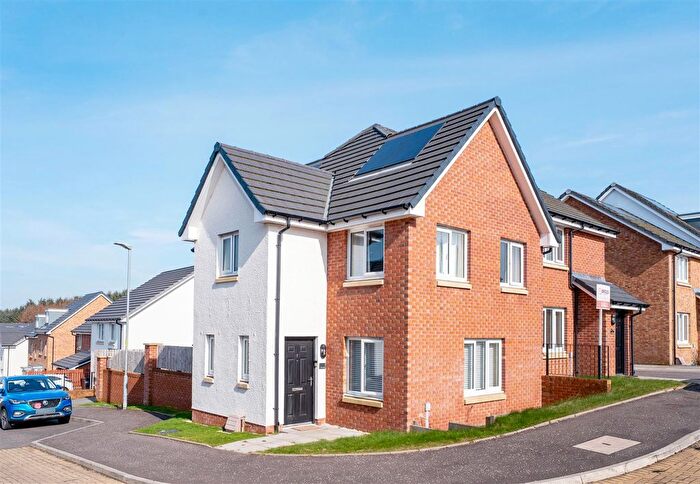
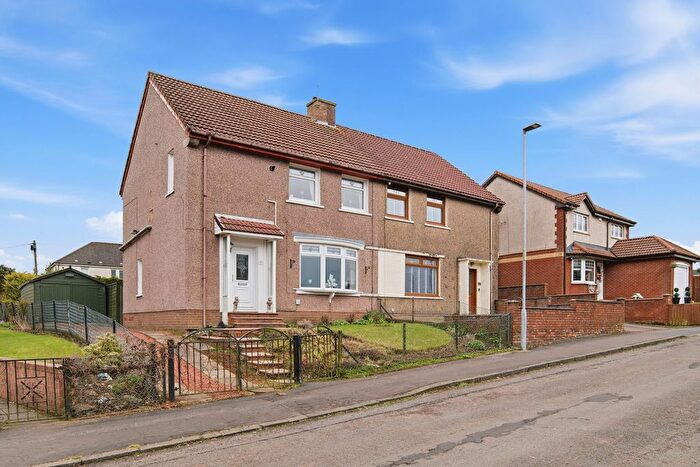
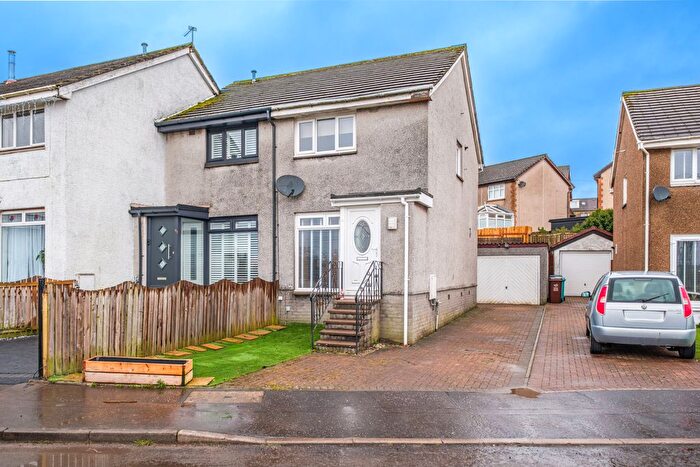
Properties for sale in Shotts
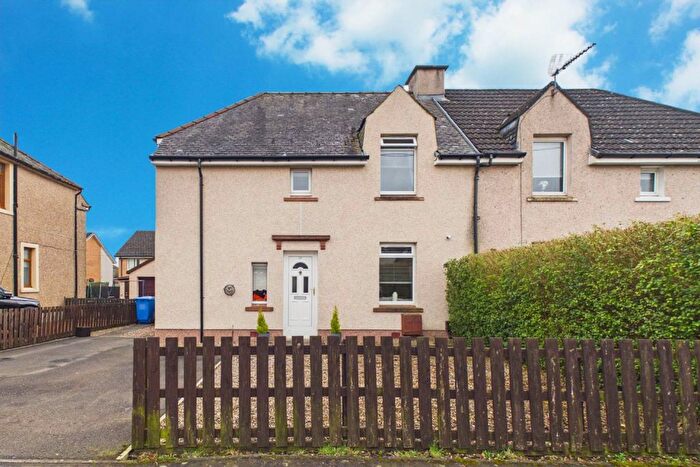

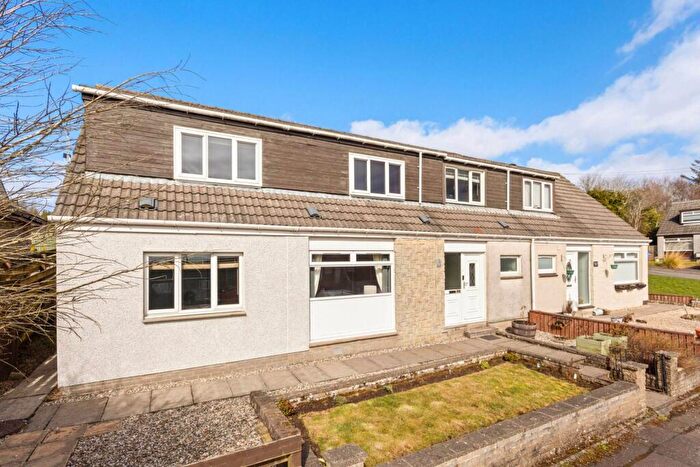

![]()
If you are looking to sell your house, let it out, or receive a property valuation, an expert can help you.
Click the button below to get started.
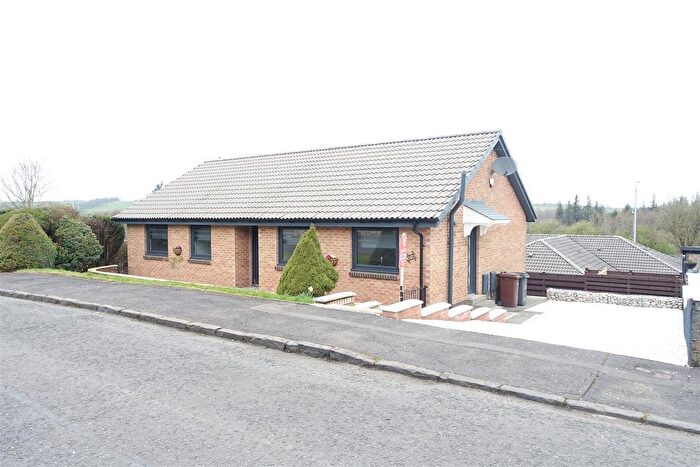
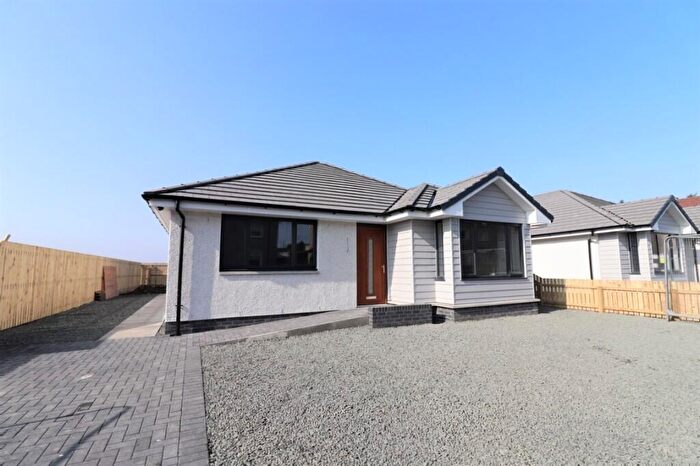

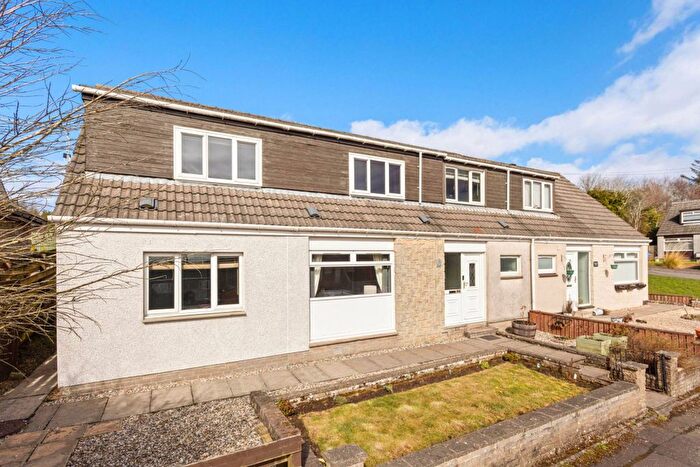
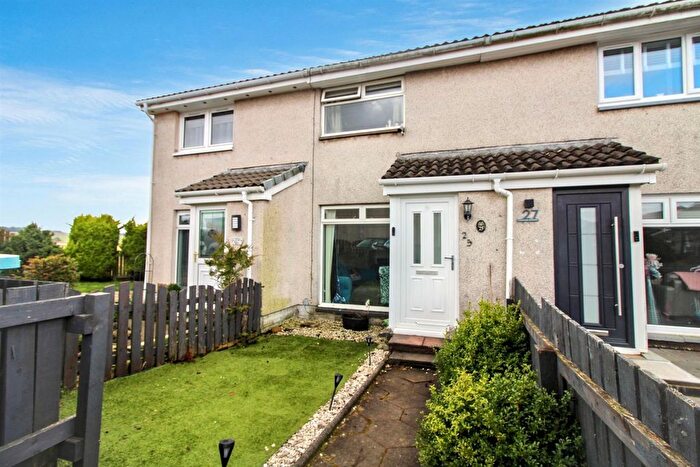
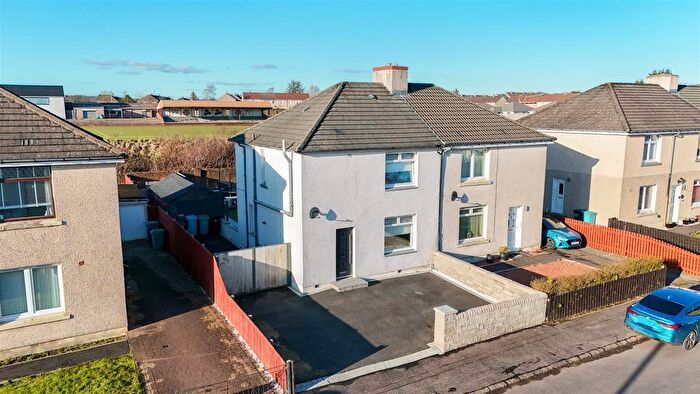
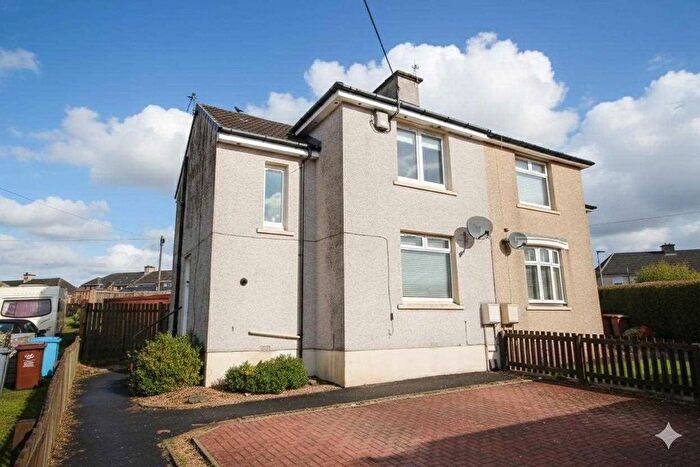
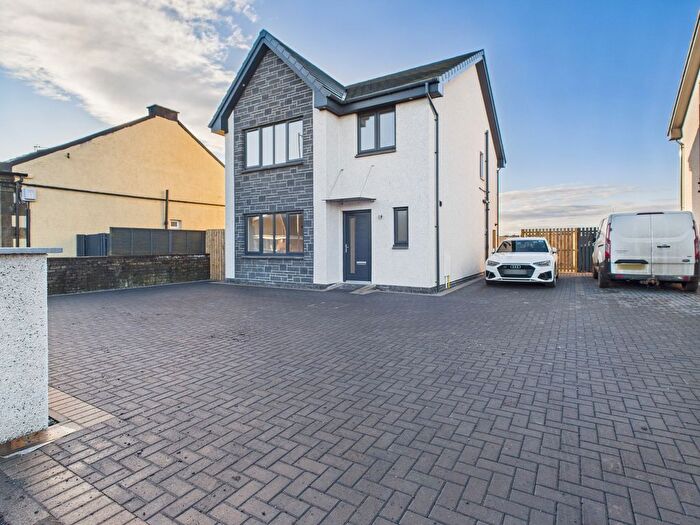
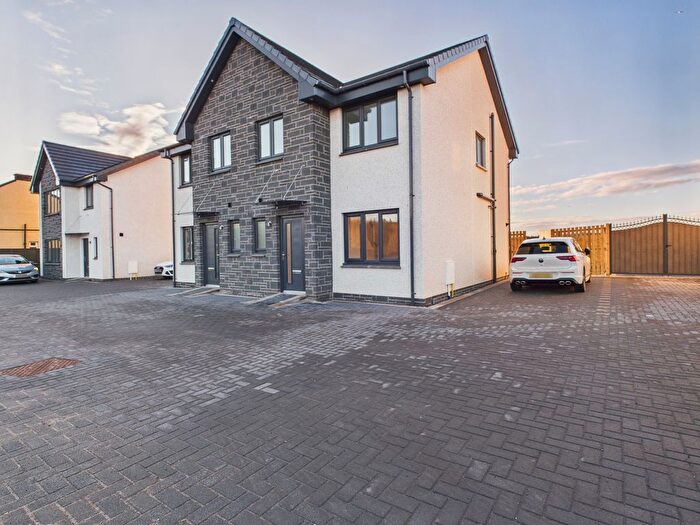
Previously listed properties in Shotts
![]()
If you are looking to sell your house, let it out, or receive a property valuation, an expert can help you.
Click the button below to get started.
Neighbourhoods in Shotts
Navigate through our locations to find the location of your next house in Shotts, North Lanarkshire for sale or to rent.
Transport in Shotts
Please see below transportation links in this area:

- FAQ
- Price Paid By Year
Frequently asked questions about Shotts
What is the average price for a property for sale in Shotts?
The average price for a property for sale in Shotts is £133,824. This amount is 11% lower than the average price in North Lanarkshire. There are 919 property listings for sale in Shotts.
Which train stations are available in or near Shotts?
Some of the train stations available in or near Shotts are Shotts, Hartwood and Fauldhouse.
Property Price Paid in Shotts by Year
The average sold property price by year was:
| Year | Average Sold Price | Price Change |
Sold Properties
|
|---|---|---|---|
| 2025 | £142,030 | 8% |
114 Properties |
| 2024 | £130,935 | 2% |
99 Properties |
| 2023 | £128,175 | -19% |
115 Properties |
| 2022 | £152,856 | 28% |
257 Properties |
| 2021 | £109,796 | -6% |
192 Properties |
| 2020 | £116,647 | -4% |
202 Properties |
| 2019 | £120,899 | 15% |
197 Properties |
| 2018 | £103,003 | 9% |
186 Properties |
| 2017 | £93,252 | 2% |
216 Properties |
| 2016 | £91,356 | 5% |
161 Properties |
| 2015 | £86,940 | 13% |
143 Properties |
| 2014 | £75,783 | -6% |
159 Properties |
| 2013 | £80,450 | -1% |
127 Properties |
| 2012 | £81,337 | 9% |
116 Properties |
| 2011 | £73,668 | -7% |
104 Properties |
| 2010 | £78,732 | -9% |
134 Properties |
| 2009 | £86,044 | 10% |
132 Properties |
| 2008 | £77,705 | 11% |
210 Properties |
| 2007 | £69,187 | -4% |
277 Properties |
| 2006 | £72,001 | 23% |
300 Properties |
| 2005 | £55,680 | 13% |
297 Properties |
| 2004 | £48,265 | 25% |
274 Properties |
| 2003 | £36,040 | -4% |
314 Properties |
| 2002 | £37,432 | 26% |
247 Properties |
| 2001 | £27,522 | - |
18 Properties |