
Houses for sale & to rent in Wishaw, North Lanarkshire
House Prices in Wishaw
Properties in Wishaw have an average house price of £135k and had 935 Property Transactions within the last 3 years.¹
Wishaw is an area in North Lanarkshire with 18,068 households², where the most expensive property was sold for £530k.
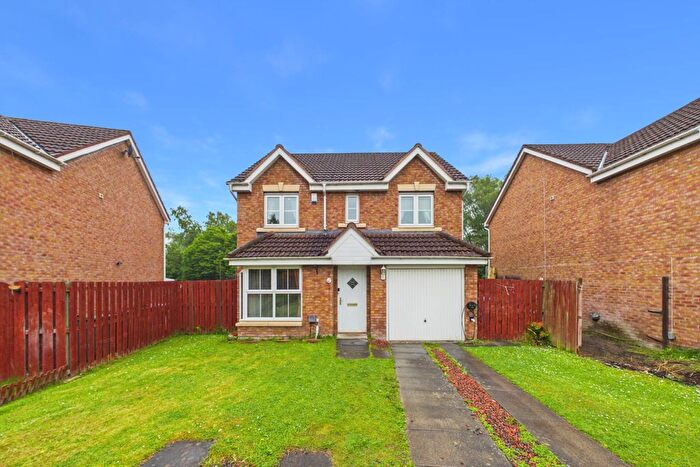
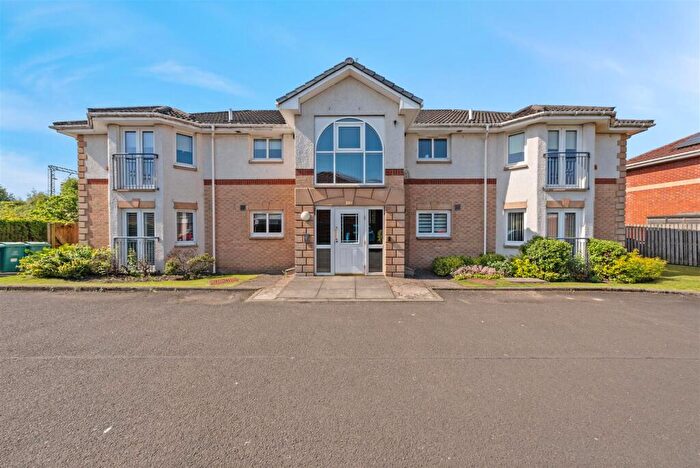
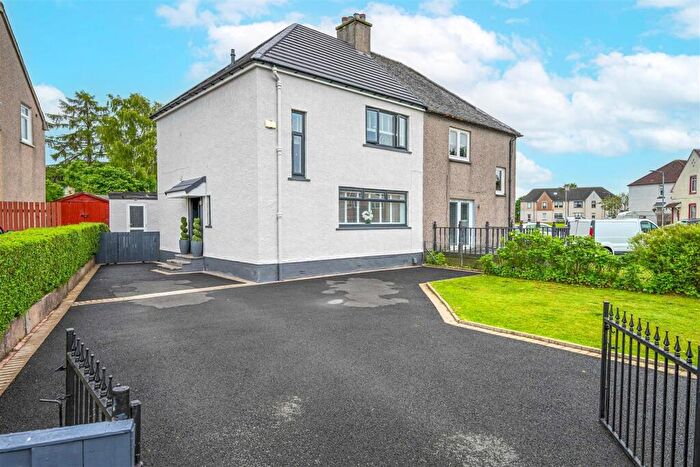
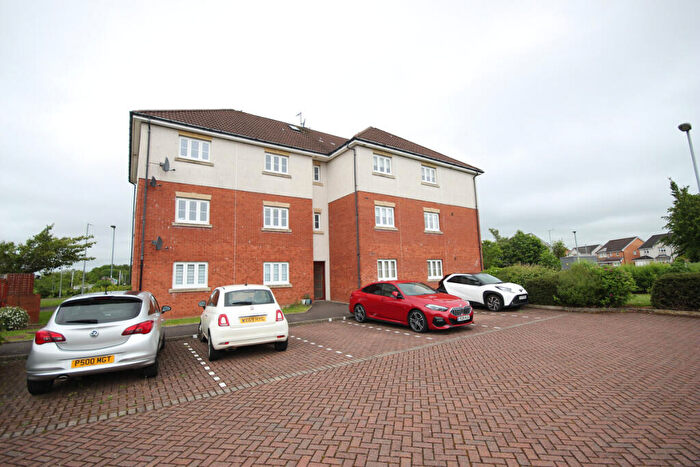
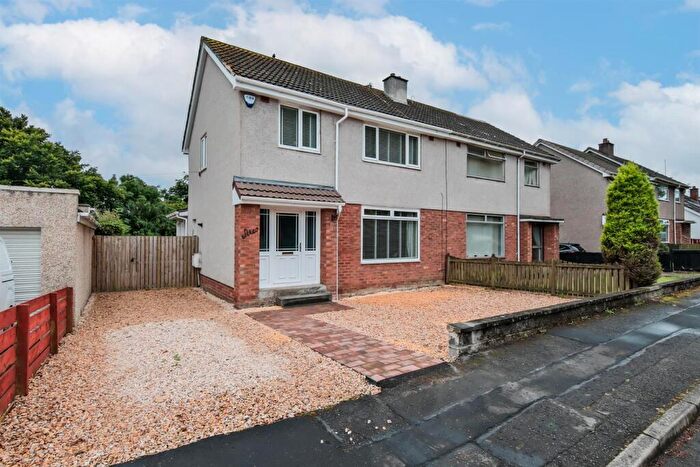
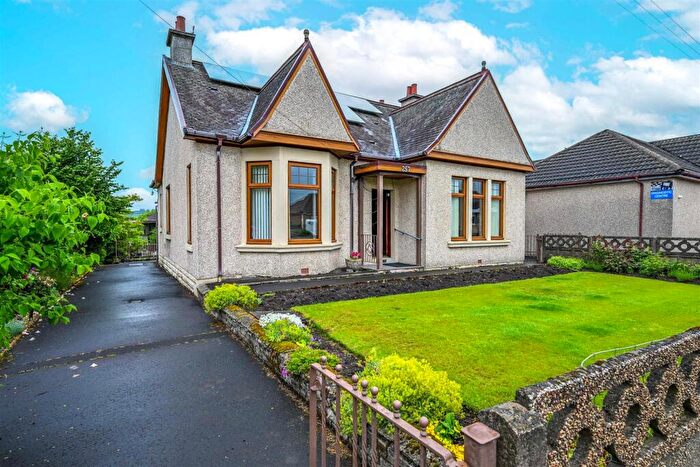
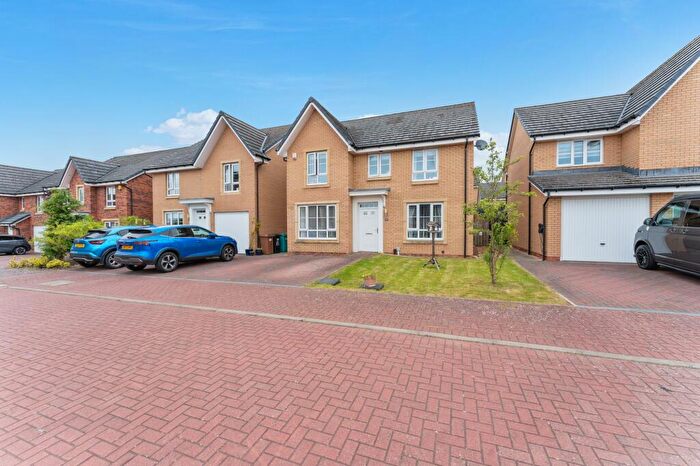
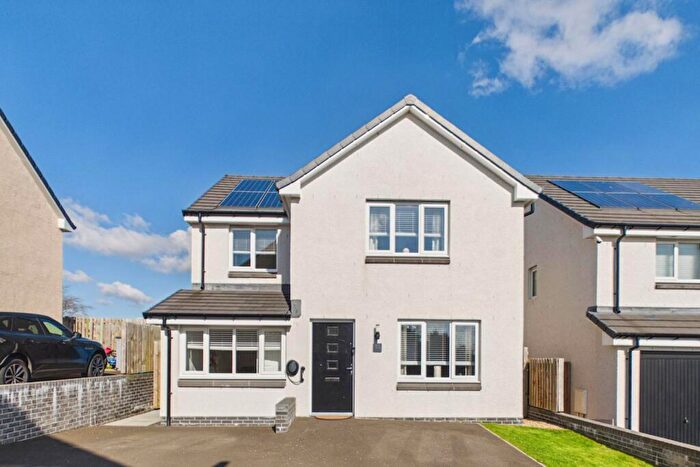
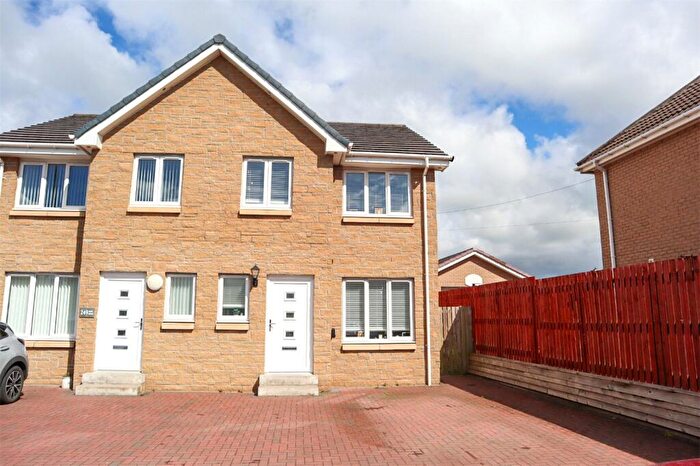
Properties for sale in Wishaw
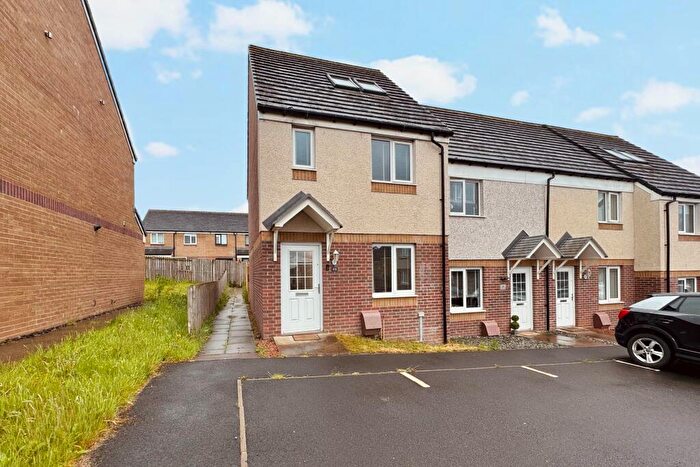
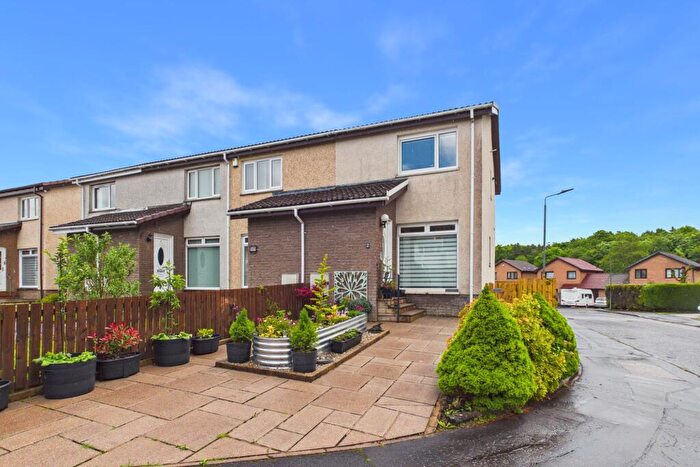
![]()
If you are looking to sell your house, let it out, or receive a property valuation, an expert can help you.
Click the button below to get started.

Neighbourhoods in Wishaw
Navigate through our locations to find the location of your next house in Wishaw, North Lanarkshire for sale or to rent.
Transport in Wishaw
Please see below transportation links in this area:

- FAQ
- Price Paid By Year
Frequently asked questions about Wishaw
What is the average price for a property for sale in Wishaw?
The average price for a property for sale in Wishaw is £134,886. This amount is 10% lower than the average price in North Lanarkshire. There are 9,957 property listings for sale in Wishaw.
What locations have the most expensive properties for sale in Wishaw?
The locations with the most expensive properties for sale in Wishaw are Fortissat at an average of £205,803 and Wishaw at an average of £138,503.
What locations have the most affordable properties for sale in Wishaw?
The locations with the most affordable properties for sale in Wishaw are Motherwell South East and Ravenscraig at an average of £116,388 and Murdostoun at an average of £131,193.
Which train stations are available in or near Wishaw?
Some of the train stations available in or near Wishaw are Wishaw, Shieldmuir and Cleland.
Property Price Paid in Wishaw by Year
The average sold property price by year was:
| Year | Average Sold Price | Price Change |
Sold Properties
|
|---|---|---|---|
| 2025 | £139,366 | 1% |
311 Properties |
| 2024 | £137,421 | 6% |
279 Properties |
| 2023 | £128,798 | 4% |
345 Properties |
| 2022 | £123,935 | 7% |
585 Properties |
| 2021 | £115,695 | 1% |
579 Properties |
| 2020 | £114,981 | 9% |
490 Properties |
| 2019 | £105,096 | 2% |
539 Properties |
| 2018 | £102,480 | -1% |
538 Properties |
| 2017 | £103,771 | 11% |
597 Properties |
| 2016 | £92,859 | 8% |
559 Properties |
| 2015 | £84,966 | -7% |
440 Properties |
| 2014 | £91,187 | -14% |
459 Properties |
| 2013 | £104,187 | 2% |
466 Properties |
| 2012 | £102,145 | -1% |
435 Properties |
| 2011 | £102,892 | 11% |
386 Properties |
| 2010 | £91,173 | -11% |
351 Properties |
| 2009 | £101,255 | 3% |
406 Properties |
| 2008 | £98,106 | 5% |
698 Properties |
| 2007 | £93,185 | -2% |
824 Properties |
| 2006 | £95,244 | 25% |
951 Properties |
| 2005 | £71,736 | 10% |
846 Properties |
| 2004 | £64,260 | -13% |
889 Properties |
| 2003 | £72,315 | 25% |
785 Properties |
| 2002 | £54,077 | 25% |
771 Properties |
| 2001 | £40,801 | - |
77 Properties |