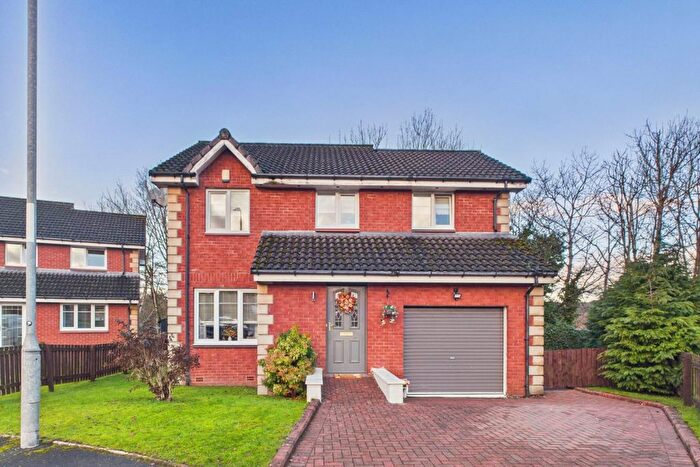
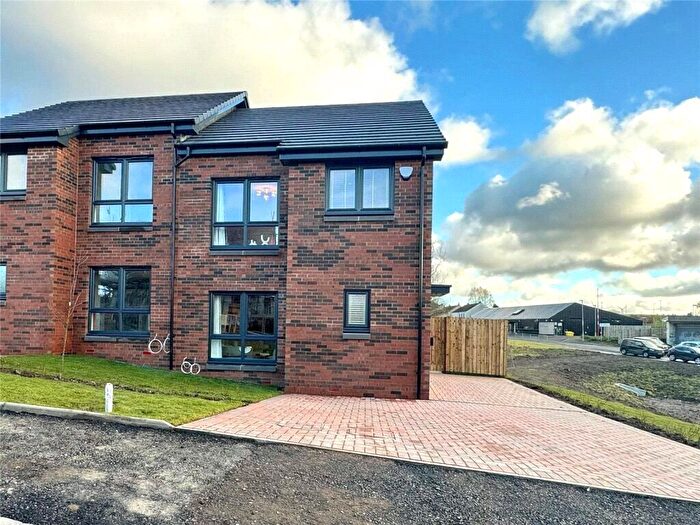
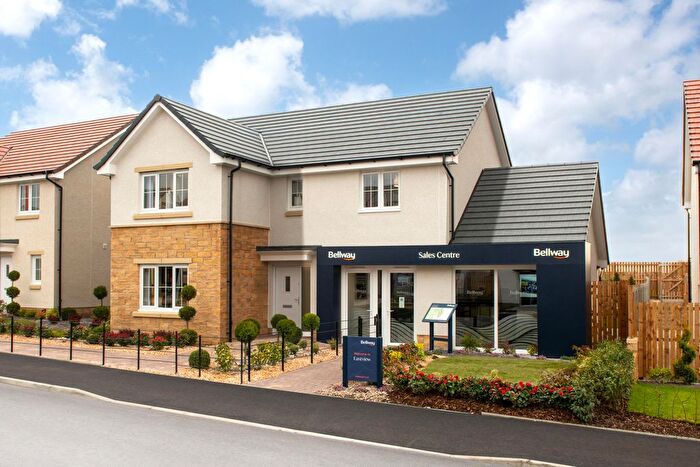
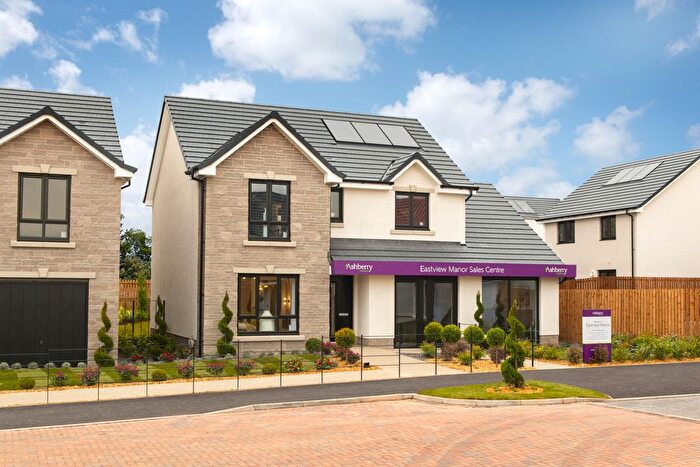
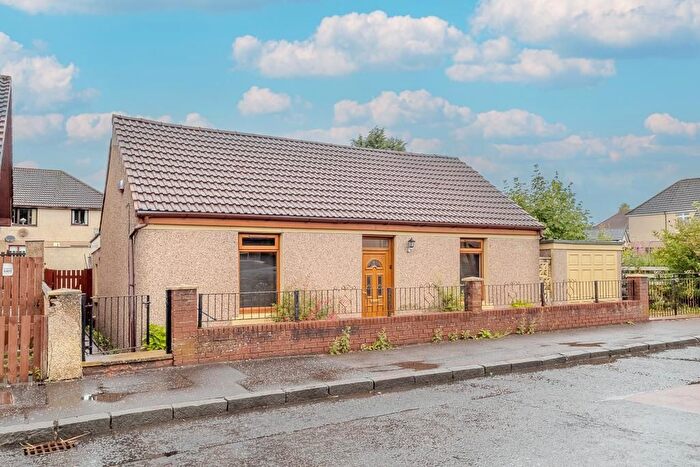
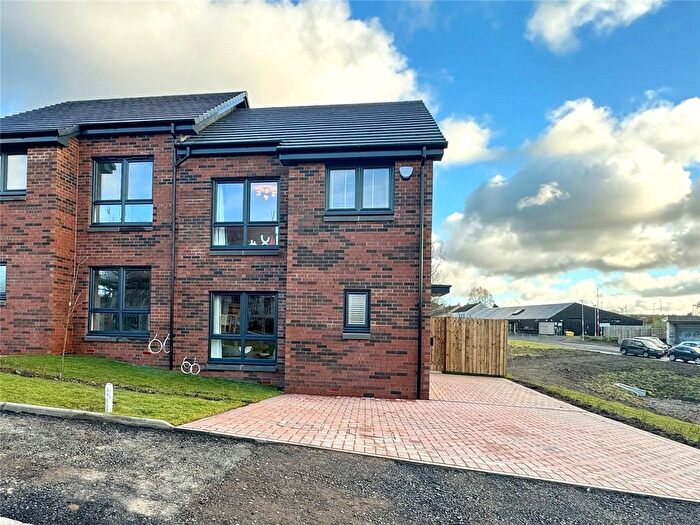
Houses for sale & to rent in Fortissat, Wishaw
House Prices in Fortissat
Properties in Fortissat have an average house price of £180,646.00 and had 27 Property Transactions within the last 3 years¹.
Fortissat is an area in Wishaw, North Lanarkshire with 402 households², where the most expensive property was sold for £290,000.00.
Properties for sale in Fortissat
Previously listed properties in Fortissat
Roads and Postcodes in Fortissat
Navigate through our locations to find the location of your next house in Fortissat, Wishaw for sale or to rent.
| Streets | Postcodes |
|---|---|
| Allanton Road | ML2 9QF |
| Bonkle Road | ML2 9QQ |
| Brownhill View | ML2 9QJ |
| Busby Place | ML2 9QA |
| Cairney Place | ML2 9QU |
| Cathburn Road | ML2 9QL |
| Church Road | ML2 9QG |
| Dalgleish Place | ML2 9RF |
| Ferguson Crescent | ML2 9RD |
| Meadowfield Place | ML2 9QH |
| Mill Road | ML2 9QR |
| Morningside Road | ML2 9QN |
| Murdostoun Road | ML2 9QB ML2 9QE ML2 9QY |
| Rattray Crescent | ML2 9RE |
| School Road | ML2 9QW |
| Shankly Drive | ML2 9QP ML2 9QZ ML2 9RB |
| Stein Place | ML2 9QD |
| Waddell Crescent | ML2 9QX |
| ML2 9BY ML2 9PH ML2 9PJ ML2 9PL |
Transport near Fortissat
- FAQ
- Price Paid By Year
Frequently asked questions about Fortissat
What is the average price for a property for sale in Fortissat?
The average price for a property for sale in Fortissat is £180,646. This amount is 45% higher than the average price in Wishaw. There are 377 property listings for sale in Fortissat.
Which train stations are available in or near Fortissat?
Some of the train stations available in or near Fortissat are Hartwood, Cleland and Wishaw.
Property Price Paid in Fortissat by Year
The average sold property price by year was:
| Year | Average Sold Price | Price Change |
Sold Properties
|
|---|---|---|---|
| 2023 | £119,125 | -61% |
4 Properties |
| 2022 | £191,345 | 4% |
23 Properties |
| 2021 | £184,135 | - |
35 Properties |
| 2020 | £184,101 | 5% |
20 Properties |
| 2019 | £174,530 | 6% |
37 Properties |
| 2018 | £164,041 | 3% |
36 Properties |
| 2017 | £159,852 | 5% |
34 Properties |
| 2016 | £152,622 | -5% |
27 Properties |
| 2015 | £160,767 | -4% |
14 Properties |
| 2014 | £167,376 | 1% |
59 Properties |
| 2013 | £165,363 | -2% |
58 Properties |
| 2012 | £168,689 | -3% |
36 Properties |
| 2011 | £173,883 | 1% |
41 Properties |
| 2010 | £171,278 | 1% |
27 Properties |
| 2009 | £169,633 | 2% |
36 Properties |
| 2008 | £166,657 | 28% |
54 Properties |
| 2007 | £120,266 | -22% |
14 Properties |
| 2006 | £146,717 | -159% |
14 Properties |
| 2005 | £380,156 | 75% |
15 Properties |
| 2004 | £95,563 | 13% |
29 Properties |
| 2003 | £83,454 | 4% |
15 Properties |
| 2002 | £80,373 | - |
15 Properties |

