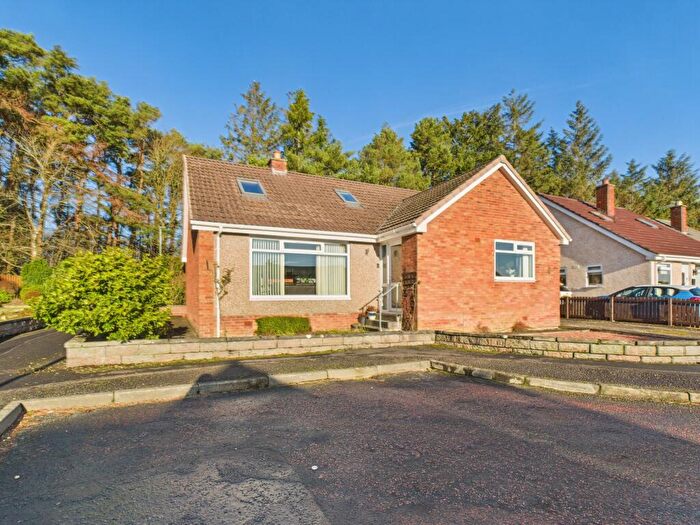
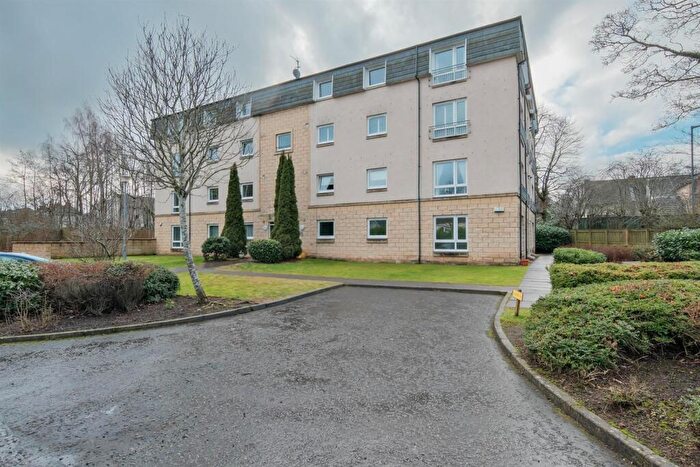
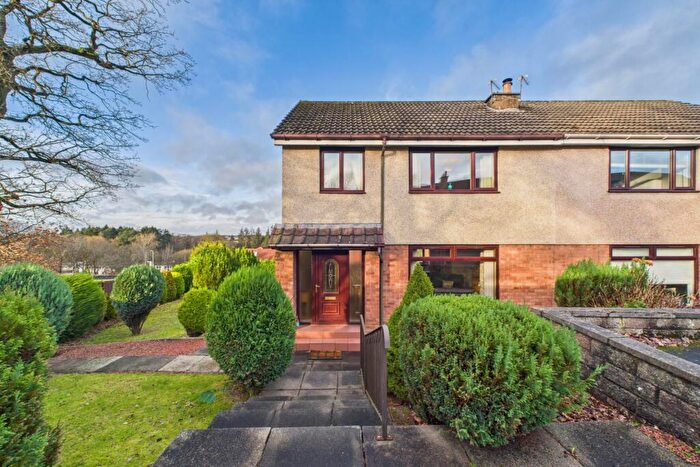
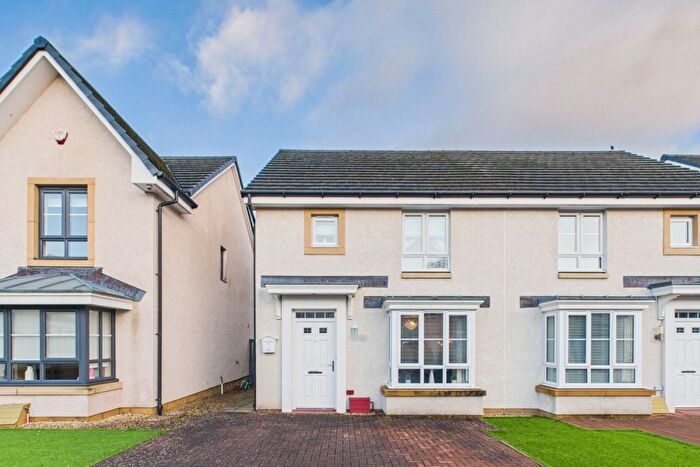
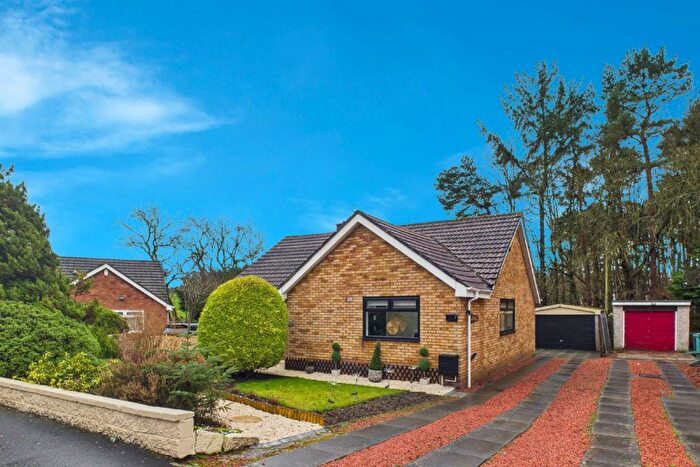
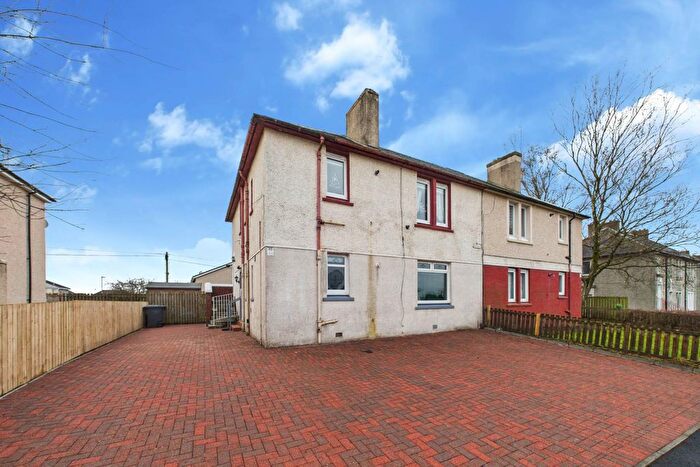
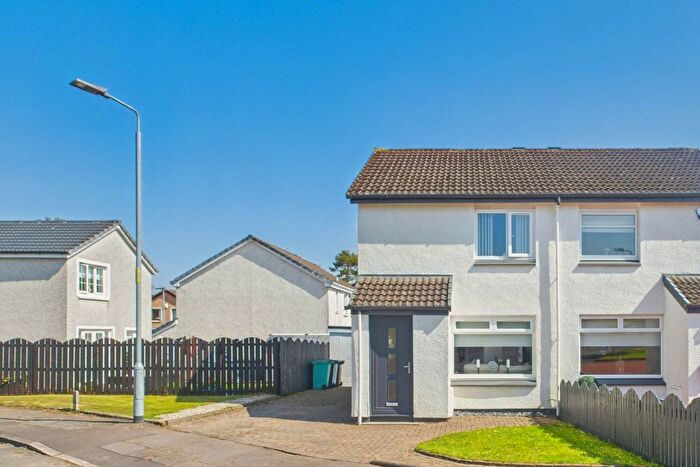
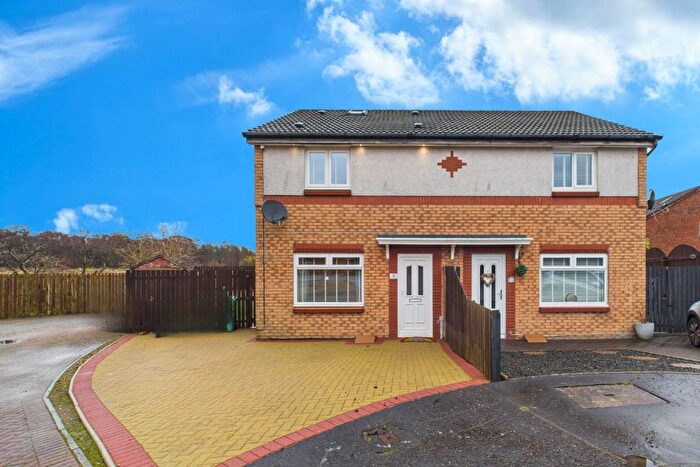
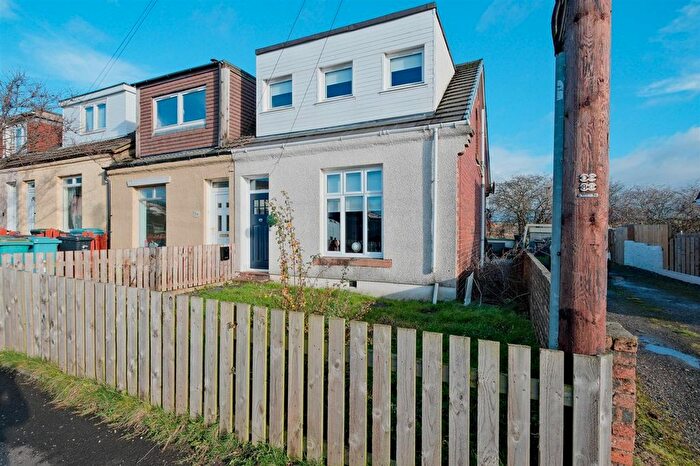
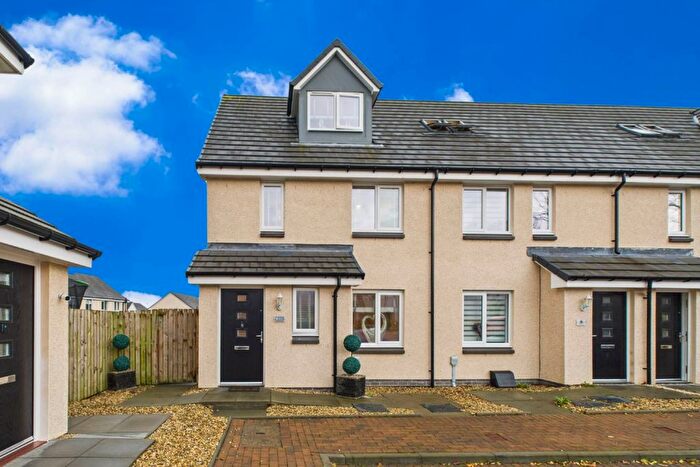
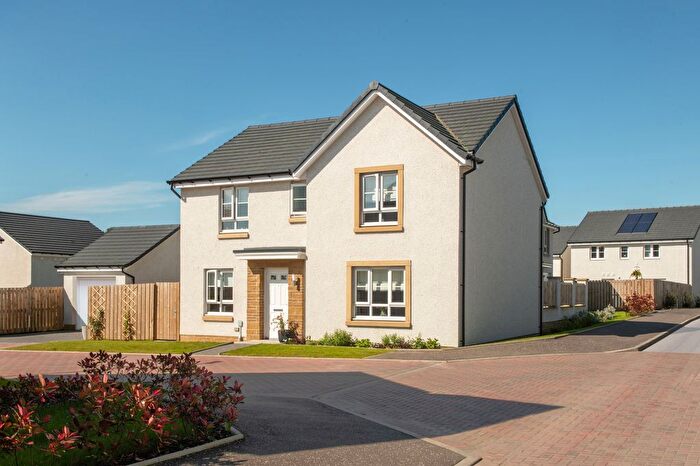
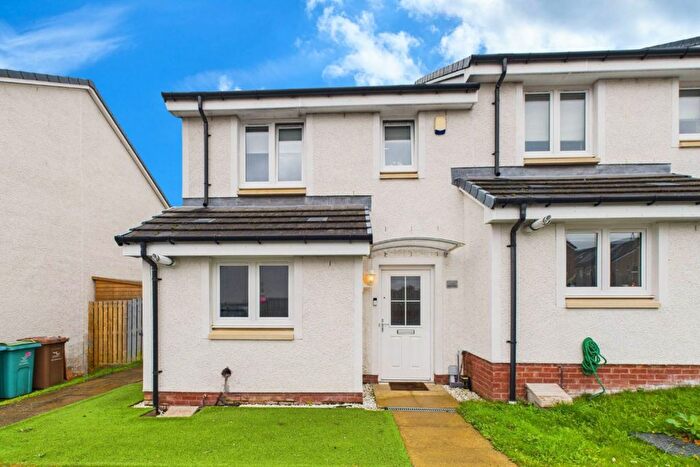
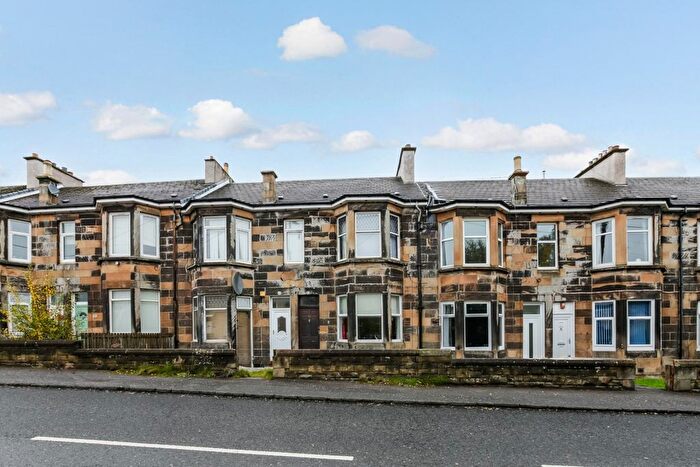
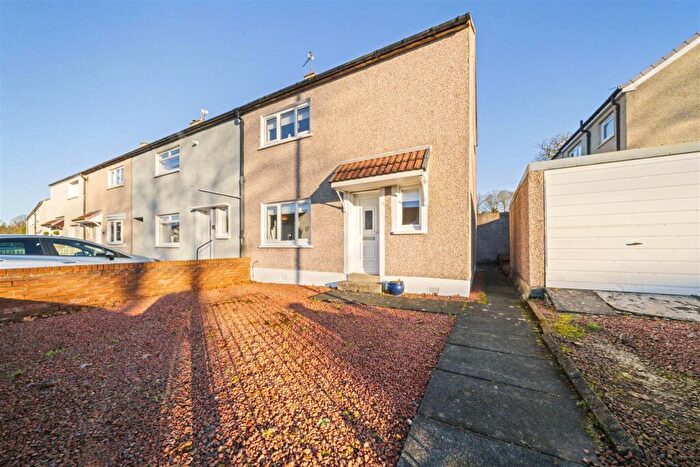
Houses for sale & to rent in Murdostoun, Motherwell
House Prices in Murdostoun
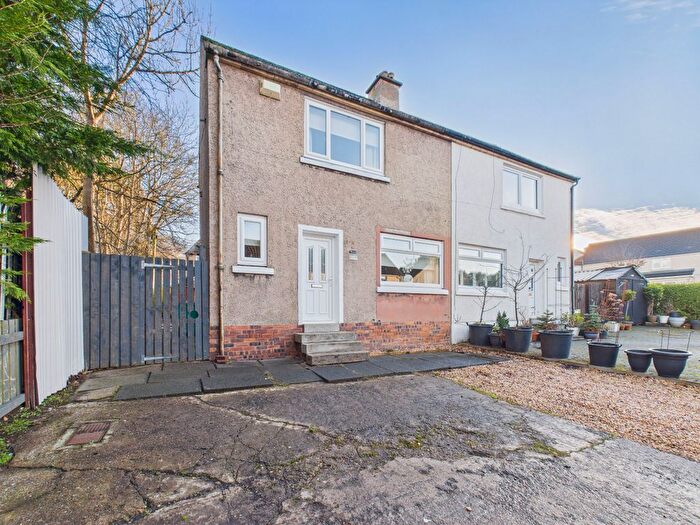
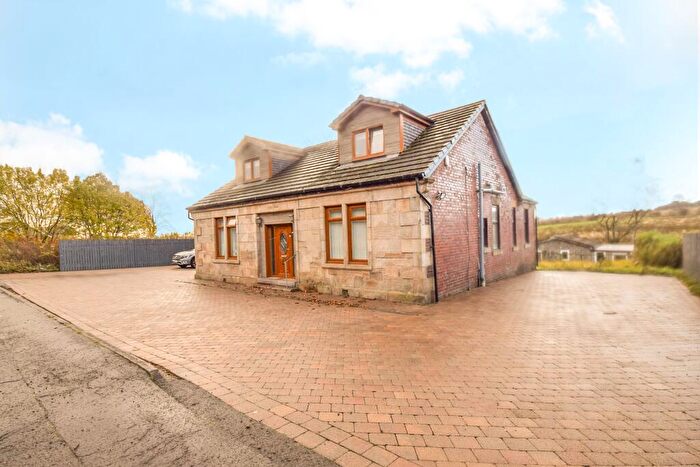
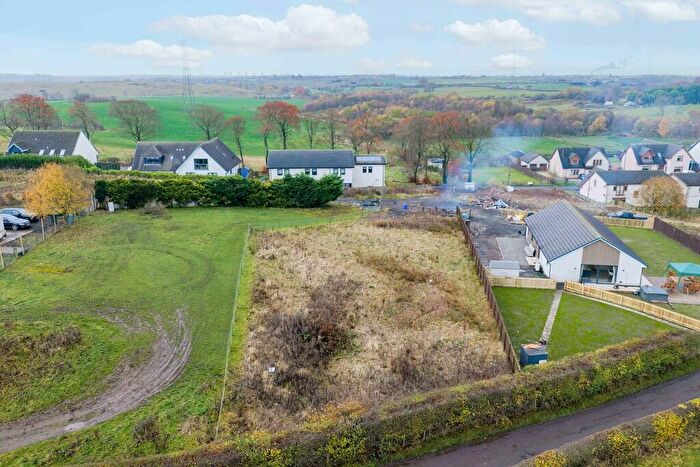
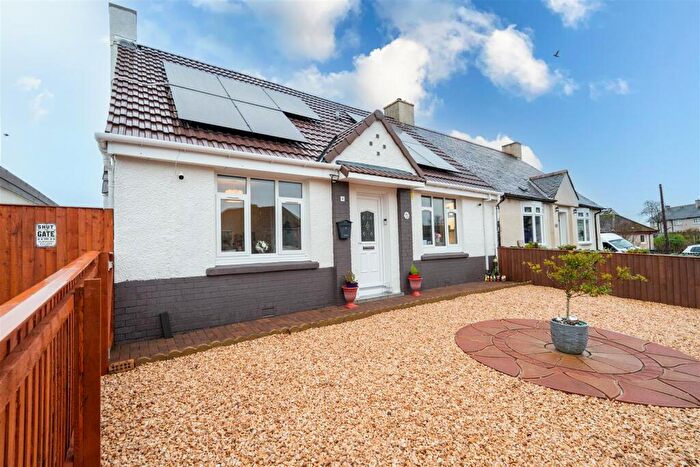
Properties in Murdostoun have an average house price of £237,176.00 and had 7 Property Transactions within the last 3 years¹.
Murdostoun is an area in Motherwell, North Lanarkshire with 1,457 households², where the most expensive property was sold for £535,000.00.
Properties for sale in Murdostoun
Previously listed properties in Murdostoun
Roads and Postcodes in Murdostoun
Navigate through our locations to find the location of your next house in Murdostoun, Motherwell for sale or to rent.
| Streets | Postcodes |
|---|---|
| Aberlady Street | ML1 5RJ |
| Aldersyde Terrace | ML1 5RR |
| Auchinlea Drive | ML1 5QH ML1 5QJ |
| Baxter Brae | ML1 5FG |
| Bellside Road | ML1 5NP ML1 5NR ML1 5NU |
| Biggar Road | ML1 5PB ML1 5PL ML1 5PS |
| Braid Avenue | ML1 5ET |
| Captains Walk | ML1 5TU |
| Carey Gardens | ML1 5RS |
| Carlisle Road | ML1 5LR ML1 5NX |
| Carrick Vale | ML1 5RP |
| Chapel Street | ML1 5QX ML1 5QZ |
| Chapelknowe Road | ML1 5LF |
| Cleland | ML1 5LT ML1 5LU |
| Cotton Vale | ML1 5NL |
| Crossgates Avenue | ML1 5PU |
| Crosshill Drive | ML1 5PT |
| Culter Fell Path | ML1 5PN |
| Curriefield View | ML1 5GQ |
| Delaney Wynd | ML1 5FH |
| Dickson Square | ML1 5RH |
| Faulkner Grove | ML1 5LD |
| Fir Place | ML1 5RF |
| Foundry Road | ML1 5PD |
| Fraser Street | ML1 5PW ML1 5PX |
| Gibb Street | ML1 5QY |
| Glen Isla Quadrant | ML1 5SR |
| Glen Noble | ML1 5FB |
| Glen Orchy Road | ML1 5SA |
| Gorsehall Street | ML1 5PF ML1 5PZ ML1 5QB |
| Gray Street | ML1 5RL |
| Green Gardens | ML1 5PH |
| Hagen Drive | ML1 5RZ |
| Hazel Path | ML1 5RG |
| Heatherhall | ML1 5FX |
| Hogan Way | ML1 5TR |
| Hornshill Drive | ML1 5QD |
| Jones Wynd | ML1 5NJ |
| Jordan Place | ML1 5GB |
| Kneeland Brae | ML1 5FT |
| Knowenoble Street | ML1 5PR |
| Langbyres Road | ML1 5NS |
| Lawrie Place | ML1 5FP |
| Leonard Grove | ML1 5JJ |
| Lithgow Drive | ML1 5RB ML1 5RD |
| Locke Grove | ML1 5ES |
| Logan Gardens | ML1 5RN |
| Lotus Crescent | ML1 5FU |
| Main Street | ML1 5QN ML1 5QR ML1 5QW |
| Mennock Street | ML1 5PQ |
| Morris Crescent | ML1 5NH |
| Muircroft Drive | ML1 5QF |
| Muirmaillen Avenue | ML1 5RW |
| Murdostoun Terrace | ML1 5PA |
| Nagle Gardens | ML1 5LA |
| Nith Path | ML1 5PG |
| North & South Road | ML1 5LB |
| Old Station Road | ML1 5RA |
| Olive Drive | ML1 5FY |
| Omoa Road | ML1 5LQ ML1 5RE ML1 5RQ |
| Park Street | ML1 5PP |
| Queens Crescent | ML1 5PY |
| Ravenshall | ML1 5HT |
| Ravenshill Drive | ML1 5QL |
| Rodger Way | ML1 5GA |
| Sarazen Court | ML1 5TW |
| Scarhill Street | ML1 5QE |
| Shawstonfoot Road | ML1 5NY |
| Snead View | ML1 5GL |
| Spindleside Road | ML1 5LW ML1 5NT |
| Station Road | ML1 5NW |
| Sunnyside Road | ML1 5QT |
| Swinstie Road | ML1 5LN |
| Swinstie View | ML1 5QQ |
| Thistle Street | ML1 5UA |
| Tinto Way | ML1 5PJ |
| Vardon Lea | ML1 5NN |
| Watersaugh Drive | ML1 5QA |
| Westwood Drive | ML1 5NZ |
| Wilsgait Street | ML1 5PE |
| Wishaw High Road | ML1 5LL ML1 5QS |
| Wishaw Low Road | ML1 5LJ ML1 5QU |
Transport near Murdostoun
- FAQ
- Price Paid By Year
Frequently asked questions about Murdostoun
What is the average price for a property for sale in Murdostoun?
The average price for a property for sale in Murdostoun is £237,176. This amount is 60% higher than the average price in Motherwell. There are 750 property listings for sale in Murdostoun.
Which train stations are available in or near Murdostoun?
Some of the train stations available in or near Murdostoun are Cleland, Carfin and Wishaw.
Property Price Paid in Murdostoun by Year
The average sold property price by year was:
| Year | Average Sold Price | Price Change |
Sold Properties
|
|---|---|---|---|
| 2023 | £237,176 | 14% |
7 Properties |
| 2022 | £204,266 | 10% |
72 Properties |
| 2021 | £183,543 | -5% |
56 Properties |
| 2020 | £191,926 | 15% |
54 Properties |
| 2019 | £162,629 | -21% |
54 Properties |
| 2018 | £196,511 | 17% |
62 Properties |
| 2017 | £163,576 | -7% |
64 Properties |
| 2016 | £175,686 | 25% |
55 Properties |
| 2015 | £132,255 | -23% |
72 Properties |
| 2014 | £162,291 | 17% |
52 Properties |
| 2013 | £134,331 | -13% |
52 Properties |
| 2012 | £152,082 | 12% |
44 Properties |
| 2011 | £134,317 | -7% |
42 Properties |
| 2010 | £143,177 | 25% |
29 Properties |
| 2009 | £106,874 | -6% |
34 Properties |
| 2008 | £113,813 | -81% |
55 Properties |
| 2007 | £206,114 | 40% |
78 Properties |
| 2006 | £122,784 | -4% |
91 Properties |
| 2005 | £127,084 | 41% |
80 Properties |
| 2004 | £75,052 | 35% |
63 Properties |
| 2003 | £48,656 | 5% |
62 Properties |
| 2002 | £46,245 | -91% |
68 Properties |
| 2001 | £88,446 | - |
6 Properties |

