
Houses for sale & to rent in Highland, Aberfeldy
House Prices in Highland
Properties in Highland have an average house price of £278k and had 87 Property Transactions within the last 3 years¹.
Highland is an area in Aberfeldy, Perth and Kinross with 1,546 households², where the most expensive property was sold for £1.42M.
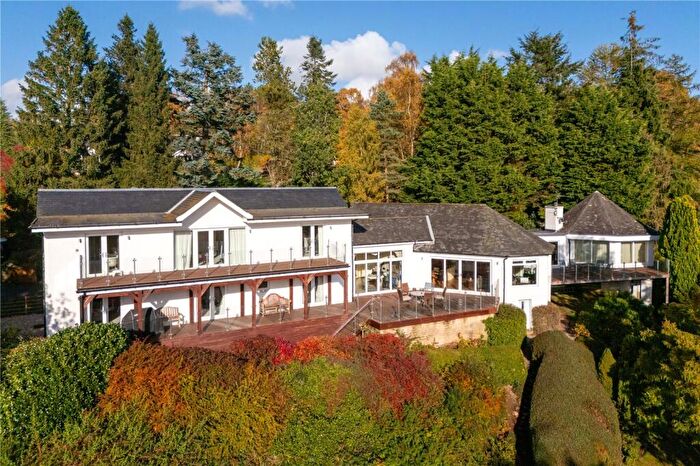
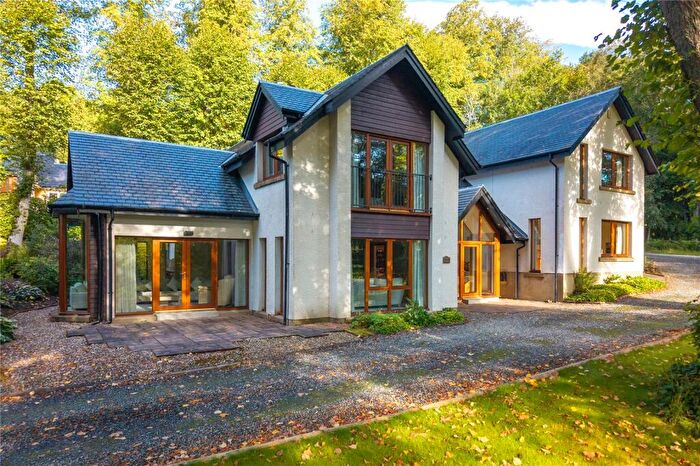
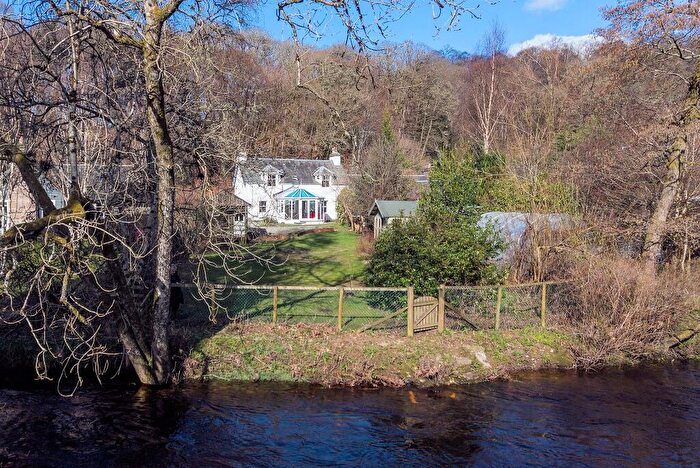
Properties for sale in Highland

![]()
If you are looking to sell your house, let it out, or receive a property valuation, an expert can help you.
Click the button below to get started.


Roads and Postcodes in Highland
Navigate through our locations to find the location of your next house in Highland, Aberfeldy for sale or to rent.
Transport near Highland

- FAQ
- Price Paid By Year
Frequently asked questions about Highland
What is the average price for a property for sale in Highland?
The average price for a property for sale in Highland is £277,558. There are 1,636 property listings for sale in Highland.
What streets have the most expensive properties for sale in Highland?
The streets with the most expensive properties for sale in Highland are Urlar Road at an average of £700,000, Taybridge Terrace at an average of £445,000 and Braeside Park at an average of £420,105.
What streets have the most affordable properties for sale in Highland?
The streets with the most affordable properties for sale in Highland are Market Street at an average of £113,333, Breadalbane Terrace at an average of £117,312 and Crieff Road at an average of £119,750.
Which train stations are available in or near Highland?
Some of the train stations available in or near Highland are Pitlochry, Blair Atholl and Dunkeld and Birnam.
Property Price Paid in Highland by Year
The average sold property price by year was:
| Year | Average Sold Price | Price Change |
Sold Properties
|
|---|---|---|---|
| 2025 | £261,025 | -2% |
22 Properties |
| 2024 | £266,690 | -9% |
21 Properties |
| 2023 | £291,011 | -23% |
44 Properties |
| 2022 | £357,170 | 12% |
98 Properties |
| 2021 | £314,506 | 4% |
103 Properties |
| 2020 | £302,616 | 21% |
76 Properties |
| 2019 | £239,014 | -1% |
91 Properties |
| 2018 | £240,930 | -27% |
72 Properties |
| 2017 | £304,784 | 23% |
72 Properties |
| 2016 | £235,942 | -4% |
90 Properties |
| 2015 | £245,270 | 6% |
93 Properties |
| 2014 | £230,681 | 1% |
65 Properties |
| 2013 | £227,478 | -3% |
64 Properties |
| 2012 | £234,847 | 5% |
72 Properties |
| 2011 | £222,070 | 6% |
68 Properties |
| 2010 | £208,731 | -22% |
64 Properties |
| 2009 | £253,985 | 25% |
57 Properties |
| 2008 | £190,239 | -27% |
62 Properties |
| 2007 | £241,863 | -17% |
84 Properties |
| 2006 | £283,146 | 24% |
104 Properties |
| 2005 | £214,066 | 46% |
80 Properties |
| 2004 | £115,192 | -20% |
90 Properties |
| 2003 | £137,995 | 34% |
104 Properties |
| 2002 | £91,057 | 23% |
126 Properties |
| 2001 | £69,951 | - |
13 Properties |