
Houses for sale & to rent in Highland, Pitlochry
House Prices in Highland
Properties in Highland have an average house price of £251k and had 120 Property Transactions within the last 3 years¹.
Highland is an area in Pitlochry, Perth and Kinross with 2,635 households², where the most expensive property was sold for £780k.
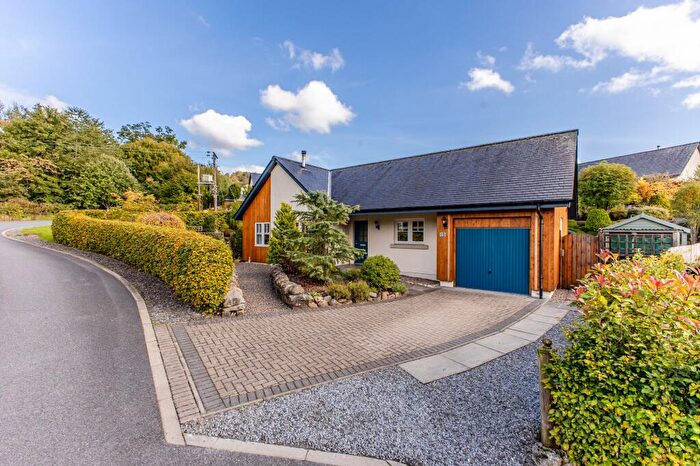
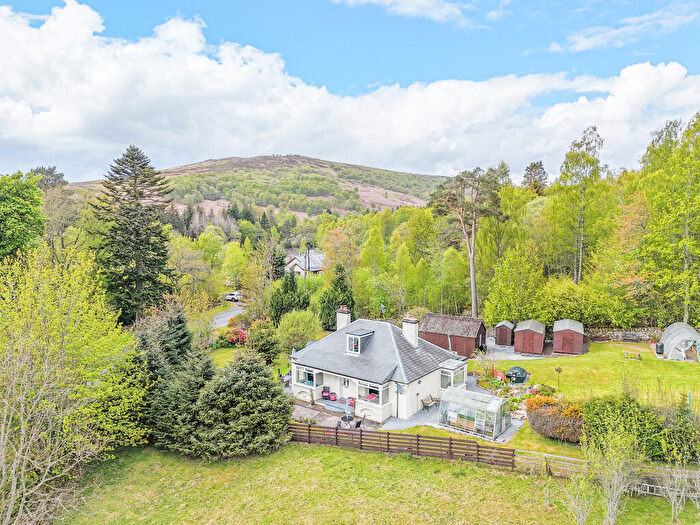
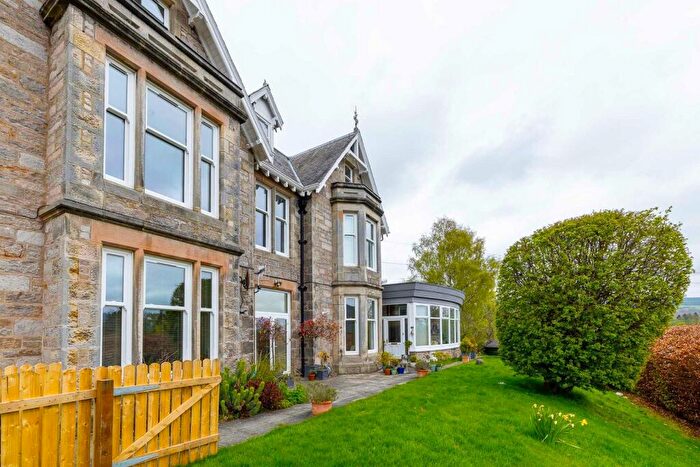
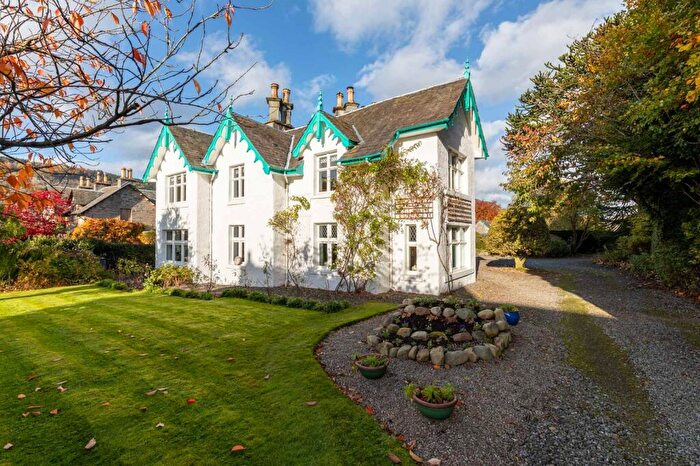
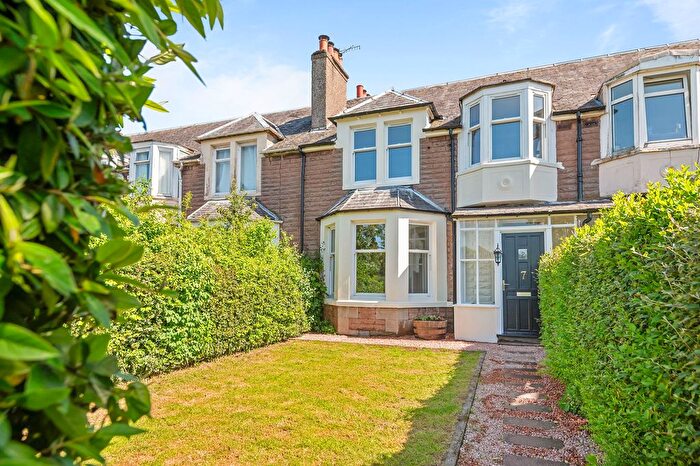
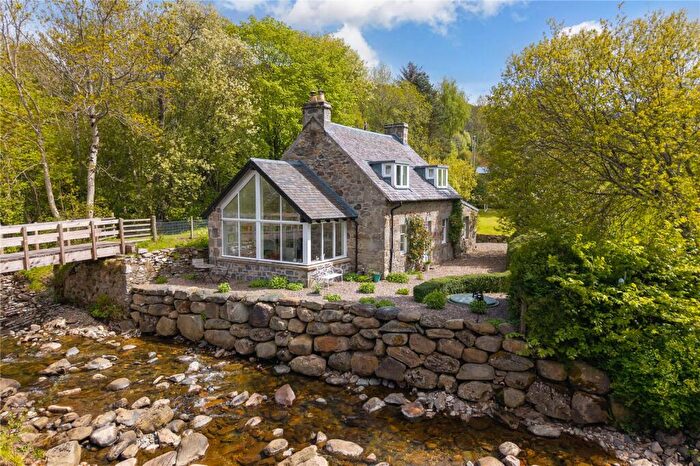
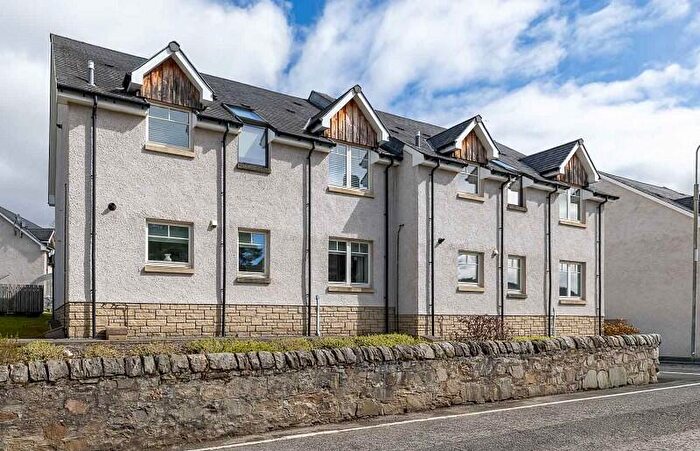
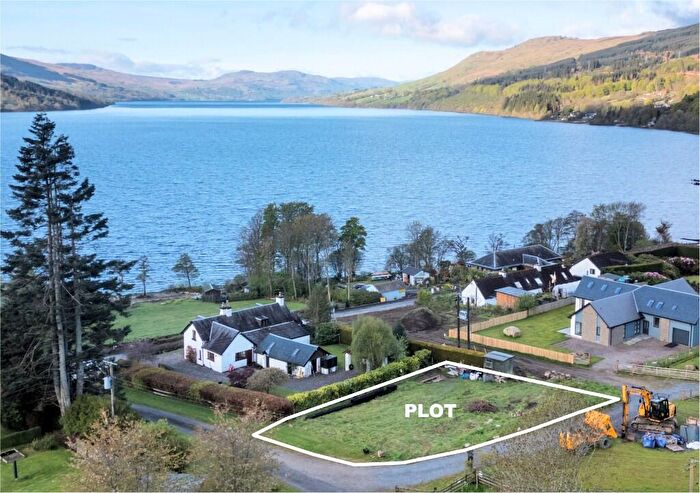
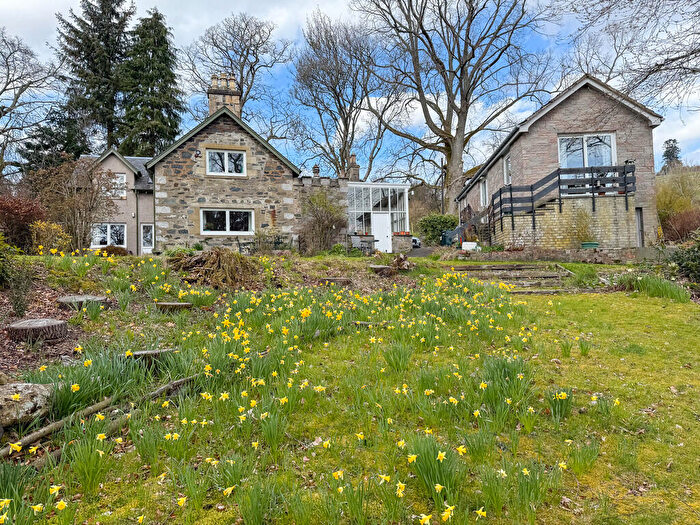
Properties for sale in Highland
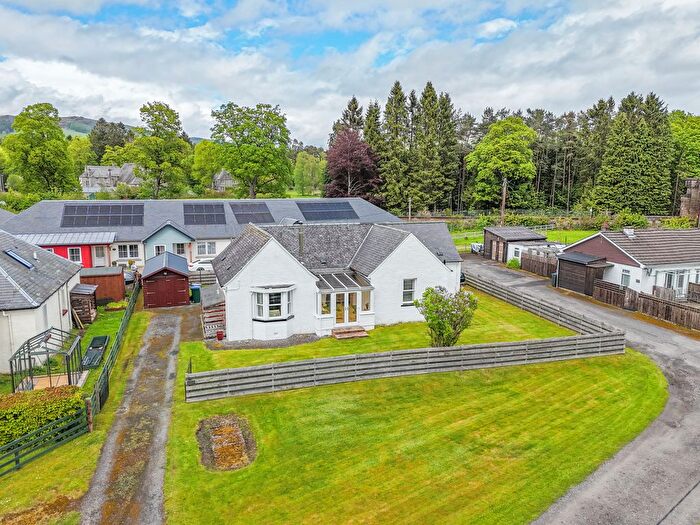

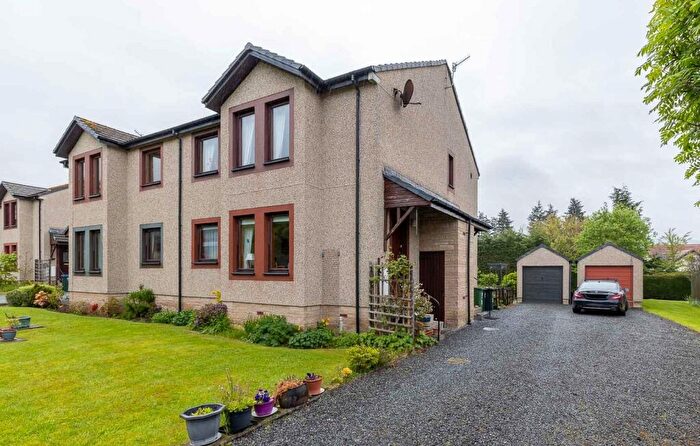
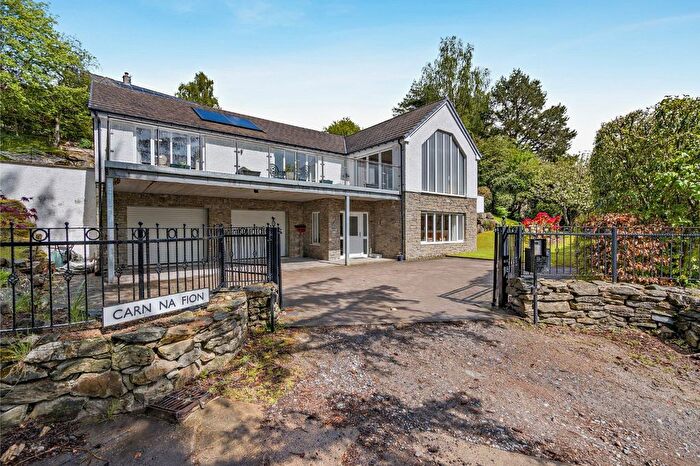
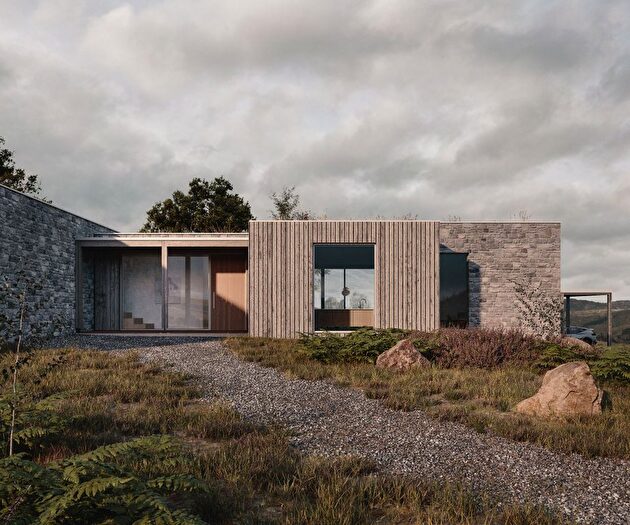

![]()
If you are looking to sell your house, let it out, or receive a property valuation, an expert can help you.
Click the button below to get started.


Roads and Postcodes in Highland
Navigate through our locations to find the location of your next house in Highland, Pitlochry for sale or to rent.
Transport near Highland

- FAQ
- Price Paid By Year
Frequently asked questions about Highland
What is the average price for a property for sale in Highland?
The average price for a property for sale in Highland is £251,170. There are 1,557 property listings for sale in Highland.
What streets have the most expensive properties for sale in Highland?
The streets with the most expensive properties for sale in Highland are Craiglunie Gardens at an average of £780,000, Croftcroy at an average of £530,000 and Cuilc Brae at an average of £465,400.
What streets have the most affordable properties for sale in Highland?
The streets with the most affordable properties for sale in Highland are Schiehallion Place at an average of £125,000, Aldour Gardens at an average of £129,000 and Kennedy Place at an average of £131,500.
Which train stations are available in or near Highland?
Some of the train stations available in or near Highland are Pitlochry, Blair Atholl and Dunkeld and Birnam.
Property Price Paid in Highland by Year
The average sold property price by year was:
| Year | Average Sold Price | Price Change |
Sold Properties
|
|---|---|---|---|
| 2025 | £241,819 | 6% |
37 Properties |
| 2024 | £226,129 | -21% |
32 Properties |
| 2023 | £273,665 | -4% |
51 Properties |
| 2022 | £283,945 | -1% |
105 Properties |
| 2021 | £285,565 | 6% |
183 Properties |
| 2020 | £269,653 | 18% |
115 Properties |
| 2019 | £221,295 | -4% |
115 Properties |
| 2018 | £230,847 | 8% |
123 Properties |
| 2017 | £212,576 | -11% |
120 Properties |
| 2016 | £236,058 | 4% |
107 Properties |
| 2015 | £225,459 | 5% |
121 Properties |
| 2014 | £214,111 | -3% |
135 Properties |
| 2013 | £220,575 | 1% |
109 Properties |
| 2012 | £218,366 | -10% |
84 Properties |
| 2011 | £239,369 | 6% |
104 Properties |
| 2010 | £225,821 | -17% |
79 Properties |
| 2009 | £264,957 | 14% |
85 Properties |
| 2008 | £227,529 | -14% |
102 Properties |
| 2007 | £259,297 | 1% |
106 Properties |
| 2006 | £256,615 | 30% |
139 Properties |
| 2005 | £179,269 | 14% |
118 Properties |
| 2004 | £153,395 | 14% |
108 Properties |
| 2003 | £131,861 | 4% |
143 Properties |
| 2002 | £126,571 | -64% |
143 Properties |
| 2001 | £207,046 | - |
10 Properties |