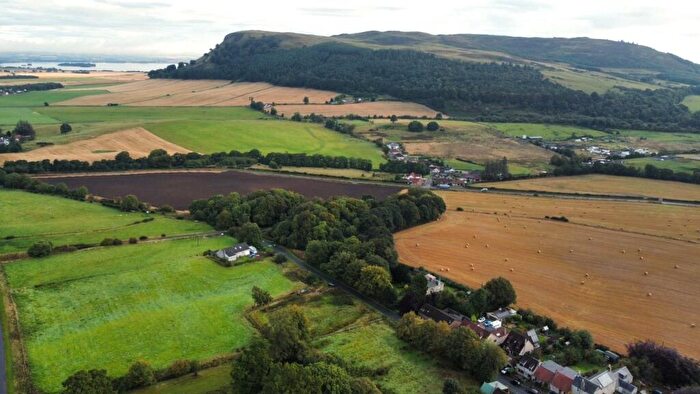
Houses for sale & to rent in Kinross-shire, Cowdenbeath
House Prices in Kinross-shire
Properties in Kinross-shire have an average house price of £490,000.00 and had 3 Property Transactions within the last 3 years¹.
Kinross-shire is an area in Cowdenbeath, Perth and Kinross with 156 households², where the most expensive property was sold for £760,000.00.
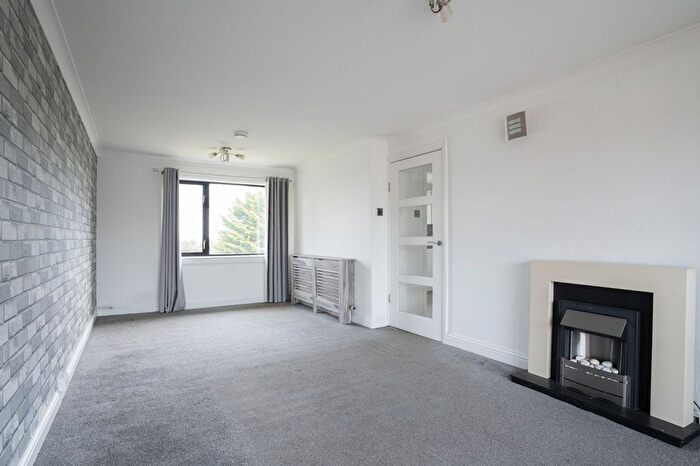
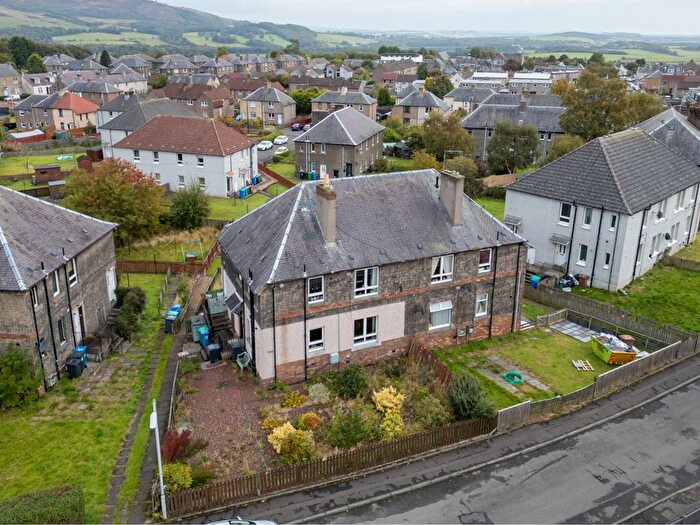
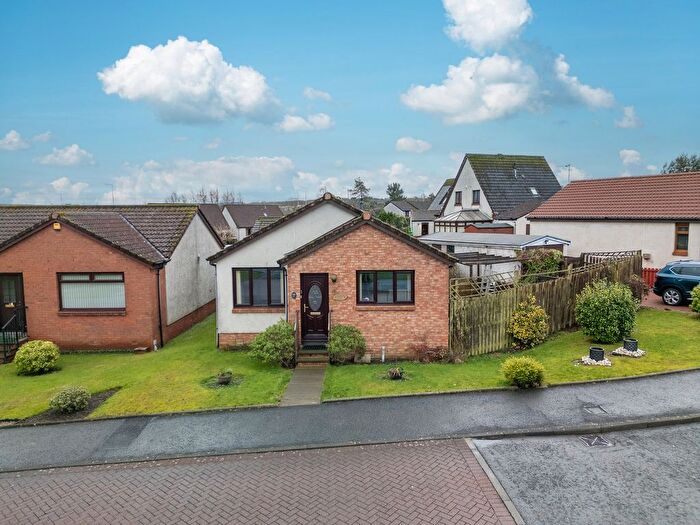
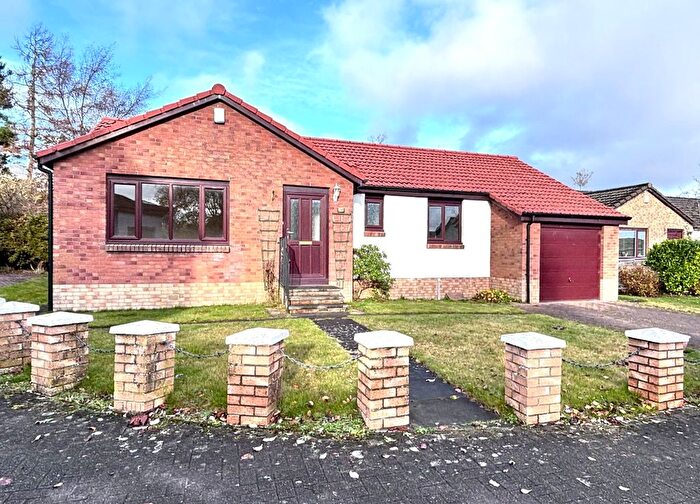
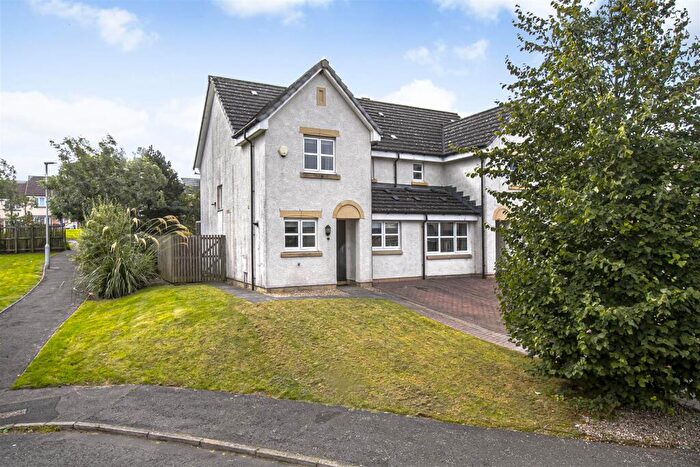
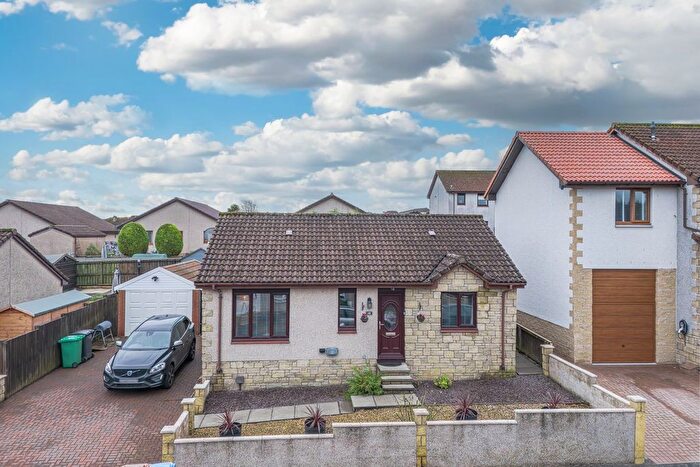
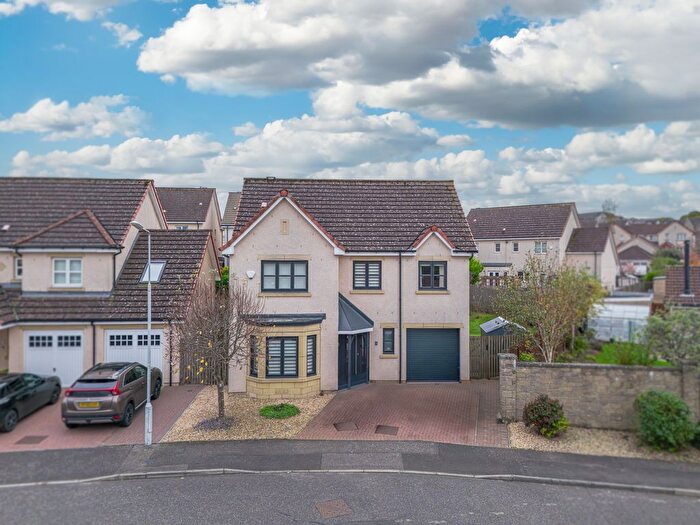
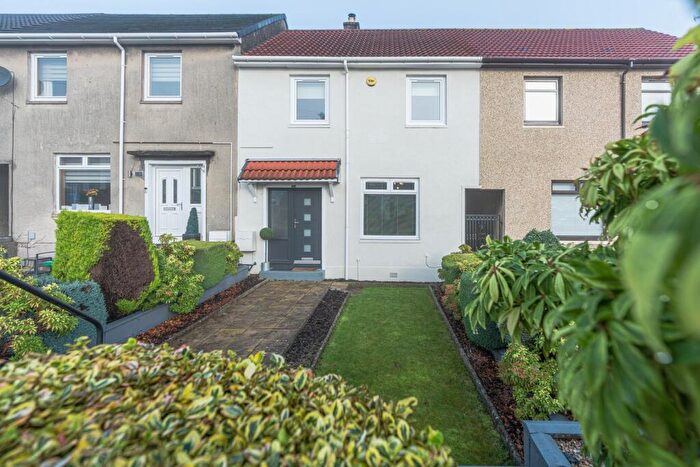
Properties for sale in Kinross-shire
Previously listed properties in Kinross-shire
Roads and Postcodes in Kinross-shire
Navigate through our locations to find the location of your next house in Kinross-shire, Cowdenbeath for sale or to rent.
| Streets | Postcodes |
|---|---|
| Abbots Wynd | KY4 0JS |
| Benarty Road | KY4 0HR |
| Blairadam Grovebridge | KY4 0JU |
| Keltybridge | KY4 0JH |
| Maryburgh | KY4 0JE |
| Middleton Park | KY4 0GZ |
| KY4 0HP KY4 0HU KY4 0HX KY4 0HY KY4 0HZ KY4 0JA KY4 0JB KY4 0JD KY4 0JF KY4 0JG |
Transport near Kinross-shire
- FAQ
- Price Paid By Year
Frequently asked questions about Kinross-shire
What is the average price for a property for sale in Kinross-shire?
The average price for a property for sale in Kinross-shire is £490,000. There are 385 property listings for sale in Kinross-shire.
Which train stations are available in or near Kinross-shire?
Some of the train stations available in or near Kinross-shire are Lochgelly, Cowdenbeath and Dunfermline.
Property Price Paid in Kinross-shire by Year
The average sold property price by year was:
| Year | Average Sold Price | Price Change |
Sold Properties
|
|---|---|---|---|
| 2023 | £490,000 | 1% |
3 Properties |
| 2022 | £486,624 | 26% |
5 Properties |
| 2021 | £359,875 | 22% |
12 Properties |
| 2020 | £282,450 | 5% |
10 Properties |
| 2019 | £267,525 | -24% |
4 Properties |
| 2018 | £332,300 | 5% |
5 Properties |
| 2017 | £317,200 | 32% |
5 Properties |
| 2016 | £216,437 | -2% |
8 Properties |
| 2015 | £221,833 | -36% |
9 Properties |
| 2014 | £301,833 | -18% |
9 Properties |
| 2013 | £354,714 | 2% |
7 Properties |
| 2012 | £346,650 | 42% |
11 Properties |
| 2011 | £200,580 | -37% |
3 Properties |
| 2010 | £274,444 | -24% |
9 Properties |
| 2009 | £341,125 | -14% |
6 Properties |
| 2008 | £388,032 | 35% |
4 Properties |
| 2007 | £252,500 | -1% |
8 Properties |
| 2006 | £254,937 | 55% |
12 Properties |
| 2005 | £115,665 | -30% |
3 Properties |
| 2004 | £150,543 | 34% |
7 Properties |
| 2003 | £99,125 | -4% |
4 Properties |
| 2002 | £102,966 | -32% |
9 Properties |
| 2001 | £135,552 | - |
1 Property |

