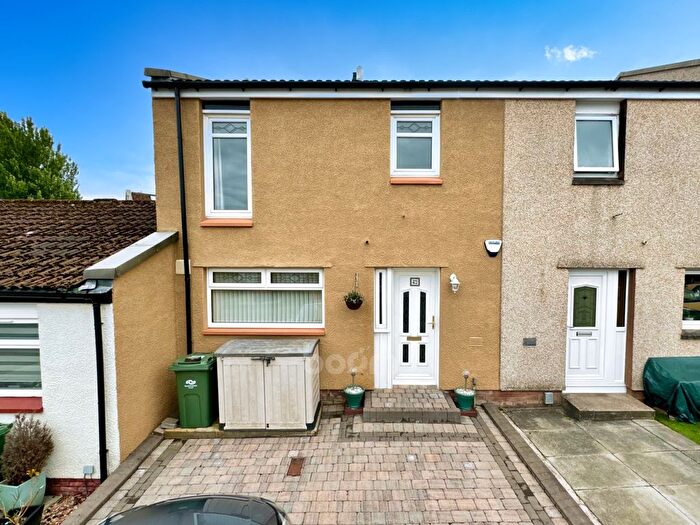
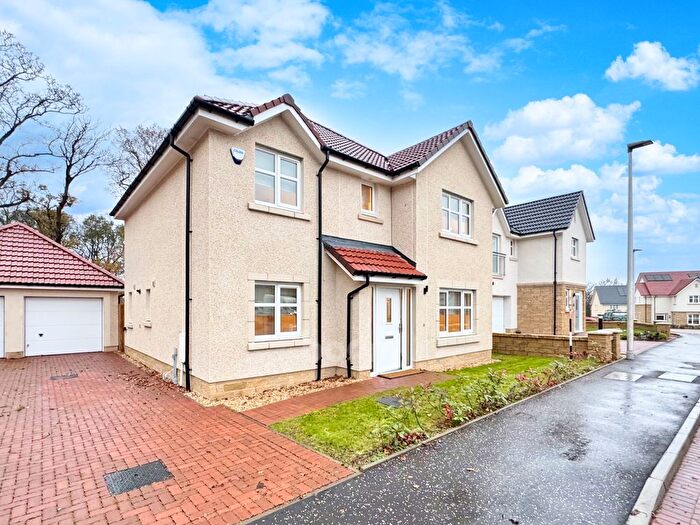
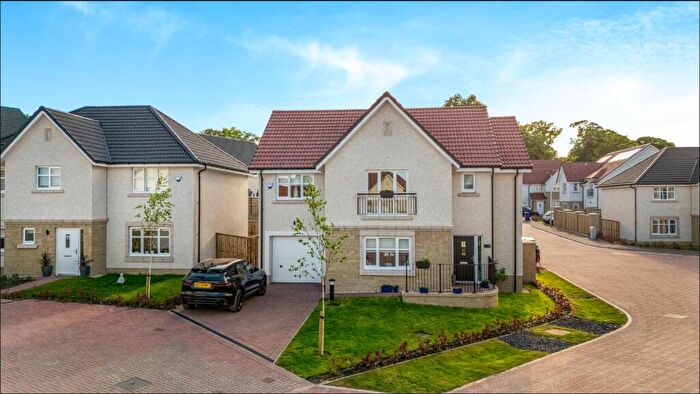
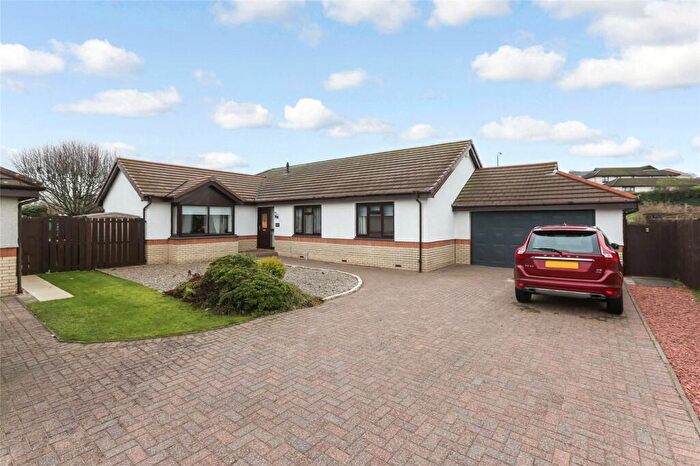
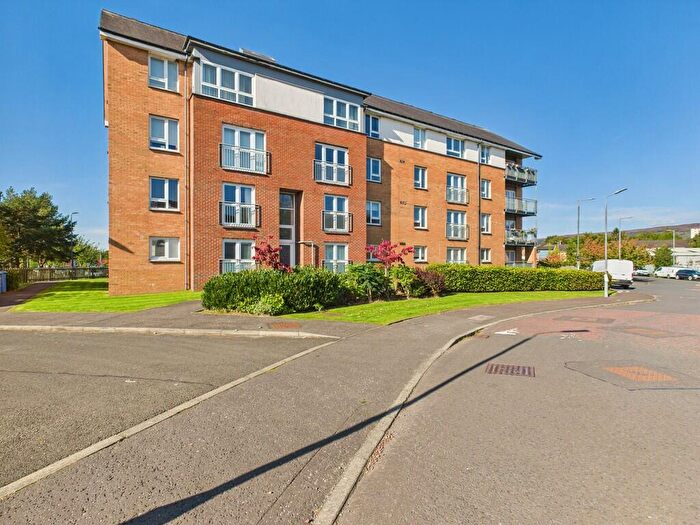
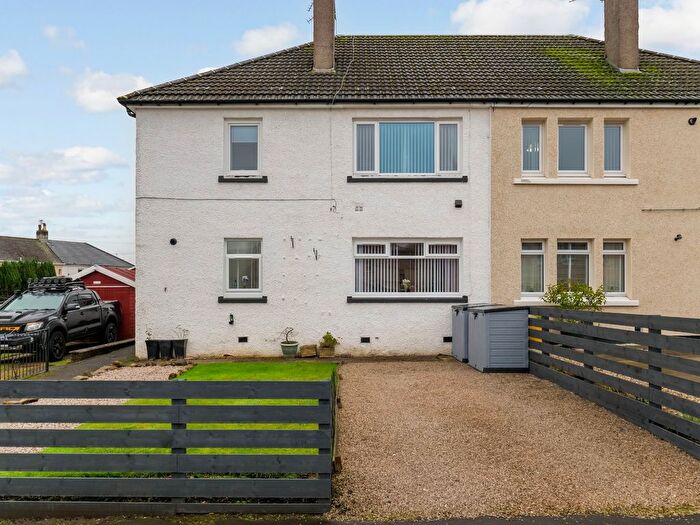
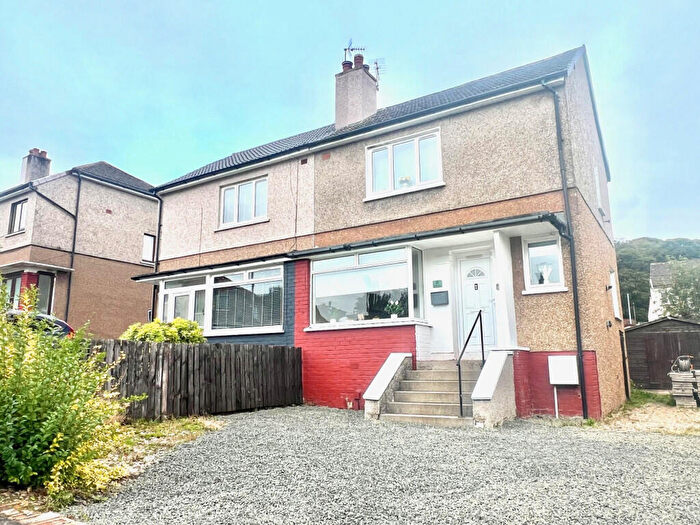
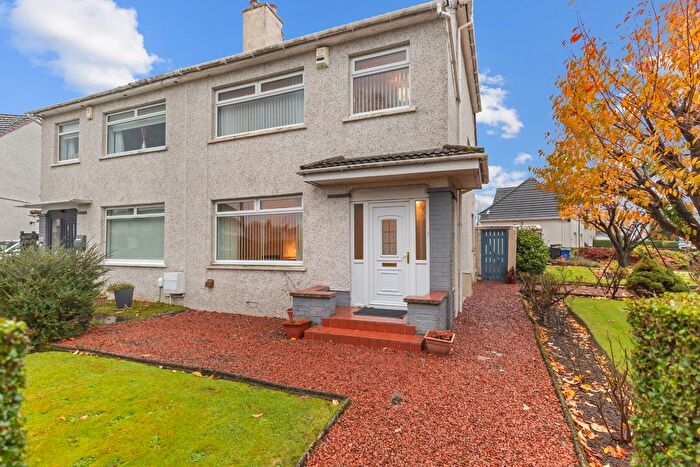
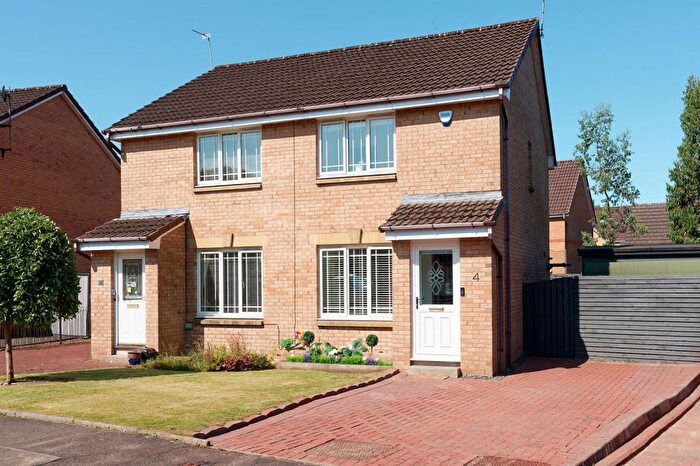
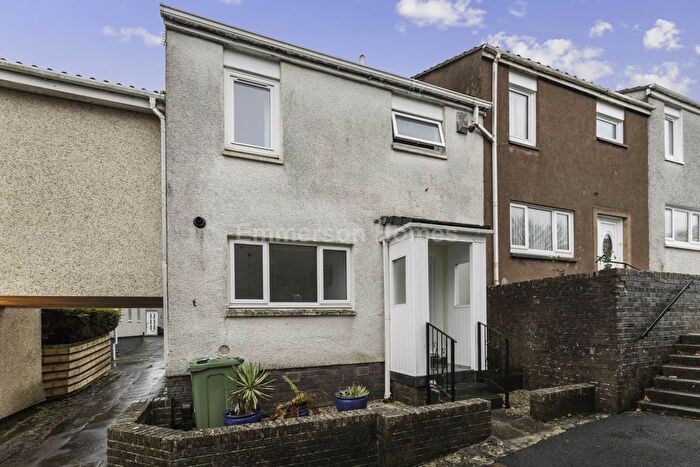
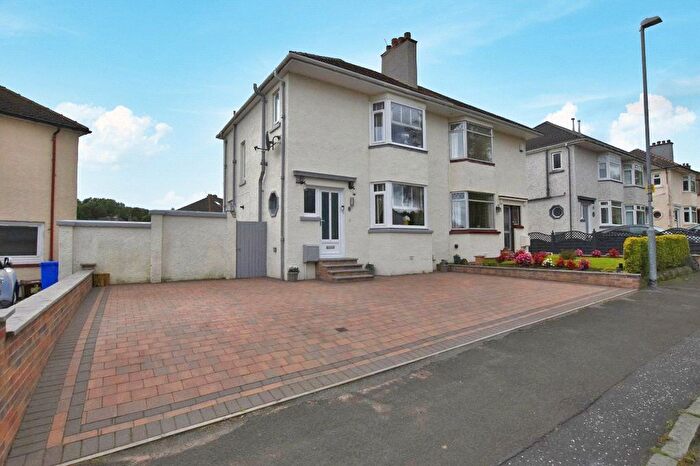
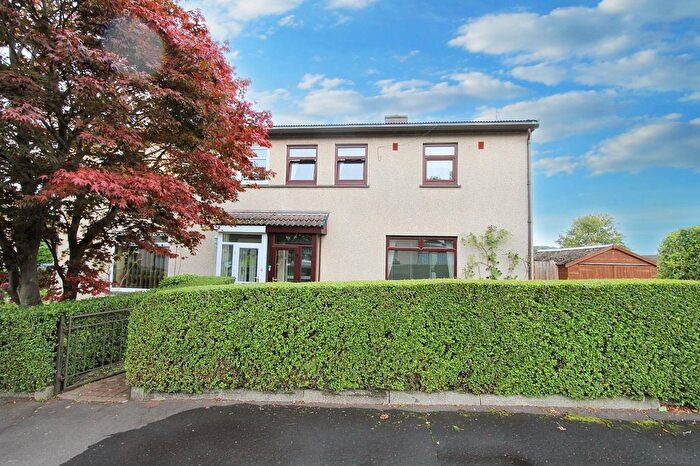
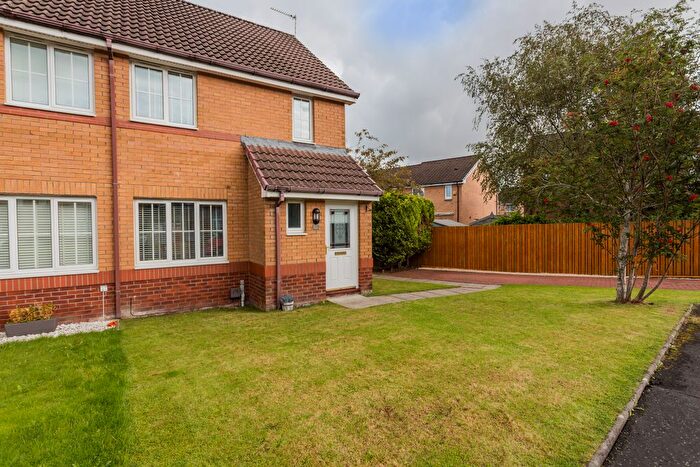
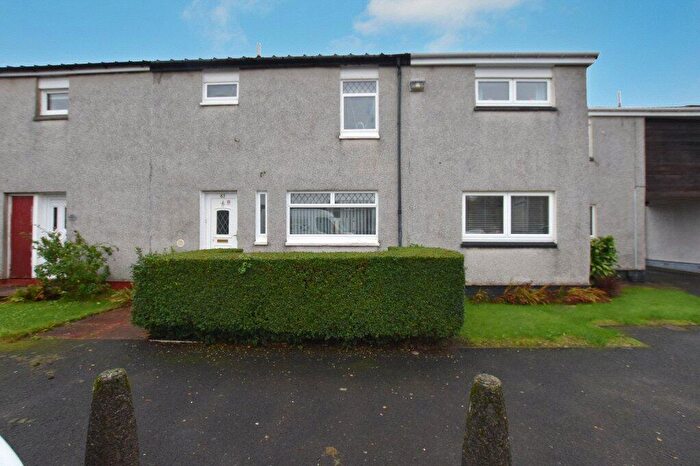
Houses for sale & to rent in Erskine and Inchinnan, Renfrew
House Prices in Erskine and Inchinnan
Properties in Erskine and Inchinnan have an average house price of £170,629.00 and had 33 Property Transactions within the last 3 years¹.
Erskine and Inchinnan is an area in Renfrew, Renfrewshire with 817 households², where the most expensive property was sold for £286,333.00.
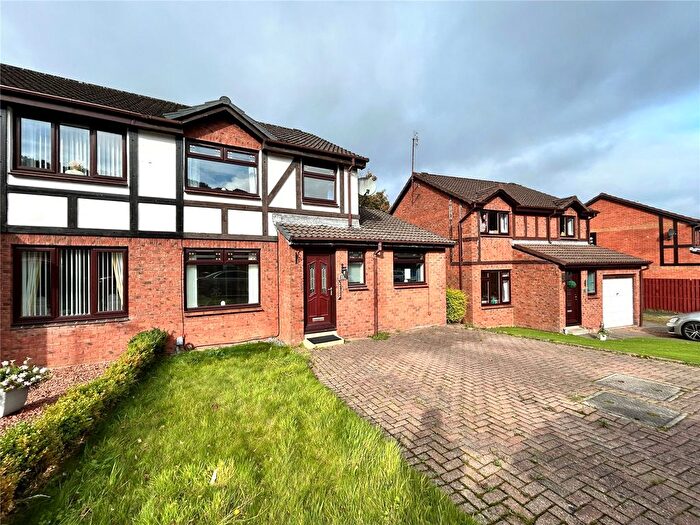
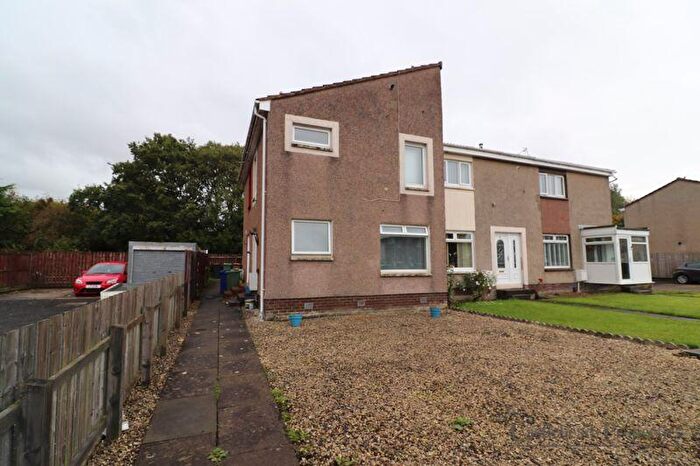
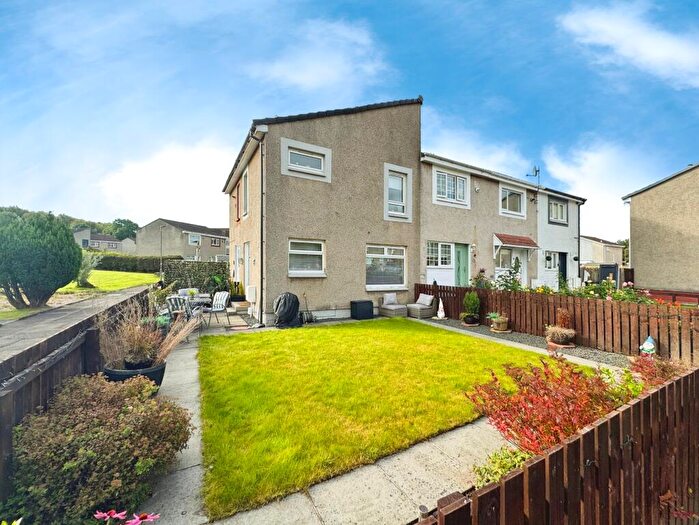
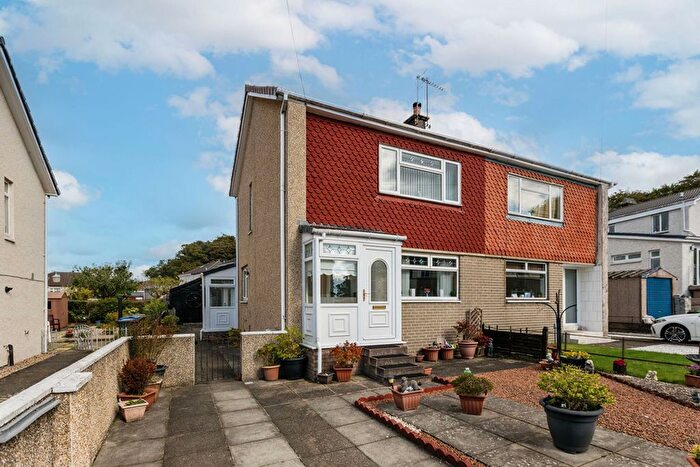
Properties for sale in Erskine and Inchinnan
Previously listed properties in Erskine and Inchinnan
Roads and Postcodes in Erskine and Inchinnan
Navigate through our locations to find the location of your next house in Erskine and Inchinnan, Renfrew for sale or to rent.
| Streets | Postcodes |
|---|---|
| Allands Avenue | PA4 9LG |
| Ballater Drive | PA4 9QD |
| Balmoral Crescent | PA4 9PU |
| Banchory Avenue | PA4 9PR PA4 9PT PA4 9PX PA4 9PY PA4 9PZ PA4 9QE PA4 9QG |
| Barnsford Road | PA4 9LZ |
| Birkhall Avenue | PA4 9QA |
| Bourne Court | PA4 9PN |
| Bourne Crescent | PA4 9PP |
| Braemar Road | PA4 9PS PA4 9QB |
| Broomlea Crescent | PA4 9PJ |
| Broompark Drive | PA4 9QF |
| Brownsfield Avenue | PA4 9RG PA4 9RZ |
| Cartside Avenue | PA4 9RP PA4 9RU PA4 9RW PA4 9RX |
| Fountain Avenue | PA4 9RQ |
| Fountain Crescent | PA4 9RE |
| Fountain Drive | PA4 9RF |
| Freeland Drive | PA4 9QP |
| Greenhead Road | PA4 9QW PA4 9QY |
| Greenock Road | PA4 9LB PA4 9LD PA4 9LH PA4 9NA PA4 9NH PA4 9PB PA4 9PD PA4 9PG |
| Houston Road | PA4 9LS PA4 9LU PA4 9LX |
| Inchinnan Drive | PA4 9AF PA4 9LJ |
| Inchinnan Road | PA4 9EE |
| India Drive | PA4 9LE PA4 9LF |
| Ladyacres | PA4 9NJ |
| Ladyacres Way | PA4 9NQ |
| Luckinsford Avenue | PA4 9QZ PA4 9RA PA4 9RB |
| Luckinsford Drive | PA4 9RD |
| Luckinsford Road | PA4 9QL PA4 9QN |
| Newmains Avenue | PA4 9RR |
| Niamh Court | PA4 9QT |
| Old Greenock Road | PA4 9ND PA4 9PE PA4 9PH PA4 9QH |
| Park Crescent | PA4 9PW |
| Park Road | PA4 9QJ |
| River Drive | PA4 9RT |
| South Street | PA4 9RJ PA4 9RL |
| Southbar Road | PA4 9NG |
Transport near Erskine and Inchinnan
-
Clydebank Station
-
Dalmuir Station
-
Singer Station
-
Yoker Station
-
Paisley St.James Station
-
Drumry Station
-
Bishopton Station
-
Kilpatrick Station
-
Paisley Gilmour Street Station
-
Garscadden Station
- FAQ
- Price Paid By Year
Frequently asked questions about Erskine and Inchinnan
What is the average price for a property for sale in Erskine and Inchinnan?
The average price for a property for sale in Erskine and Inchinnan is £170,629. This amount is 18% higher than the average price in Renfrew. There are 1,180 property listings for sale in Erskine and Inchinnan.
Which train stations are available in or near Erskine and Inchinnan?
Some of the train stations available in or near Erskine and Inchinnan are Clydebank, Dalmuir and Singer.
Property Price Paid in Erskine and Inchinnan by Year
The average sold property price by year was:
| Year | Average Sold Price | Price Change |
Sold Properties
|
|---|---|---|---|
| 2023 | £201,779 | 22% |
10 Properties |
| 2022 | £157,086 | -9% |
23 Properties |
| 2021 | £170,635 | 1% |
27 Properties |
| 2020 | £169,503 | 8% |
16 Properties |
| 2019 | £156,738 | 8% |
32 Properties |
| 2018 | £144,219 | -0,5% |
35 Properties |
| 2017 | £144,875 | 12% |
24 Properties |
| 2016 | £127,907 | -14% |
26 Properties |
| 2015 | £146,236 | 16% |
22 Properties |
| 2014 | £122,541 | -9% |
31 Properties |
| 2013 | £134,038 | 11% |
27 Properties |
| 2012 | £119,778 | -20% |
22 Properties |
| 2011 | £143,957 | -152% |
12 Properties |
| 2010 | £362,780 | -8% |
27 Properties |
| 2009 | £390,540 | 60% |
23 Properties |
| 2008 | £156,441 | 7% |
17 Properties |
| 2007 | £145,000 | -11% |
25 Properties |
| 2006 | £160,307 | 47% |
25 Properties |
| 2005 | £85,006 | -30% |
38 Properties |
| 2004 | £110,138 | -24% |
21 Properties |
| 2003 | £136,320 | -6% |
31 Properties |
| 2002 | £144,825 | 87% |
39 Properties |
| 2001 | £18,885 | - |
1 Property |

