
Houses for sale in Renfrew, Renfrewshire
House Prices in Renfrew
Properties in Renfrew have an average house price of £168k and had 647 Property Transactions within the last 3 years.¹
Renfrew is an area in Renfrewshire with 10,962 households², where the most expensive property was sold for £540k.
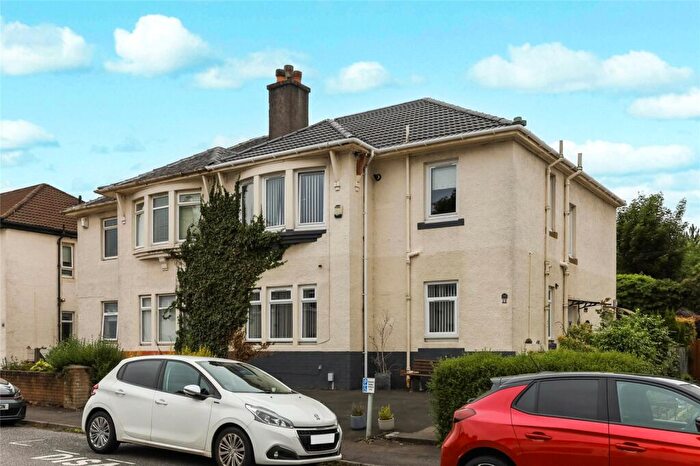
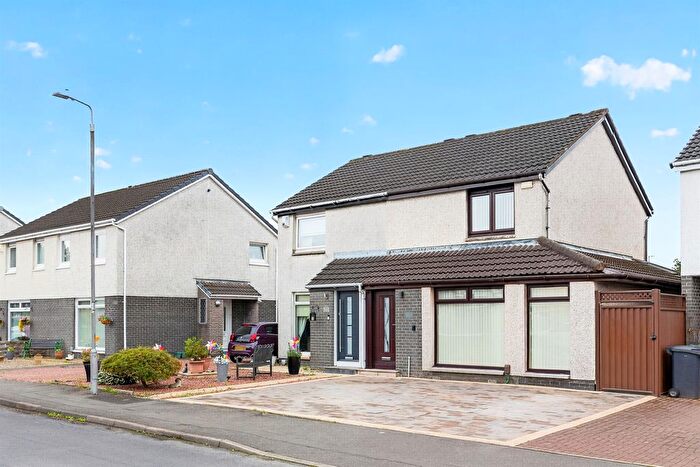
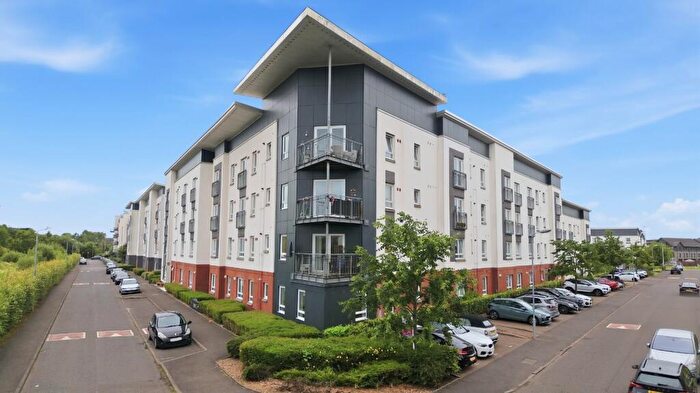
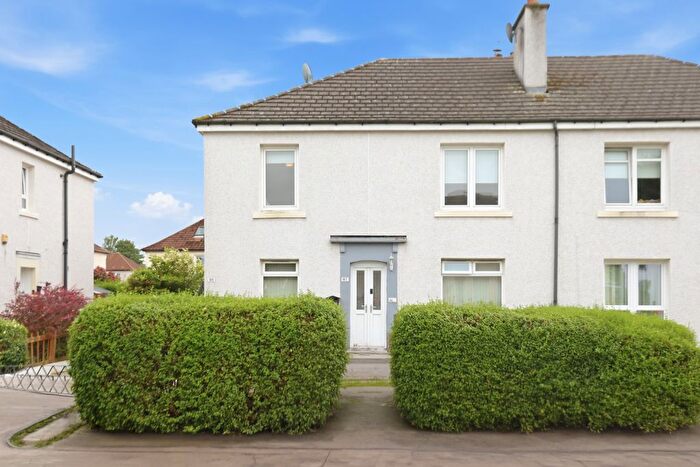
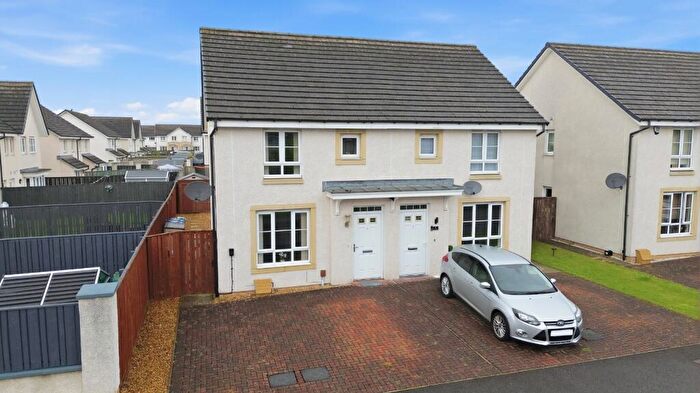
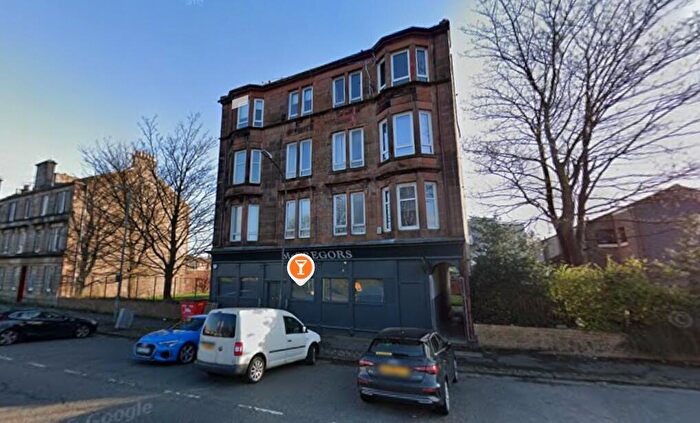
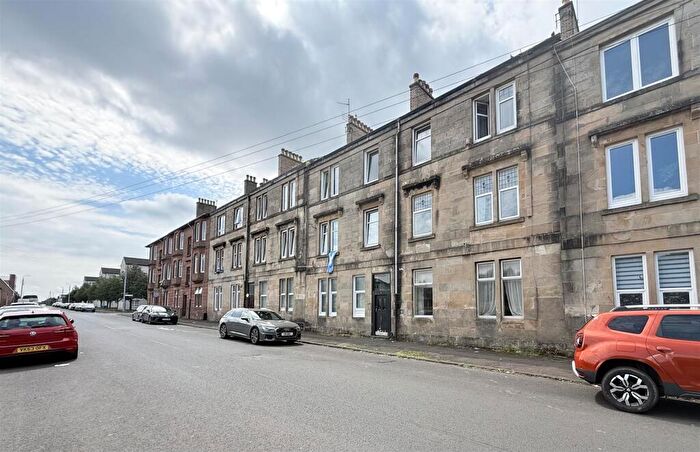
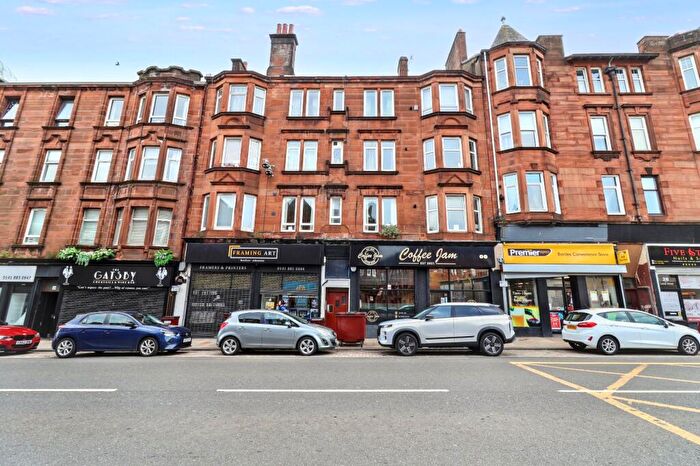
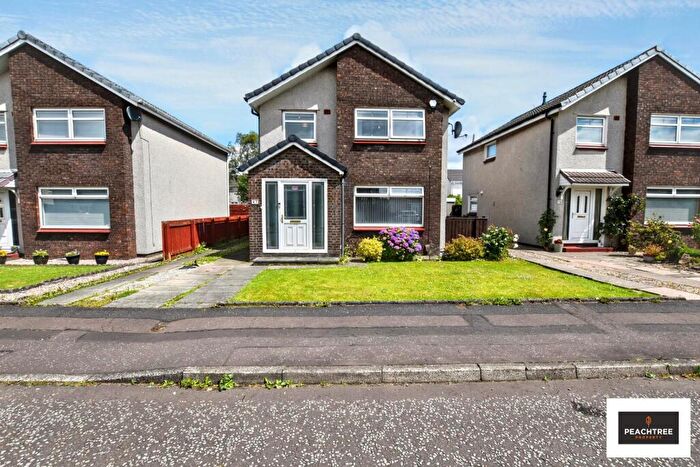
Properties for sale in Renfrew
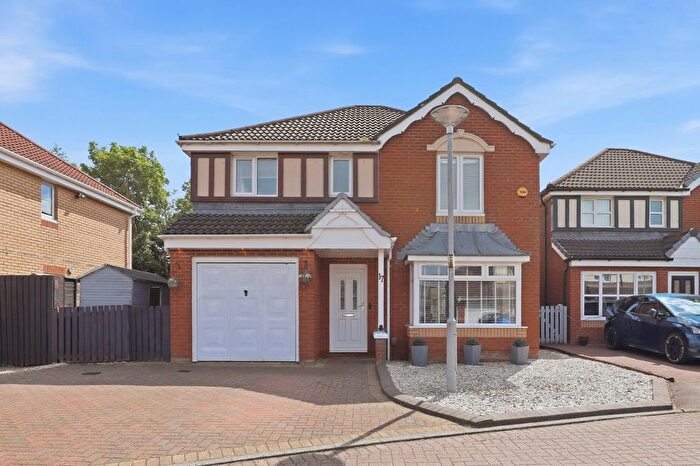


![]()
If you are looking to sell your house, let it out, or receive a property valuation, an expert can help you.
Click the button below to get started.
Neighbourhoods in Renfrew
Navigate through our locations to find the location of your next house in Renfrew, Renfrewshire for sale or to rent.
Property price trends in Renfrew
According to the latest Registers of Scotland data, the average home in Renfrew sold for £188,104 in 2025. That figure comes from a substantial record of 12,962 sales logged over the past 24 years.
Prices have continued to climb over the last three years. Compared with 2022, when the typical sale came in around £143,174, that's a rise of roughly 31.4%.
Looking back five years, average prices are up about 48.9% since 2020, a gain of around £61,805 in cash terms.
Zoom out to the past decade for the fuller picture. Back in 2015, homes here averaged £129,018, so the typical sold price has climbed about 45.8% since then, roughly 3.8% a year. Stretch the view to fifteen years and that annual pace eases back to about 2.7%.
Frequently asked questions about Renfrew
What is the average price for a property for sale in Renfrew?
The average price for a property for sale in Renfrew is £167,698. This amount is 5% lower than the average price in Renfrewshire. There are 7,095 property listings for sale in Renfrew.
What locations have the most expensive properties for sale in Renfrew?
The locations with the most expensive properties for sale in Renfrew are Erskine and Inchinnan at an average of £195,911 and Renfrew North and Braehead at an average of £173,647.
What locations have the most affordable properties for sale in Renfrew?
The location with the most affordable properties for sale in Renfrew is Renfrew South and Gallowhill at an average of £140,626.
Which train stations are available in or near Renfrew?
Some of the train stations available in or near Renfrew are Yoker, Garscadden and Hillington West.
Property Price Paid in Renfrew by Year
The average sold property price by year was:
| Year | Average Sold Price | Price Change |
Sold Properties
|
|---|---|---|---|
| 2025 | £188,104 | 8% |
174 Properties |
| 2024 | £172,374 | 12% |
193 Properties |
| 2023 | £151,794 | 6% |
280 Properties |
| 2022 | £143,174 | 9% |
545 Properties |
| 2021 | £130,655 | 3% |
674 Properties |
| 2020 | £126,299 | -7% |
501 Properties |
| 2019 | £135,682 | -2% |
663 Properties |
| 2018 | £138,200 | -3% |
738 Properties |
| 2017 | £143,001 | 4% |
696 Properties |
| 2016 | £137,480 | 6% |
767 Properties |
Transport in Renfrew
Please see below transportation links in this area:
