
Houses for sale in Renfrewshire, Scotland
House Prices in Renfrewshire
Properties in Renfrewshire have
an average house price of
£177k
and had 4,652 Property Transactions
within the last 3 years.¹
Renfrewshire is a location in
Scotland with
80,662 households², where the most expensive property was sold for £1.15M.
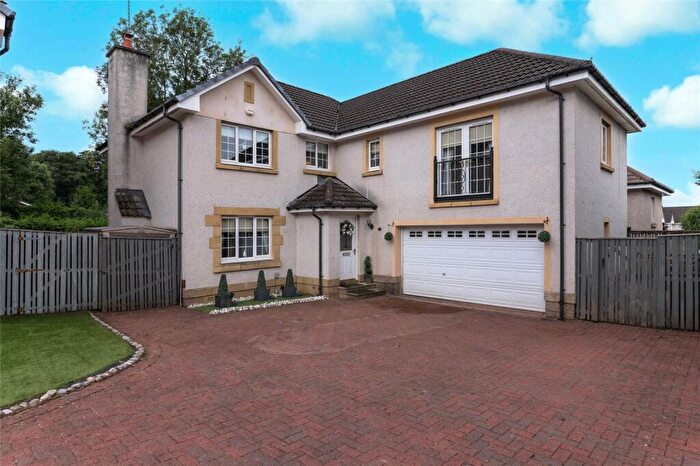
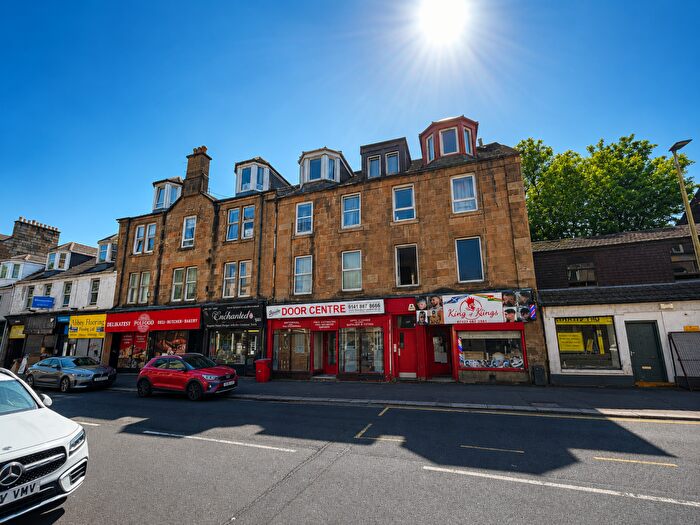
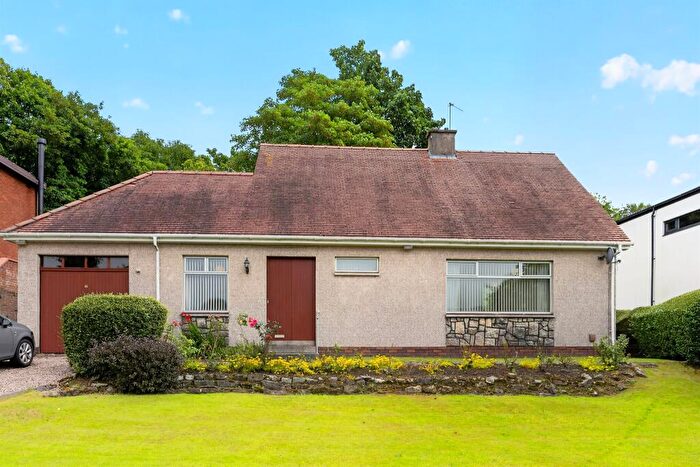
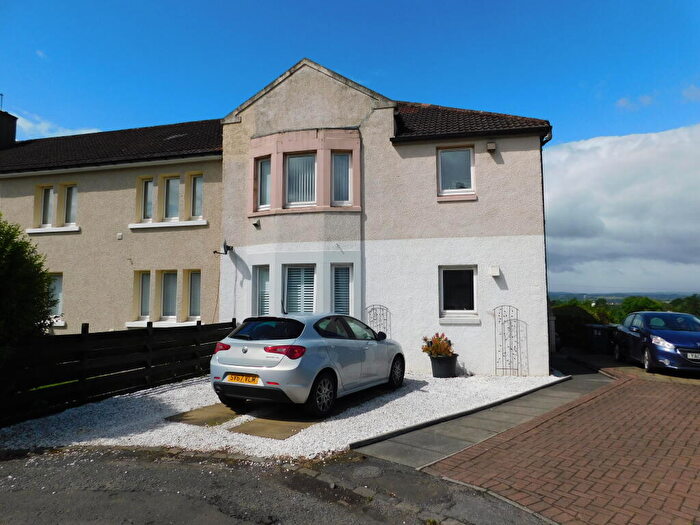
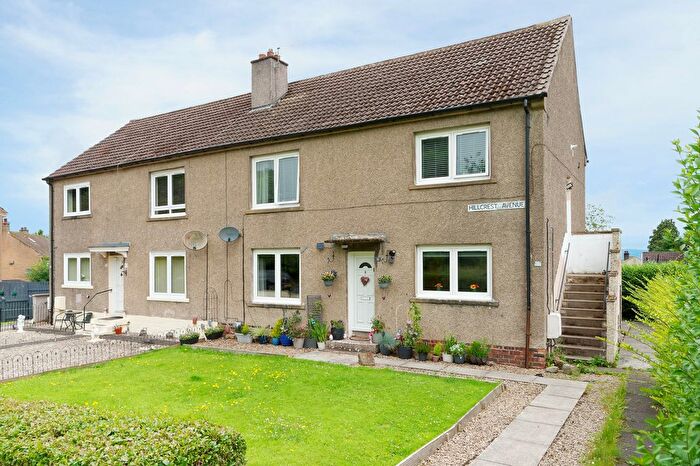
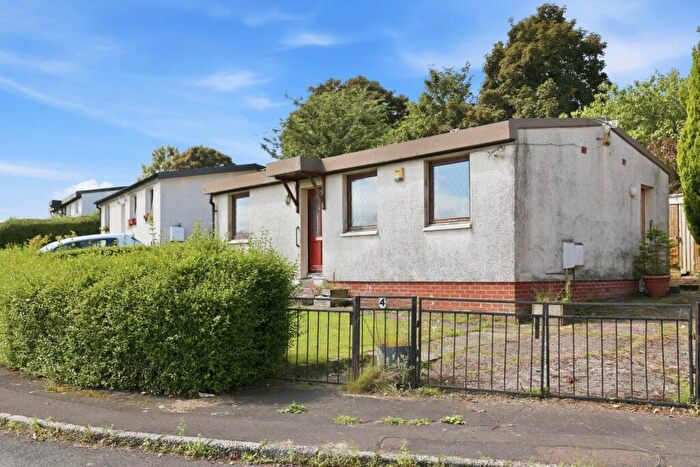
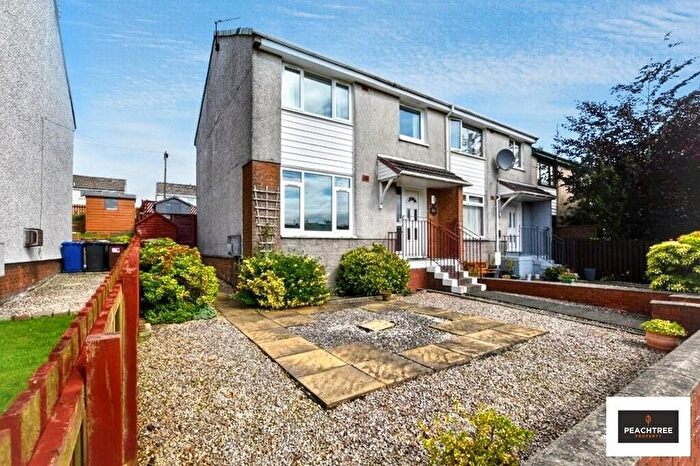
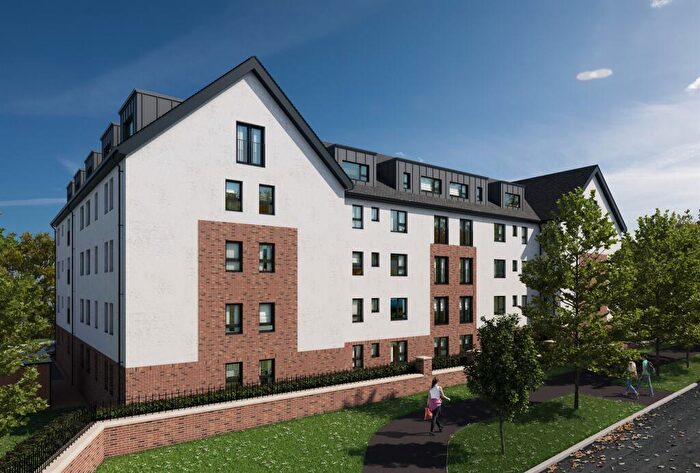
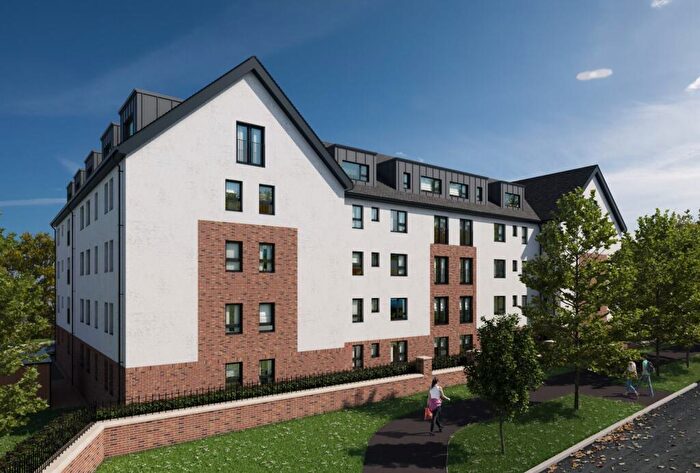
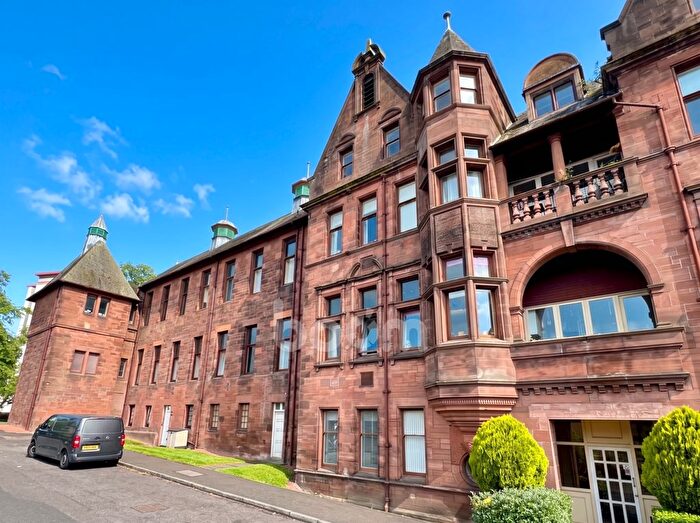
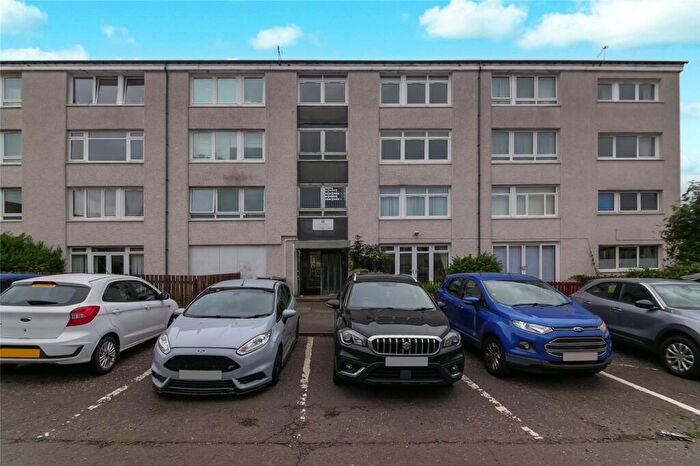
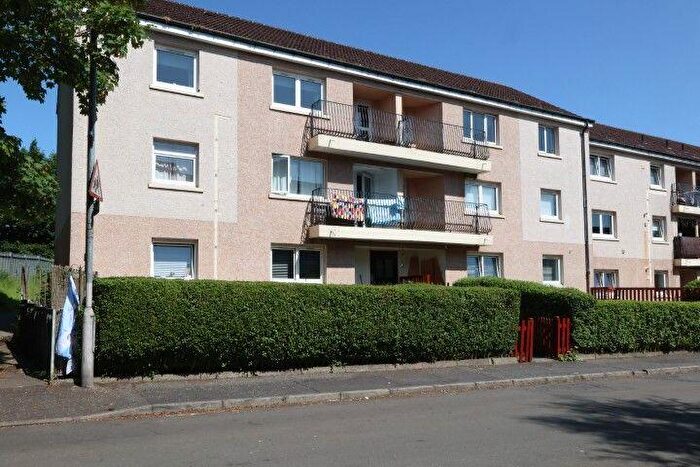
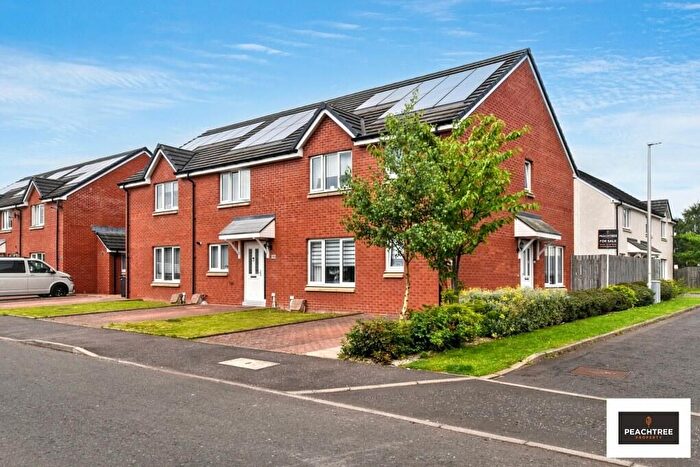
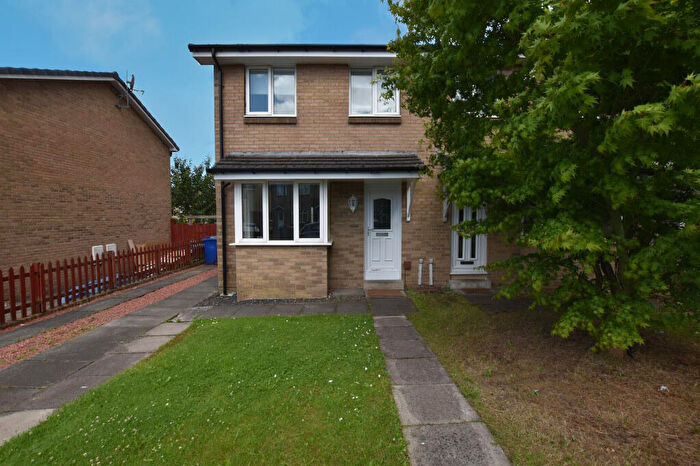
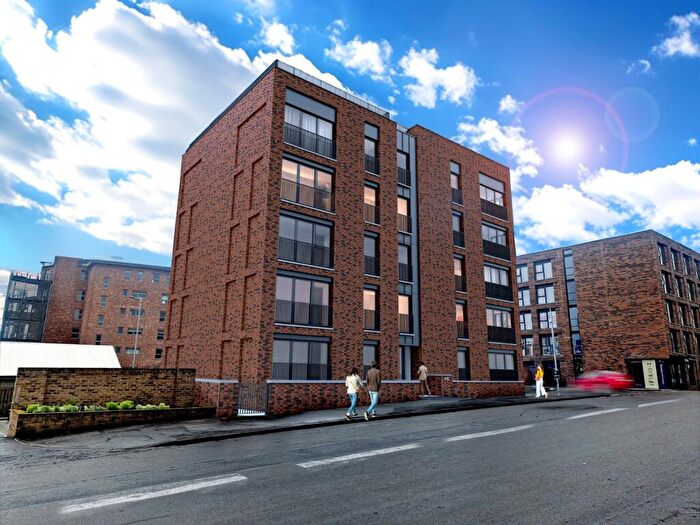
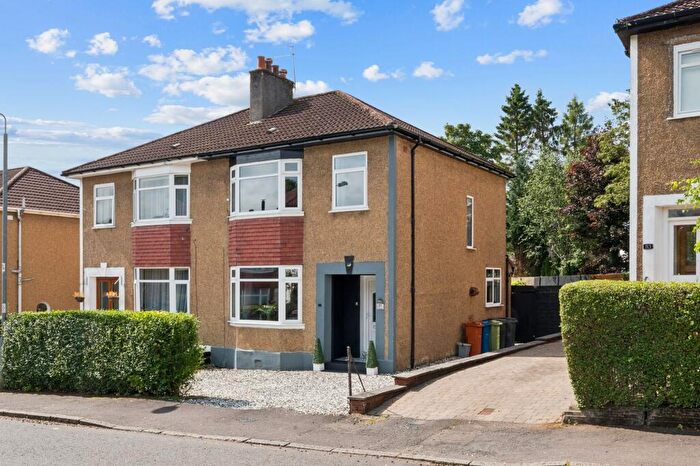
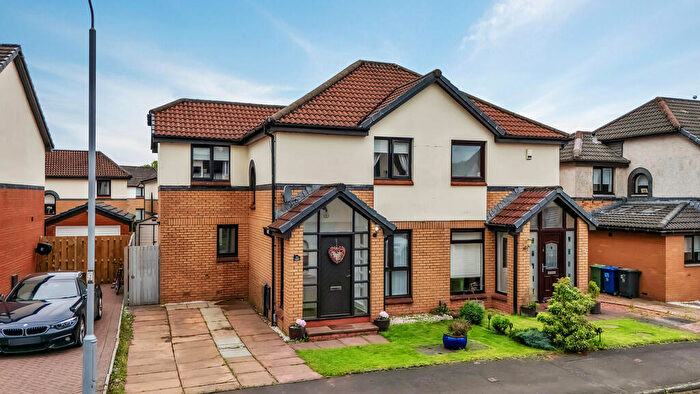
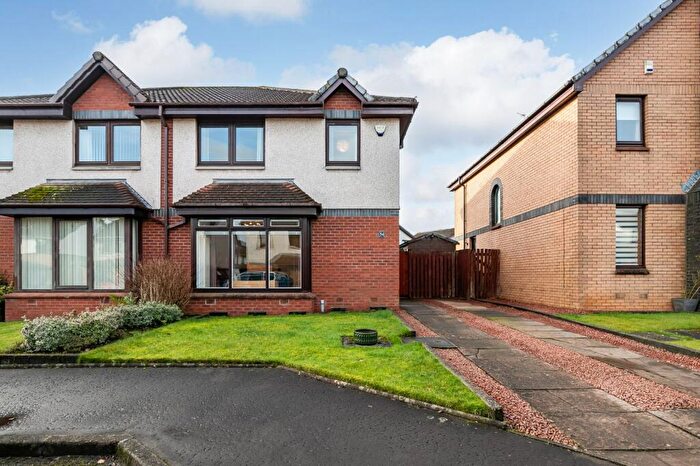
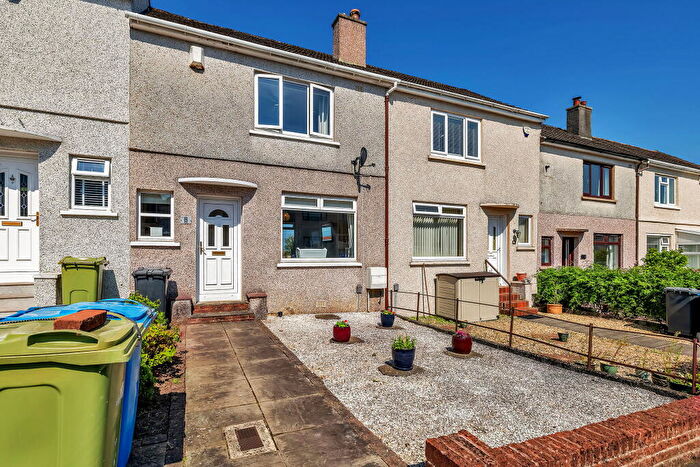
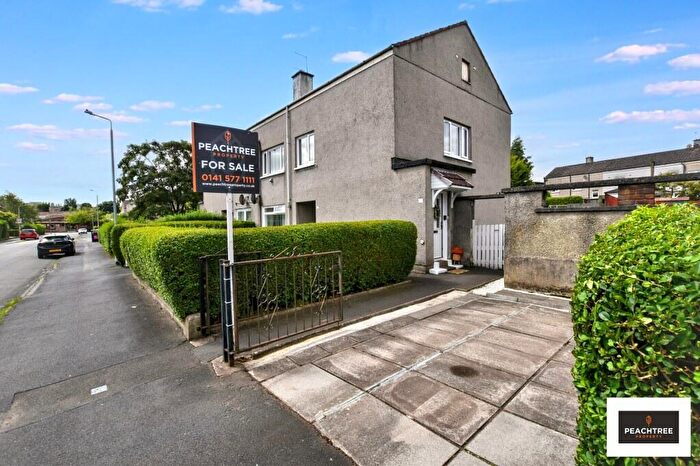
Properties for sale in Renfrewshire
![]()
If you are looking to sell your house, let it out, or receive a property valuation, an expert can help you.
Click the button below to get started.


Towns in Renfrewshire
Navigate through our locations to find the location of your next house in Renfrewshire, Scotland for sale or to rent.
Property price trends in Renfrewshire
According to the latest Registers of Scotland data, the average home in Renfrewshire sold for £183,132 in 2026. That figure comes from a substantial record of 80,987 sales logged over the past 30 years.
Prices have continued to climb over the last three years. Compared with 2023, when the typical sale came in around £162,614, that's a rise of roughly 12.6%.
Looking back five years, average prices are up about 20.9% since 2021, a gain of around £31,659 in cash terms.
Zoom out to the past decade for the fuller picture. Back in 2016, homes here averaged £137,008, so the typical sold price has climbed about 33.7% since then, roughly 2.9% a year. Stretch the view to fifteen years and that annual pace holds at about 2.9%.
Frequently asked questions about Renfrewshire
What is the average price for a property for sale in Renfrewshire?
The average price for a property for sale in Renfrewshire is £176,735. This amount is 12% lower than the average price in Scotland. There are more than 10,000 property listings for sale in Renfrewshire.
What locations have the most expensive properties for sale in Renfrewshire?
The locations with the most expensive properties for sale in Renfrewshire are Port Glasgow at an average of £356,076, Bridge Of Weir at an average of £281,243 and Bishopton at an average of £280,632.
What locations have the most affordable properties for sale in Renfrewshire?
The locations with the most affordable properties for sale in Renfrewshire are Paisley at an average of £152,527, Renfrew at an average of £167,698 and Erskine at an average of £173,468.
Which train stations are available in or near Renfrewshire?
Some of the train stations available in or near Renfrewshire are Paisley St.James, Paisley Gilmour Street and Paisley Canal.
Property Price Paid in Renfrewshire by Year
The average sold property price by year was:
| Year | Average Sold Price | Price Change |
Sold Properties
|
|---|---|---|---|
| 2026 | £183,132 | -3% |
294 Properties |
| 2025 | £188,211 | 4% |
1,322 Properties |
| 2024 | £181,364 | 10% |
1,377 Properties |
| 2023 | £162,614 | 0,3% |
1,659 Properties |
| 2022 | £162,106 | 7% |
3,529 Properties |
| 2021 | £151,473 | -2% |
4,154 Properties |
| 2020 | £154,541 | 4% |
3,254 Properties |
| 2019 | £148,840 | 2% |
3,872 Properties |
| 2018 | £146,501 | 4% |
3,902 Properties |
| 2017 | £140,168 | 2% |
3,846 Properties |
Transport in Renfrewshire
Please see below transportation links in this area:
