
Houses for sale & to rent in Mid Berwickshire, Berwick-upon-tweed
House Prices in Mid Berwickshire
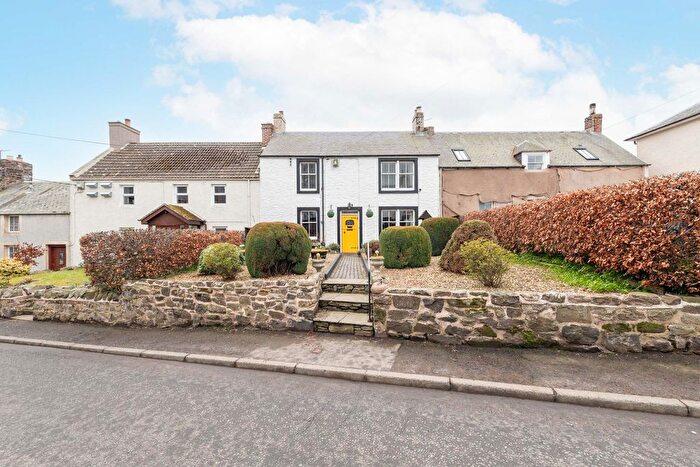
Properties in Mid Berwickshire have an average house price of £205k and had 172 Property Transactions within the last 3 years¹.
Mid Berwickshire is an area in Berwick-upon-tweed, Scottish Borders with 4,709 households², where the most expensive property was sold for £600k.
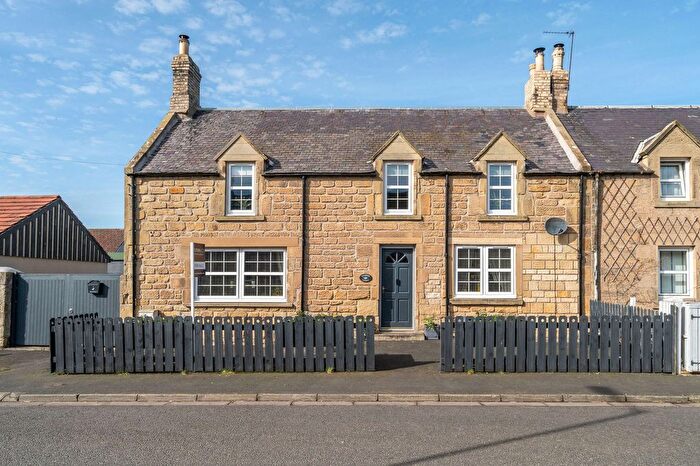
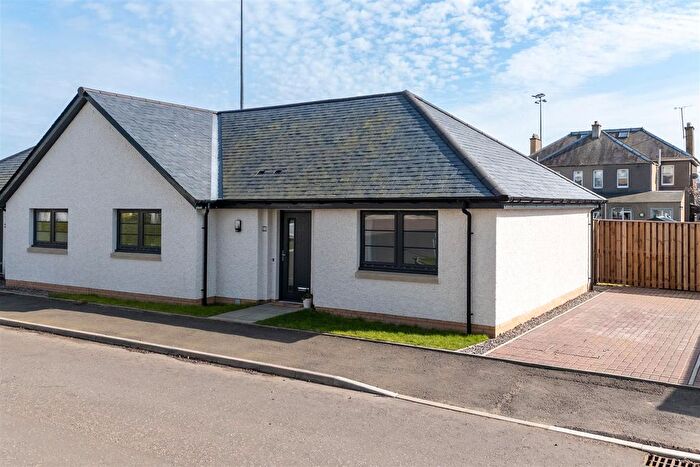
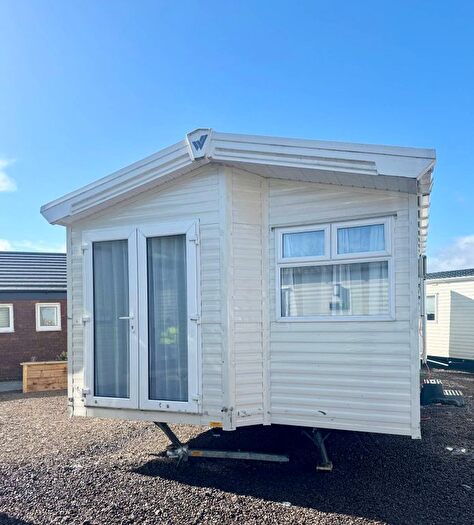
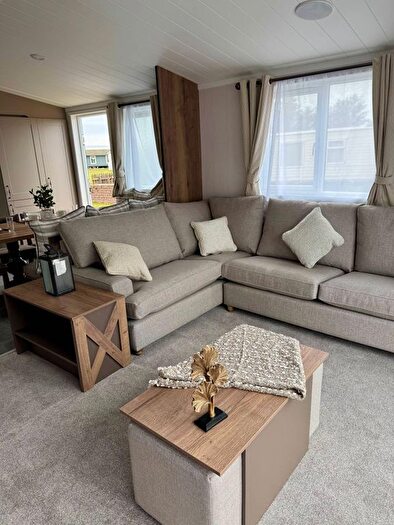
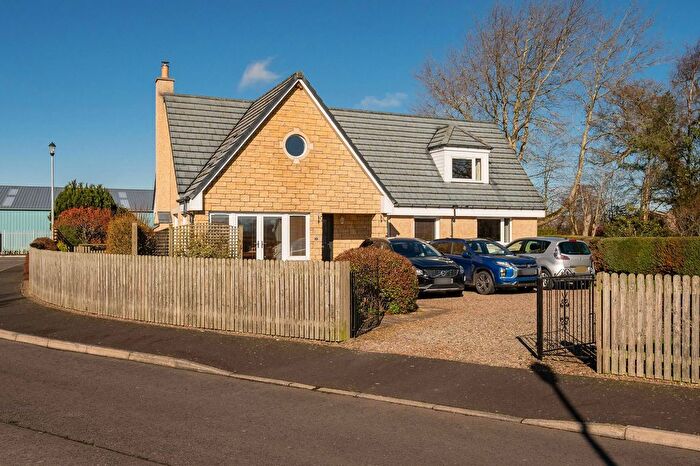
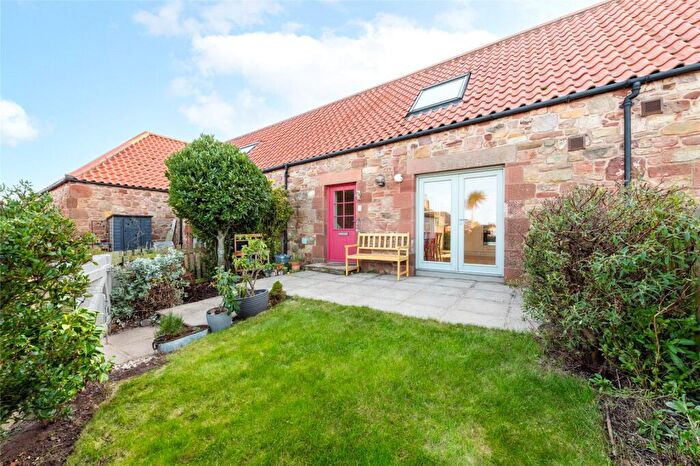
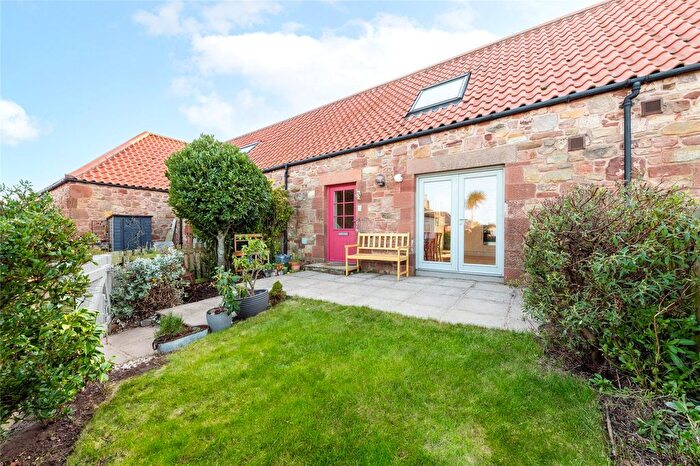
Properties for sale in Mid Berwickshire
![]()
If you are looking to sell your house, let it out, or receive a property valuation, an expert can help you.
Click the button below to get started.
Roads and Postcodes in Mid Berwickshire
Navigate through our locations to find the location of your next house in Mid Berwickshire, Berwick-upon-tweed for sale or to rent.
Transport near Mid Berwickshire

- FAQ
- Price Paid By Year
Frequently asked questions about Mid Berwickshire
What is the average price for a property for sale in Mid Berwickshire?
The average price for a property for sale in Mid Berwickshire is £205,426. This amount is 4% lower than the average price in Berwick-upon-tweed. There are 1,317 property listings for sale in Mid Berwickshire.
What streets have the most expensive properties for sale in Mid Berwickshire?
The streets with the most expensive properties for sale in Mid Berwickshire are Station Road at an average of £551,500, Wellrig Park at an average of £465,000 and The Avenue at an average of £381,666.
What streets have the most affordable properties for sale in Mid Berwickshire?
The streets with the most affordable properties for sale in Mid Berwickshire are Market Street at an average of £61,166, The Mount at an average of £71,000 and Church Lane at an average of £79,500.
Which train stations are available in or near Mid Berwickshire?
Some of the train stations available in or near Mid Berwickshire are Berwick-Upon-Tweed, Tweedbank and Galashiels.
Property Price Paid in Mid Berwickshire by Year
The average sold property price by year was:
| Year | Average Sold Price | Price Change |
Sold Properties
|
|---|---|---|---|
| 2025 | £215,895 | 8% |
51 Properties |
| 2024 | £198,868 | -2% |
59 Properties |
| 2023 | £203,056 | -27% |
62 Properties |
| 2022 | £258,686 | 12% |
199 Properties |
| 2021 | £226,693 | 11% |
200 Properties |
| 2020 | £201,650 | 4% |
156 Properties |
| 2019 | £192,780 | -2% |
166 Properties |
| 2018 | £196,820 | 12% |
193 Properties |
| 2017 | £173,795 | -4% |
199 Properties |
| 2016 | £180,870 | - |
188 Properties |
| 2015 | £180,804 | -0,3% |
173 Properties |
| 2014 | £181,334 | 7% |
138 Properties |
| 2013 | £168,243 | -16% |
131 Properties |
| 2012 | £194,768 | 11% |
113 Properties |
| 2011 | £172,796 | 3% |
77 Properties |
| 2010 | £167,748 | -6% |
108 Properties |
| 2009 | £177,639 | 4% |
118 Properties |
| 2008 | £171,203 | -17% |
142 Properties |
| 2007 | £200,072 | 10% |
191 Properties |
| 2006 | £179,890 | 21% |
217 Properties |
| 2005 | £142,707 | -1% |
223 Properties |
| 2004 | £143,720 | 28% |
258 Properties |
| 2003 | £103,682 | 8% |
258 Properties |
| 2002 | £95,551 | 6% |
247 Properties |
| 2001 | £90,241 | - |
15 Properties |