
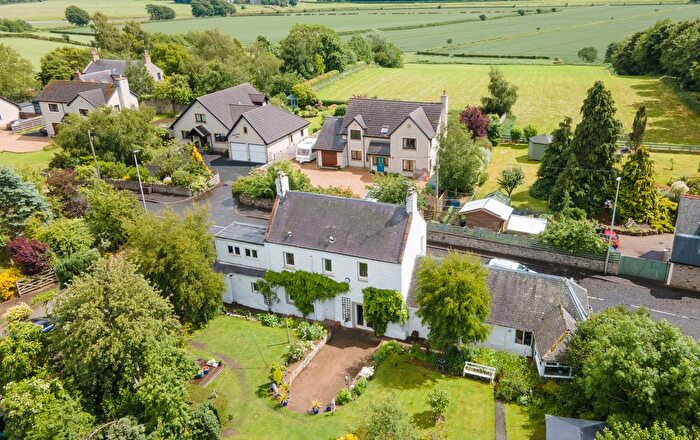
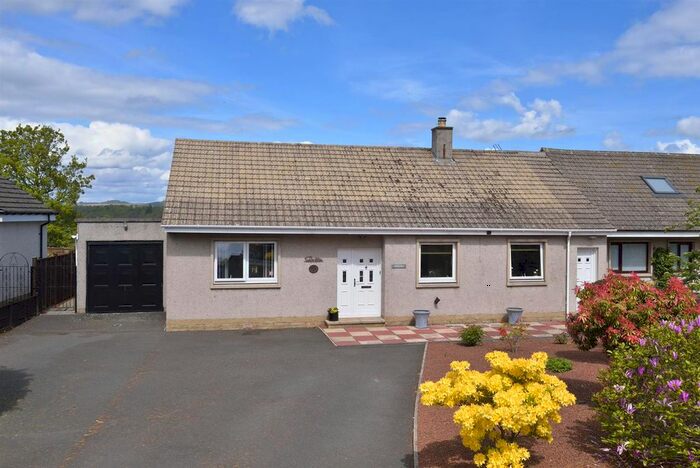
Houses for sale in Berwick-upon-tweed, Scottish Borders
House Prices in Berwick-upon-tweed
Properties in Berwick-upon-tweed have an average house price of £215k and had 356 Property Transactions within the last 3 years.¹
Berwick-upon-tweed is an area in Scottish Borders with 9,522 households², where the most expensive property was sold for £910k.
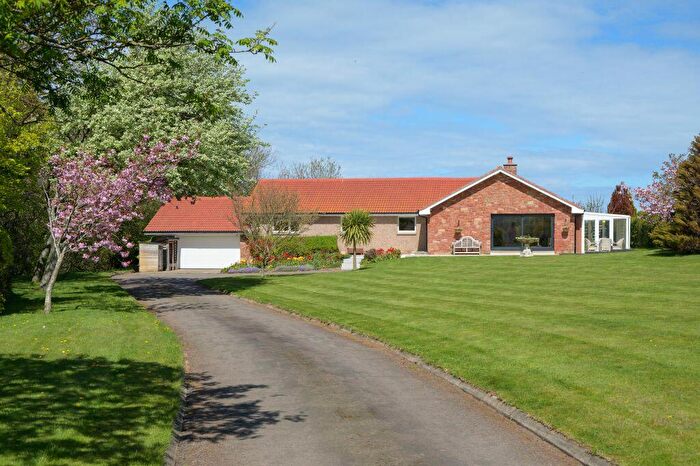
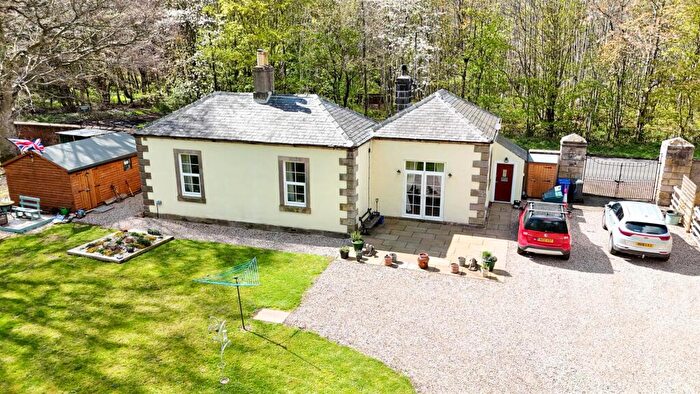
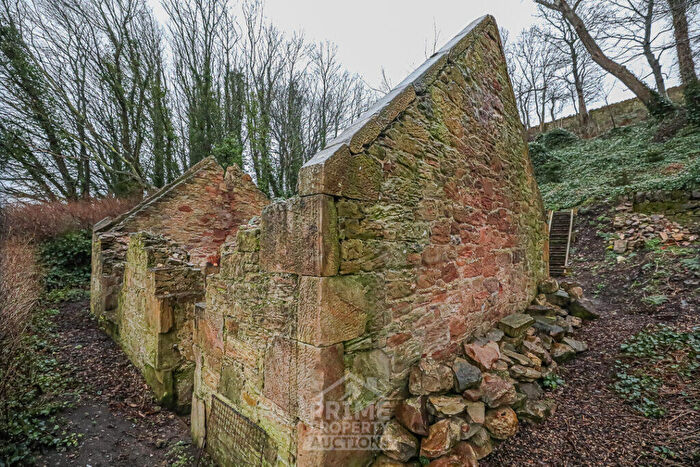
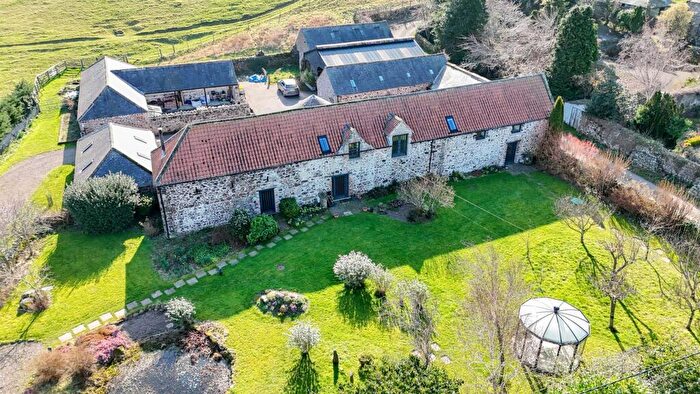
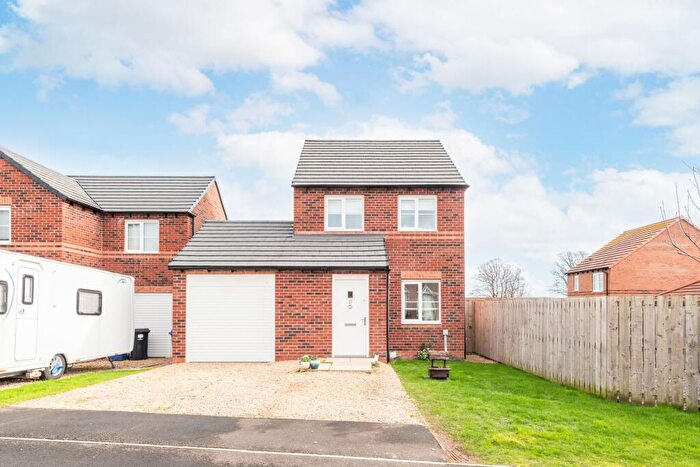
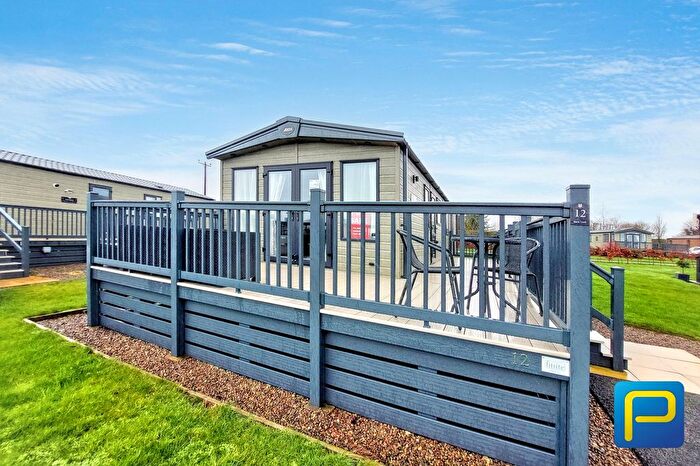
Properties for sale in Berwick-upon-tweed
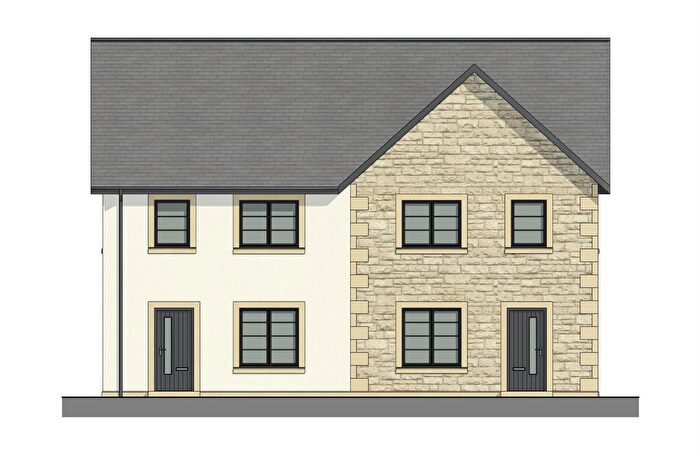
![]()
If you are looking to sell your house, let it out, or receive a property valuation, an expert can help you.
Click the button below to get started.
Previously listed properties in Berwick-upon-tweed
Neighbourhoods in Berwick-upon-tweed
Navigate through our locations to find the location of your next house in Berwick-upon-tweed, Scottish Borders for sale or to rent.
Property price trends in Berwick-upon-tweed
According to the latest Registers of Scotland data, the average home in Berwick-upon-tweed sold for £209,873 in 2025. That figure comes from a substantial record of 8,213 sales logged over the past 28 years.
Prices have fallen back over the last three years. Compared with 2022, when the typical sale came in around £261,265, that's a fall of roughly 19.7%.
Looking back five years, average prices are down about 4.5% since 2020, a drop of around £9,986 in cash terms.
Zoom out to the past decade for the fuller picture. Back in 2015, homes here averaged £181,058, so the typical sold price has climbed about 15.9% since then, roughly 1.5% a year. Stretch the view to fifteen years and that annual pace eases back to about 1.2%.
Frequently asked questions about Berwick-upon-tweed
What is the average price for a property for sale in Berwick-upon-tweed?
The average price for a property for sale in Berwick-upon-tweed is £214,697. This amount is 9% higher than the average price in Scottish Borders. There are 2,118 property listings for sale in Berwick-upon-tweed.
What locations have the most expensive properties for sale in Berwick-upon-tweed?
The location with the most expensive properties for sale in Berwick-upon-tweed is East Berwickshire at an average of £223,363.
What locations have the most affordable properties for sale in Berwick-upon-tweed?
The location with the most affordable properties for sale in Berwick-upon-tweed is Mid Berwickshire at an average of £205,426.
Which train stations are available in or near Berwick-upon-tweed?
Some of the train stations available in or near Berwick-upon-tweed are Berwick-Upon-Tweed, Dunbar and Tweedbank.
Property Price Paid in Berwick-upon-tweed by Year
The average sold property price by year was:
| Year | Average Sold Price | Price Change |
Sold Properties
|
|---|---|---|---|
| 2025 | £209,873 | 0,2% |
102 Properties |
| 2024 | £209,395 | -6% |
115 Properties |
| 2023 | £222,625 | -17% |
139 Properties |
| 2022 | £261,265 | 9% |
365 Properties |
| 2021 | £236,918 | 7% |
437 Properties |
| 2020 | £219,859 | 14% |
315 Properties |
| 2019 | £188,749 | -2% |
347 Properties |
| 2018 | £192,787 | 4% |
396 Properties |
| 2017 | £184,481 | -0,3% |
426 Properties |
| 2016 | £184,987 | 2% |
381 Properties |
Transport in Berwick-upon-tweed
Please see below transportation links in this area:
