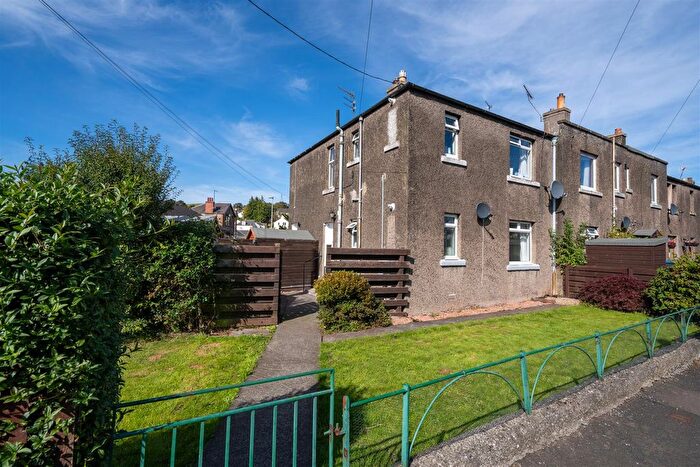
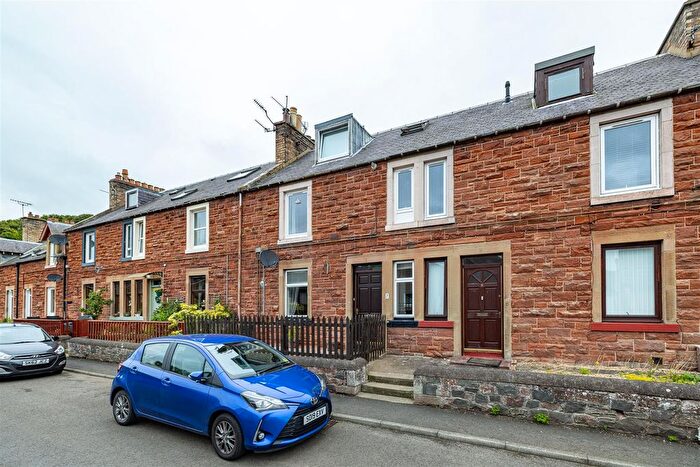
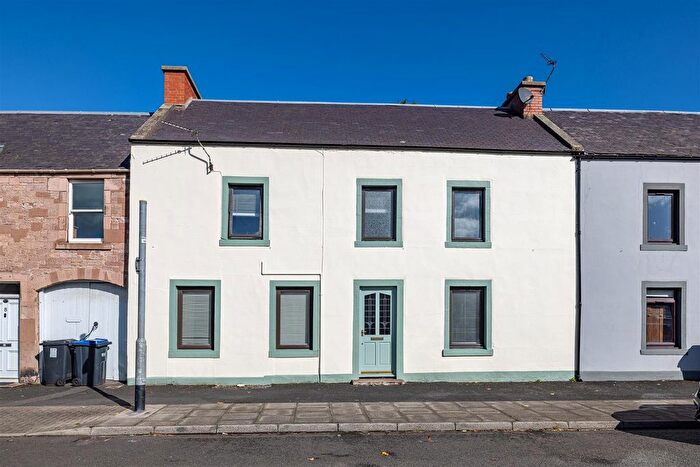
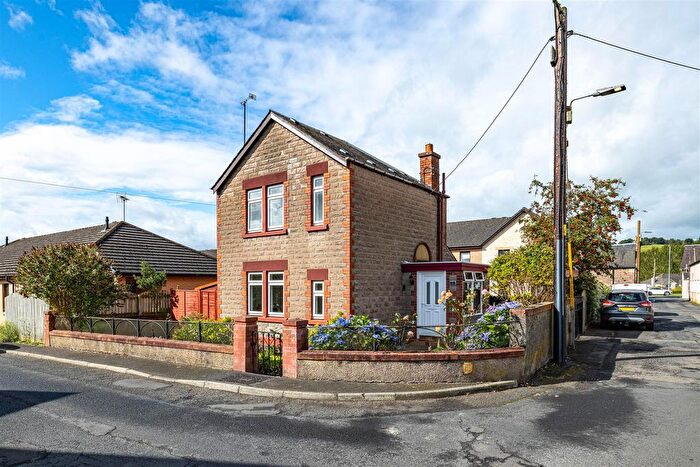
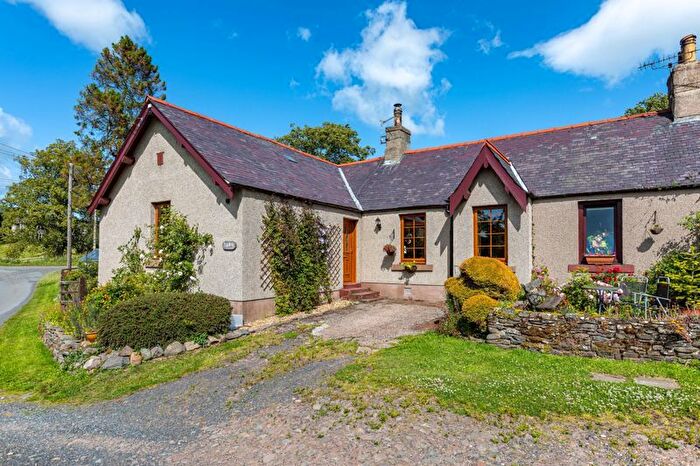
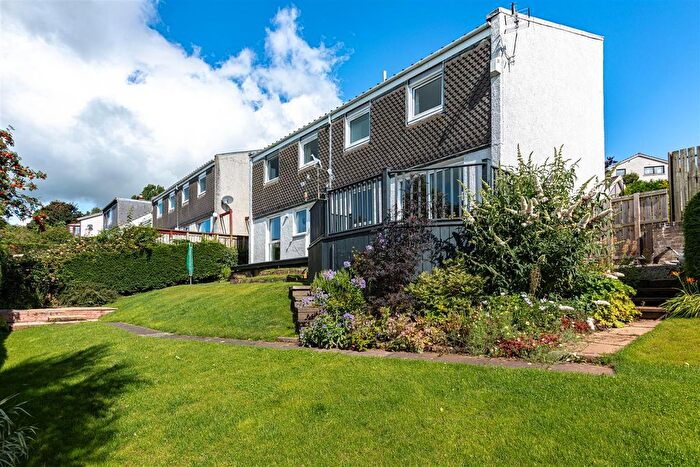
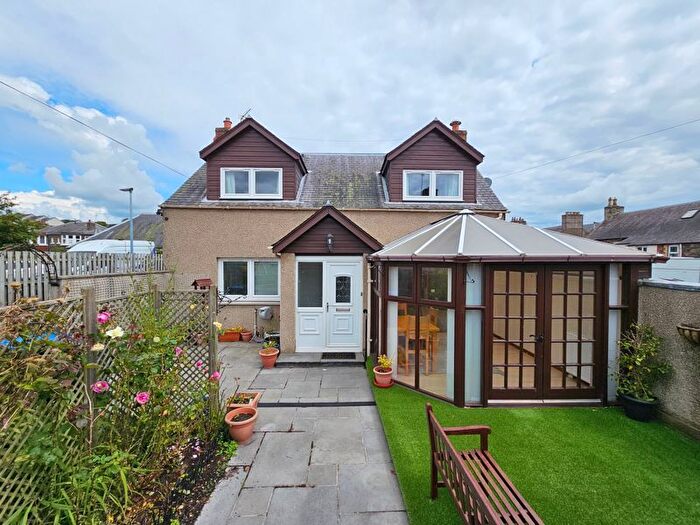
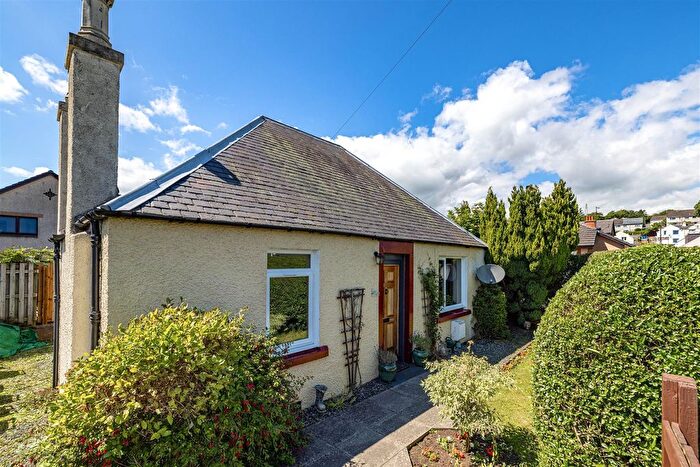
Houses for sale & to rent in Leaderdale and Melrose, Earlston
House Prices in Leaderdale and Melrose
Properties in Leaderdale and Melrose have an average house price of £210,876.00 and had 39 Property Transactions within the last 3 years¹.
Leaderdale and Melrose is an area in Earlston, Scottish Borders with 1,014 households², where the most expensive property was sold for £561,300.00.
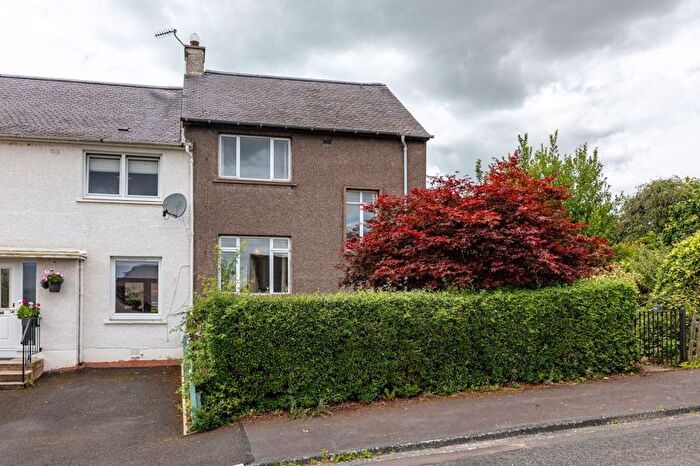
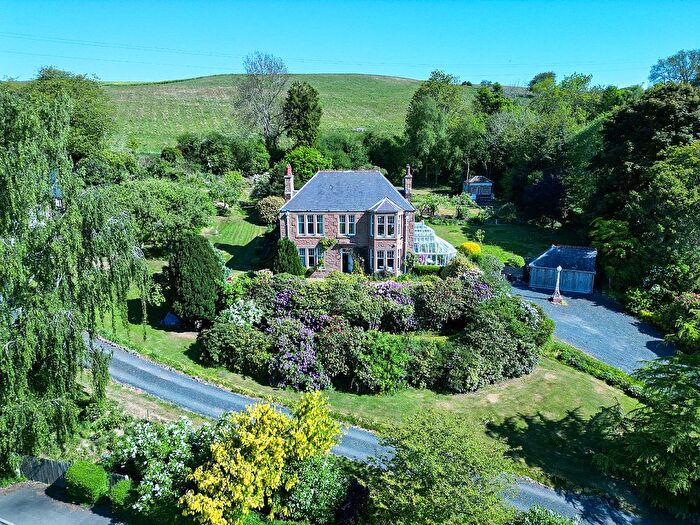
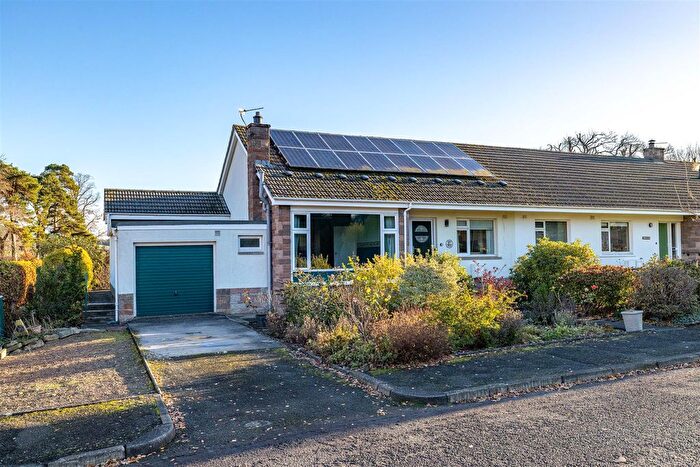
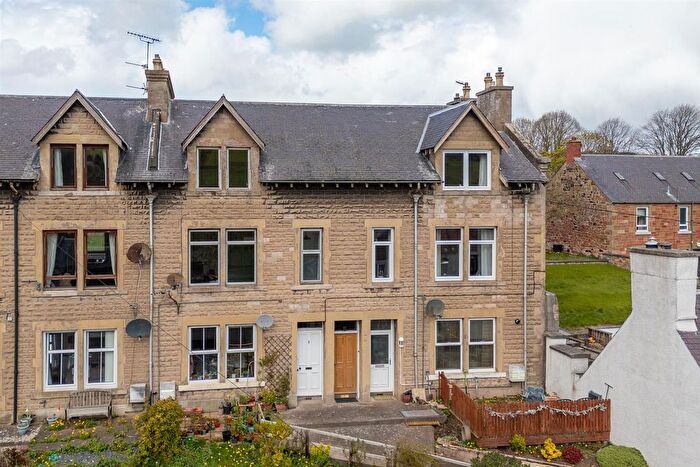
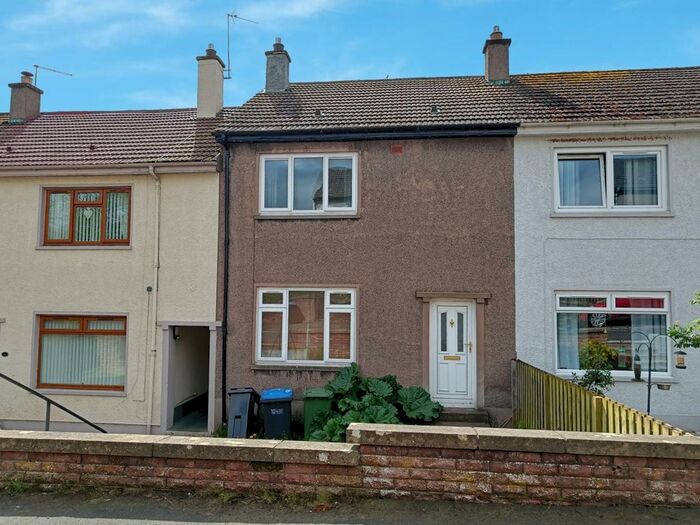
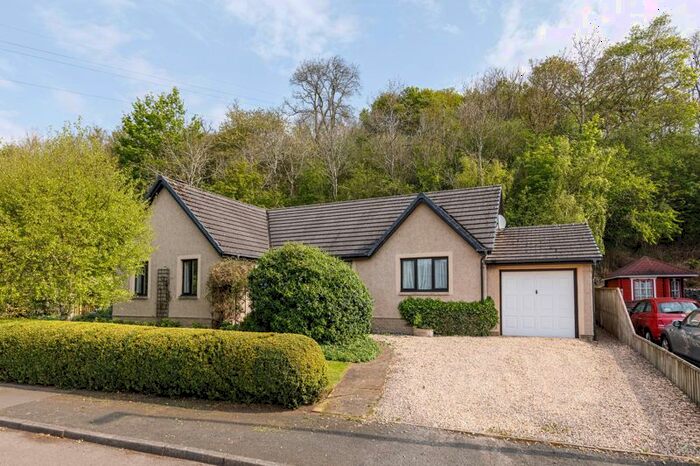
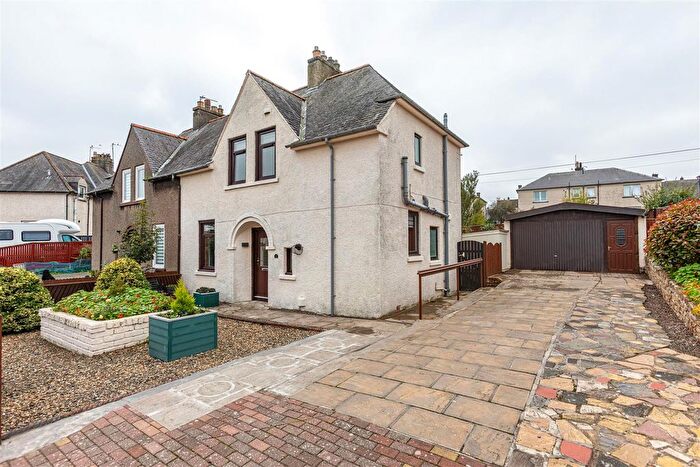
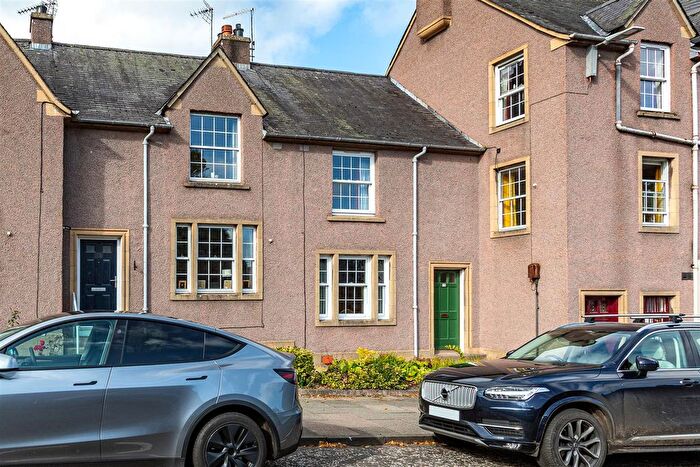
Previously listed properties in Leaderdale and Melrose
Roads and Postcodes in Leaderdale and Melrose
Navigate through our locations to find the location of your next house in Leaderdale and Melrose, Earlston for sale or to rent.
| Streets | Postcodes |
|---|---|
| Mill Road | TD4 6DQ TD4 6DG |
| Acorn Drive | TD4 6BW |
| Aitchison Place | TD4 6HJ |
| Arnot Place | TD4 6DP |
| Ash Lane | TD4 6JJ |
| Bellevue Terrace | TD4 6HP |
| Church Court | TD4 6JN |
| Church Place | TD4 6HR |
| Church Street | TD4 6HS |
| Crown Crescent | TD4 6EZ |
| East End | TD4 6HN TD4 6HU TD4 6HW TD4 6JA TD4 6JG TD4 6JP |
| East Green | TD4 6HL |
| Everest Road | TD4 6HB TD4 6HD |
| Georgefield Road | TD4 6FE |
| Gun Avenue | TD4 6EN |
| Gun Place | TD4 6EL |
| Gun Road | TD4 6EH |
| Gun Terrace | TD4 6EJ |
| Halcombe Crescent | TD4 6DA |
| Hanover Close | TD4 6JD |
| Haughhead Avenue | TD4 6HT |
| Haughhead Road | TD4 6EF TD4 6EQ TD4 6FB TD4 6HZ |
| High Street | TD4 6BS TD4 6BU TD4 6DE TD4 6HG TD4 6HQ TD4 6JQ |
| Huntshaw Avenue | TD4 6EW |
| Huntshaw Place | TD4 6HX |
| Huntshaw Road | TD4 6EB |
| Jubilee Square | TD4 6JE |
| Kidgate | TD4 6DW |
| Lauder Road | TD4 6EE |
| Leaderdale Crescent | TD4 6BJ |
| Mamore Drive | TD4 6JF |
| Melrose Road | TD4 6DL |
| Oakbank Road | TD4 6BL |
| Queens Way | TD4 6EU TD4 6EX TD4 6EY |
| Rhymers Avenue | TD4 6DH |
| Rhymers Court | TD4 6ED |
| Rhymers Mill Industrial Estate | TD4 6FA |
| Rodgers Place | TD4 6EG |
| Roosevelt Place | TD4 6DN |
| South Croft Park | TD4 6HE |
| Station Brae | TD4 6BP |
| Station Road | TD4 6BY TD4 6BZ |
| The Green | TD4 6BX |
| The Old Sawmill | TD4 6FD |
| The Square | TD4 6DB |
| The Terrace | TD4 6HH |
| Thorn Street | TD4 6DR |
| Thornfield Crescent | TD4 6EA |
| Thornfield Road | TD4 6DZ |
| Turfford Park | TD4 6GZ |
| West Summerfield Terrace | TD4 6ER |
| Westfield Place | TD4 6DU |
| Westfield Road | TD4 6DS TD4 6DX |
| Westfield Street | TD4 6DT |
| TD4 6AA TD4 6AB TD4 6AD TD4 6AE TD4 6AF TD4 6AG TD4 6AH TD4 6AJ TD4 6AL TD4 6AN TD4 6AP TD4 6AQ TD4 6AR TD4 6AS TD4 6AT TD4 6AU TD4 6AW TD4 6AX TD4 6AY TD4 6AZ TD4 6BA TD4 6BD TD4 6BE TD4 6BG TD4 6BH TD4 6BN TD4 6BQ TD4 6DJ TD4 6DY TD4 6EP TD4 6ES TD4 6ET TD4 6HA TD4 6HY |
Transport near Leaderdale and Melrose
- FAQ
- Price Paid By Year
Frequently asked questions about Leaderdale and Melrose
What is the average price for a property for sale in Leaderdale and Melrose?
The average price for a property for sale in Leaderdale and Melrose is £210,876. There are 202 property listings for sale in Leaderdale and Melrose.
Which train stations are available in or near Leaderdale and Melrose?
Some of the train stations available in or near Leaderdale and Melrose are Tweedbank, Galashiels and Stow.
Property Price Paid in Leaderdale and Melrose by Year
The average sold property price by year was:
| Year | Average Sold Price | Price Change |
Sold Properties
|
|---|---|---|---|
| 2023 | £157,273 | -39% |
5 Properties |
| 2022 | £218,759 | 17% |
34 Properties |
| 2021 | £181,970 | 12% |
44 Properties |
| 2020 | £159,371 | -2% |
28 Properties |
| 2019 | £162,968 | -2% |
32 Properties |
| 2018 | £166,222 | 1% |
40 Properties |
| 2017 | £163,737 | -14% |
49 Properties |
| 2016 | £186,289 | 26% |
43 Properties |
| 2015 | £137,366 | -21% |
32 Properties |
| 2014 | £166,456 | 13% |
28 Properties |
| 2013 | £145,527 | 6% |
30 Properties |
| 2012 | £136,191 | -2% |
30 Properties |
| 2011 | £138,944 | -18% |
18 Properties |
| 2010 | £163,826 | -8% |
28 Properties |
| 2009 | £176,226 | 33% |
33 Properties |
| 2008 | £117,510 | -29% |
37 Properties |
| 2007 | £151,764 | 8% |
43 Properties |
| 2006 | £139,446 | 28% |
48 Properties |
| 2005 | £100,696 | -69% |
41 Properties |
| 2004 | £170,049 | 40% |
40 Properties |
| 2003 | £102,449 | 27% |
59 Properties |
| 2002 | £74,723 | -60% |
53 Properties |
| 2001 | £119,480 | - |
3 Properties |

