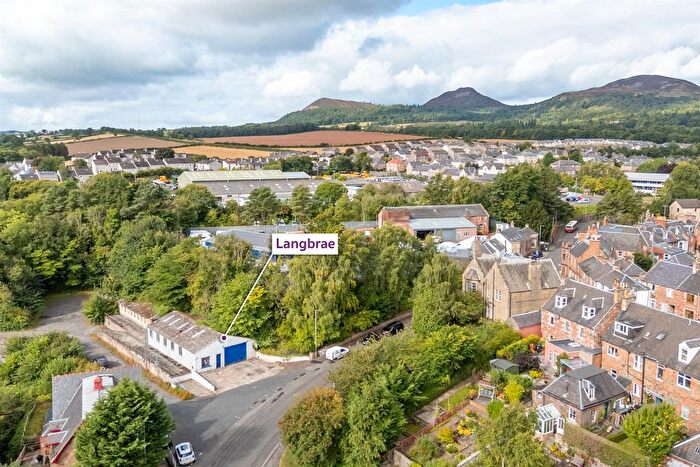
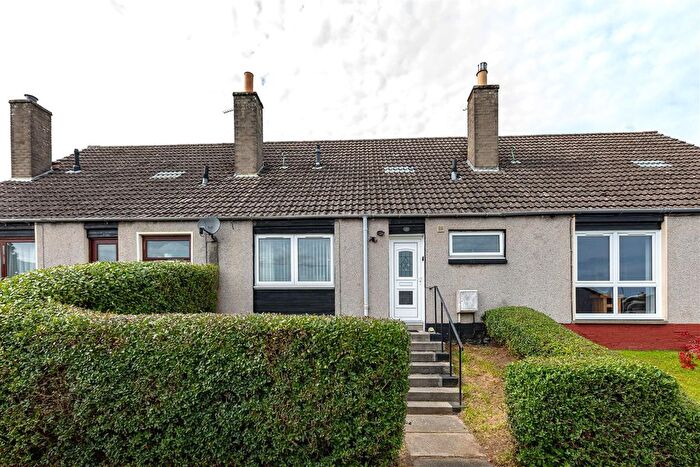
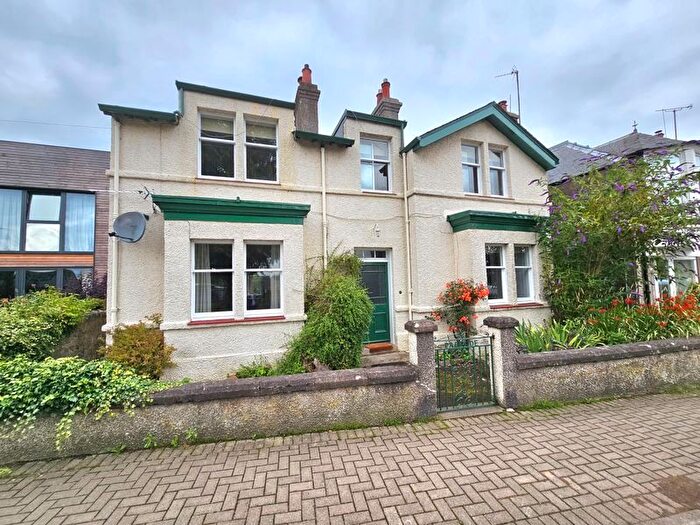
Houses for sale & to rent in Jedburgh and District, Melrose
House Prices in Jedburgh and District
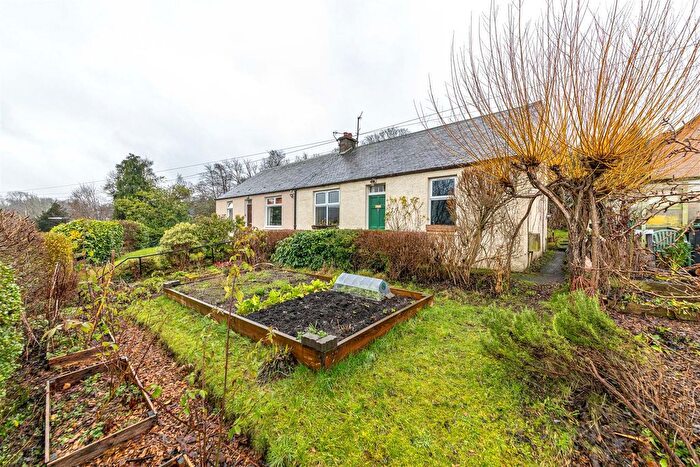
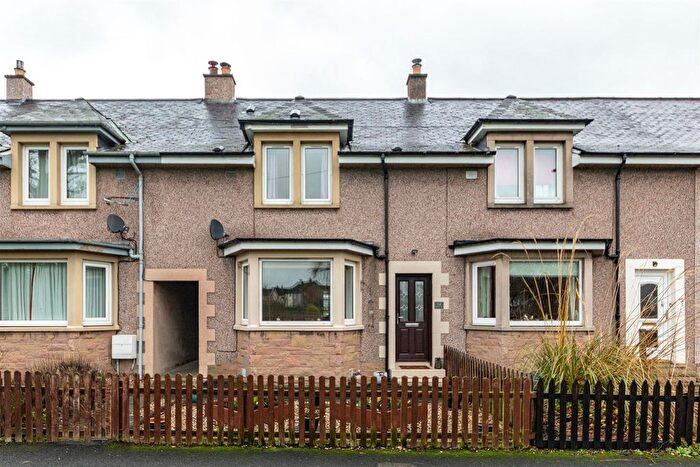
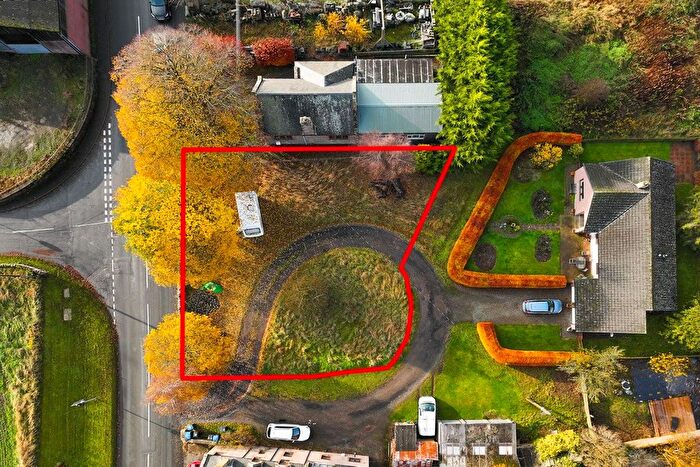
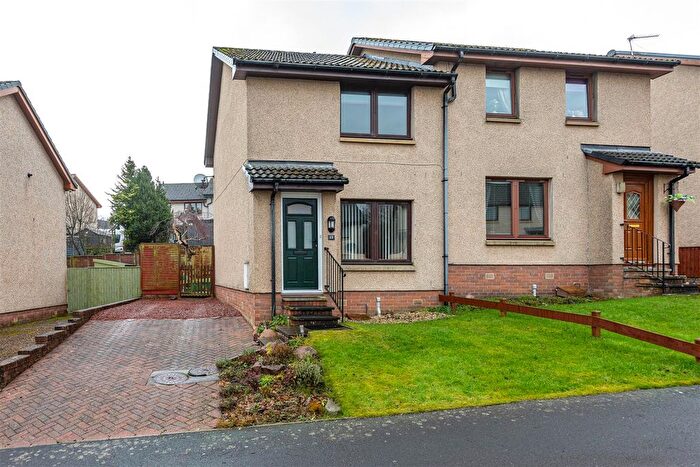
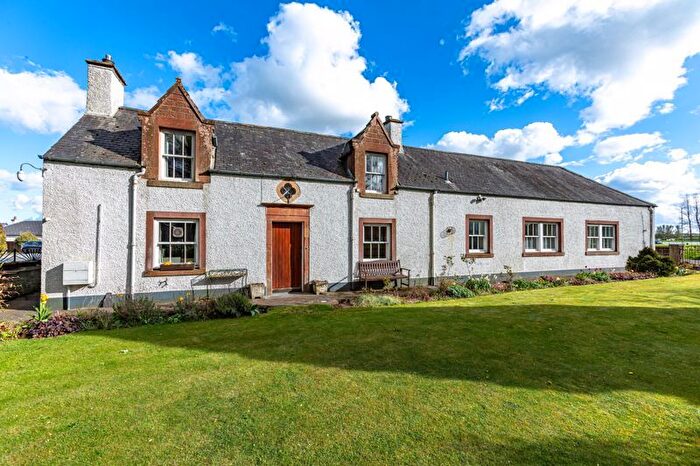
Properties in Jedburgh and District have an average house price of £270,818.00 and had 33 Property Transactions within the last 3 years¹.
Jedburgh and District is an area in Melrose, Scottish Borders with 962 households², where the most expensive property was sold for £595,000.00.
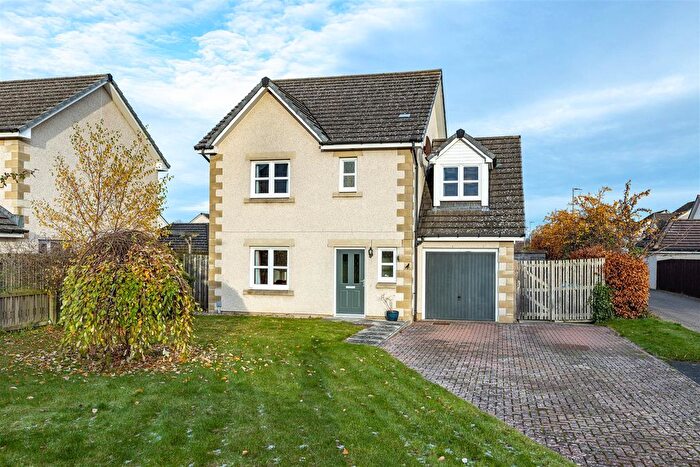
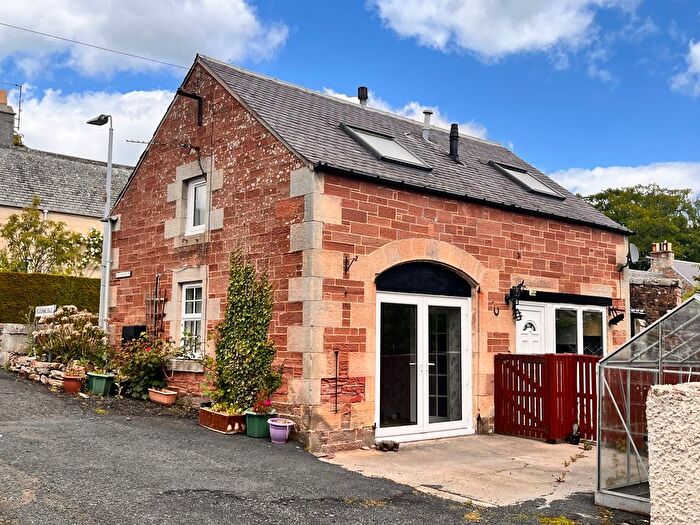
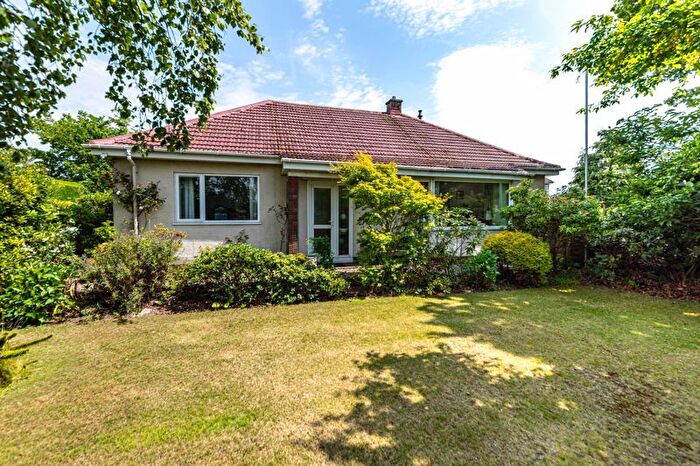
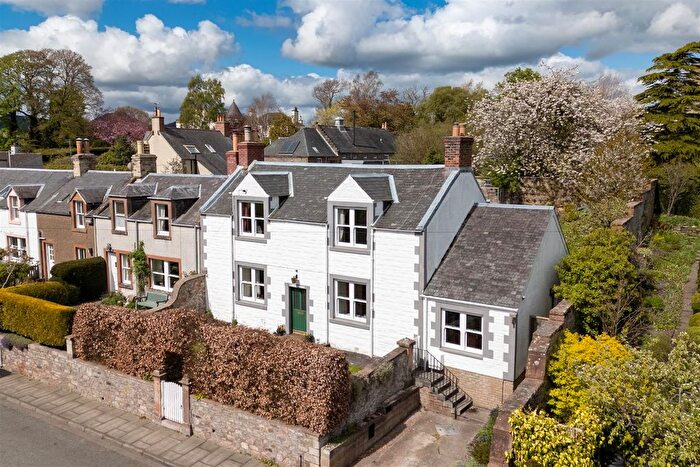
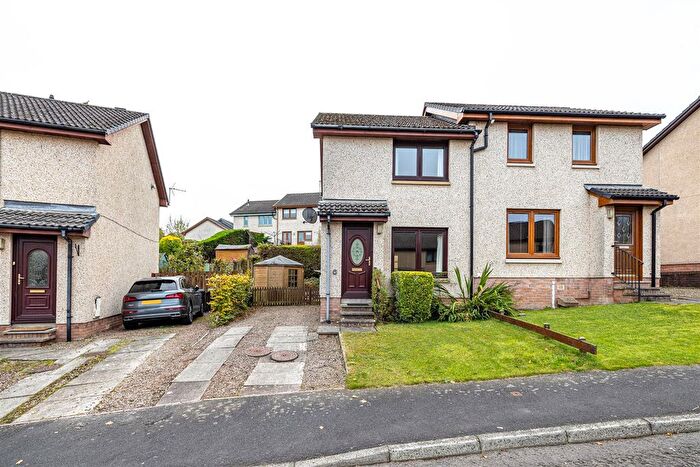
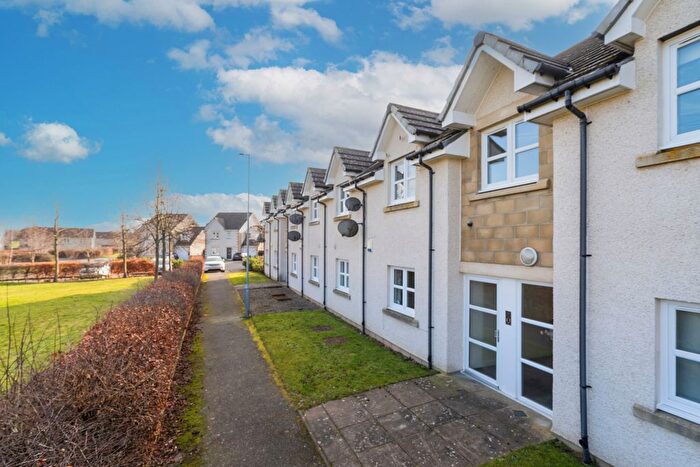
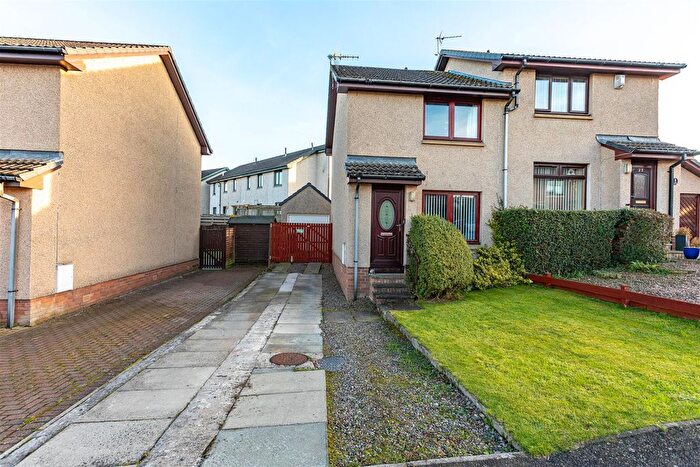
Properties for sale in Jedburgh and District
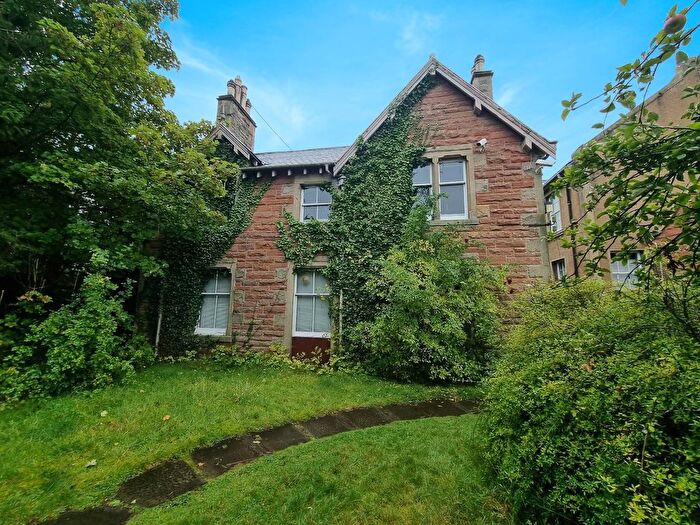
Previously listed properties in Jedburgh and District
Roads and Postcodes in Jedburgh and District
Navigate through our locations to find the location of your next house in Jedburgh and District, Melrose for sale or to rent.
| Streets | Postcodes |
|---|---|
| Birley Court | TD6 0DT |
| Braeheads Road | TD6 0DE |
| Buccleuch Chase | TD6 0HB TD6 0HE |
| Buccleuch Gardens | TD6 0AQ TD6 0ES |
| Capilaw Road | TD6 0BJ |
| Charlesfield | TD6 0HH |
| Grantsfield | TD6 0RR |
| Greenside Park | TD6 0AH |
| Hamilton Place | TD6 0AB |
| Inchdarnie Crescent | TD6 0AW |
| Jean Lawrie Court | TD6 0BF |
| Jenny Moore's Court | TD6 0DS |
| Jenny Moores Road | TD6 0AL TD6 0AN |
| John Younger Gardens | TD6 0DD |
| Lessudden Park | TD6 0BN |
| Main Street | TD6 0AA TD6 0AP TD6 0AT TD6 0AX TD6 0AZ TD6 0BA TD6 0BB TD6 0BE TD6 0BG TD6 0BQ |
| Meadowbank | TD6 0RJ |
| Orchard Park | TD6 0DA TD6 0DB |
| Peake Park | TD6 0DW |
| Polwarth Avenue | TD6 0DP |
| Southfield | TD6 0BX |
| Springfield Square | TD6 0HA |
| Springfield Terrace | TD6 0EP TD6 0ER |
| St Aidans Park | TD6 0DQ |
| St Cuthberts Drive | TD6 0DF |
| St Mary's Court | TD6 0DG |
| St Modans Road | TD6 0BU |
| Strae Brigs | TD6 0DH |
| The Crescent | TD6 0AY |
| The Green | TD6 0ET |
| The Kennels | TD6 0HD |
| The Terrace | TD6 0AU |
| Thoartergate | TD6 0BL |
| Weirgate Avenue | TD6 0BT TD6 0BY |
| Weirgate Brae | TD6 0BS TD6 0BW |
| Weirgate Way | TD6 0BZ |
| William Brown Road | TD6 0DN |
| TD6 0AD TD6 0AE TD6 0AJ TD6 0BD TD6 0BH TD6 0BP TD6 0DJ TD6 0DL TD6 0DU TD6 0DX TD6 0DY TD6 0DZ TD6 0EA TD6 0EB TD6 0ED TD6 0EE TD6 0EF TD6 0EQ TD6 0EU TD6 0EW TD6 0EX TD6 0EY TD6 0HF TD6 0HG TD6 0HJ TD6 0RH TD6 0RL TD6 0RN TD6 0RP TD6 0RQ TD6 0RW TD6 9DN TD6 9DP TD6 9DR TD6 9DS TD6 9DT TD6 9DW TD6 9ES TD6 9ET TD6 9EU |
Transport near Jedburgh and District
- FAQ
- Price Paid By Year
Frequently asked questions about Jedburgh and District
What is the average price for a property for sale in Jedburgh and District?
The average price for a property for sale in Jedburgh and District is £270,818. This amount is 1% lower than the average price in Melrose. There are 124 property listings for sale in Jedburgh and District.
What streets have the most expensive properties for sale in Jedburgh and District?
The streets with the most expensive properties for sale in Jedburgh and District are Buccleuch Chase at an average of £528,808, Birley Court at an average of £362,500 and Grantsfield at an average of £345,000.
What streets have the most affordable properties for sale in Jedburgh and District?
The streets with the most affordable properties for sale in Jedburgh and District are Strae Brigs at an average of £135,000, Hamilton Place at an average of £141,250 and Weirgate Avenue at an average of £170,928.
Which train stations are available in or near Jedburgh and District?
Some of the train stations available in or near Jedburgh and District are Tweedbank, Galashiels and Stow.
Property Price Paid in Jedburgh and District by Year
The average sold property price by year was:
| Year | Average Sold Price | Price Change |
Sold Properties
|
|---|---|---|---|
| 2025 | £253,437 | -8% |
8 Properties |
| 2024 | £274,726 | -1% |
9 Properties |
| 2023 | £277,311 | 3% |
16 Properties |
| 2022 | £270,294 | -33% |
17 Properties |
| 2021 | £359,520 | 44% |
31 Properties |
| 2020 | £199,882 | -54% |
19 Properties |
| 2019 | £306,886 | 19% |
19 Properties |
| 2018 | £247,669 | 15% |
35 Properties |
| 2017 | £210,131 | -2% |
35 Properties |
| 2016 | £213,920 | -2% |
37 Properties |
| 2015 | £217,513 | -12% |
24 Properties |
| 2014 | £242,548 | 33% |
28 Properties |
| 2013 | £162,770 | -17% |
24 Properties |
| 2012 | £191,200 | -12% |
15 Properties |
| 2011 | £214,205 | 21% |
34 Properties |
| 2010 | £169,689 | 14% |
22 Properties |
| 2009 | £146,176 | 10% |
17 Properties |
| 2008 | £131,496 | -54% |
25 Properties |
| 2007 | £201,881 | 17% |
36 Properties |
| 2006 | £166,806 | 0,4% |
53 Properties |
| 2005 | £166,179 | -11% |
50 Properties |
| 2004 | £184,775 | 30% |
31 Properties |
| 2003 | £129,236 | 34% |
54 Properties |
| 2002 | £85,763 | 38% |
40 Properties |
| 2001 | £52,750 | - |
3 Properties |

