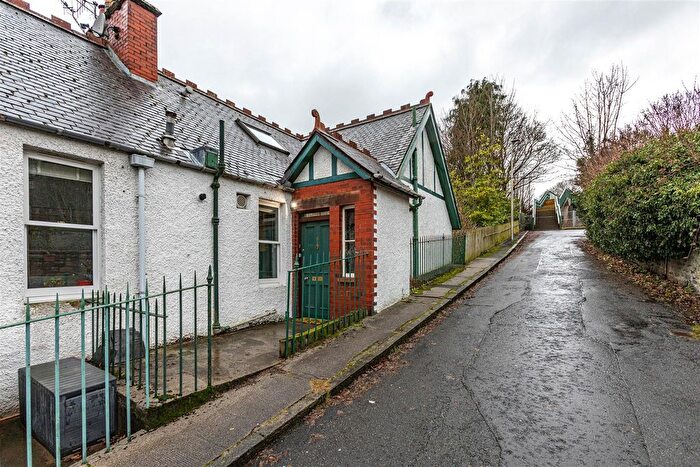
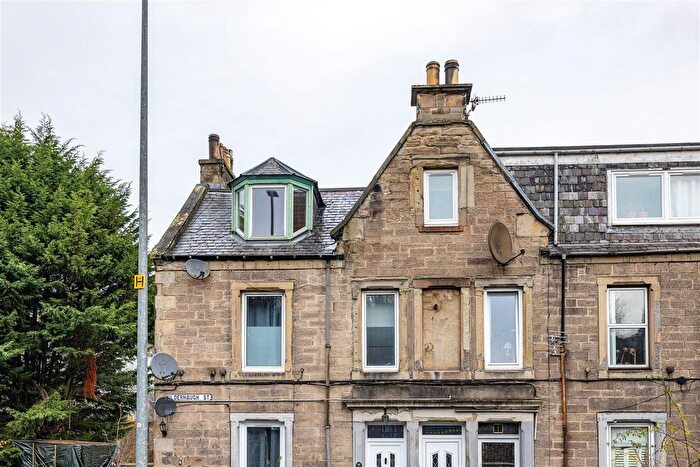
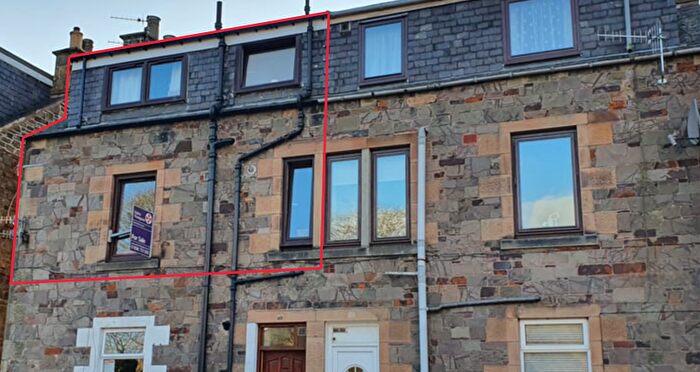
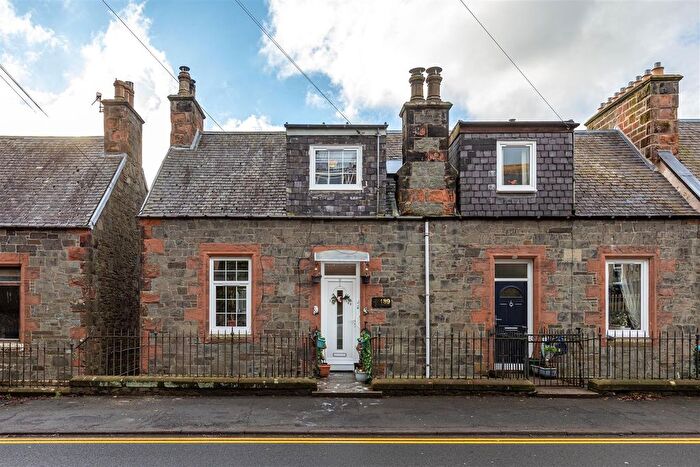
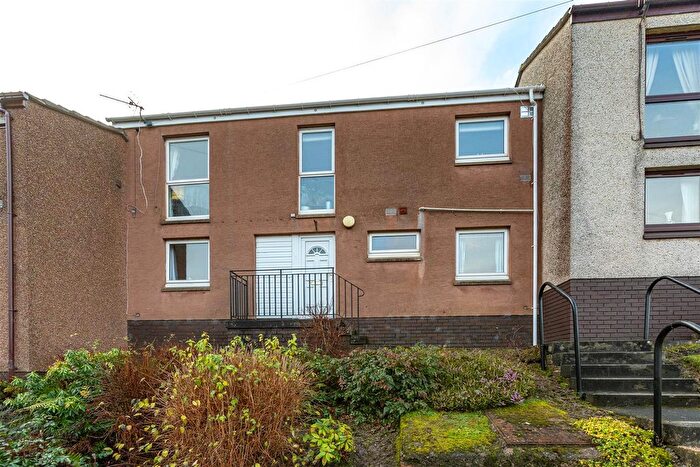
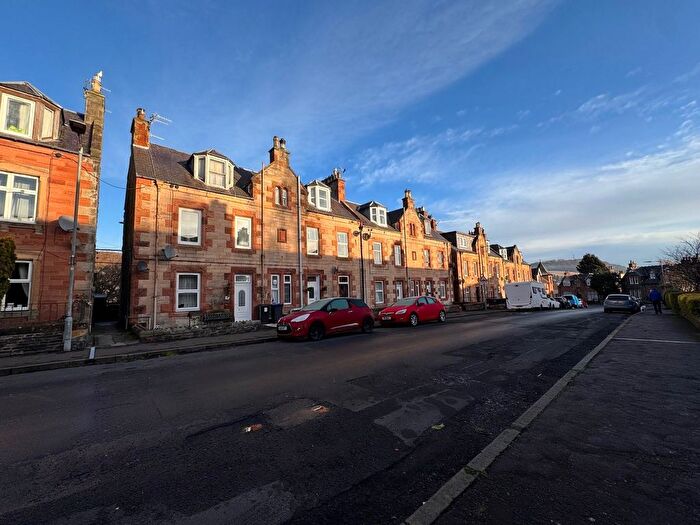
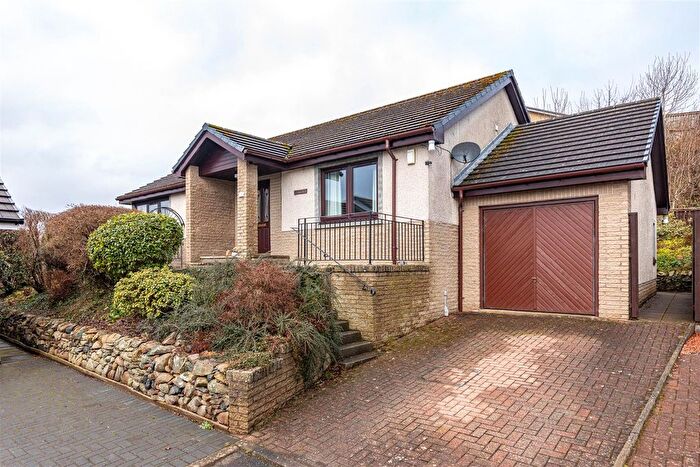
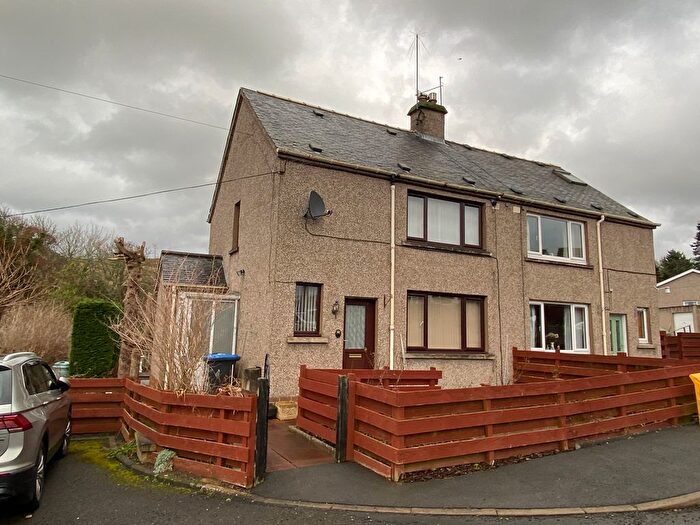
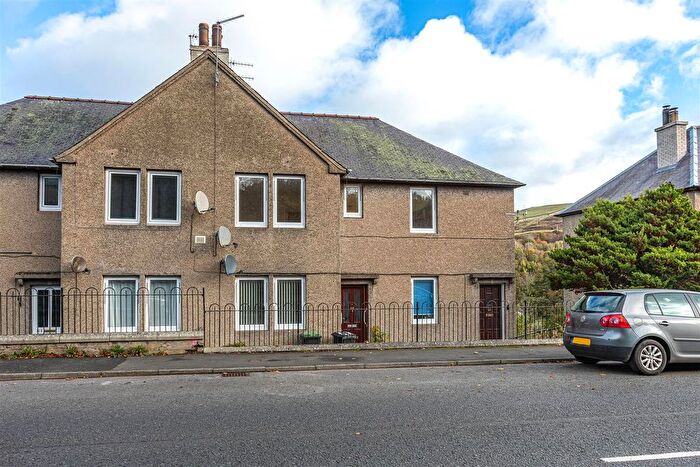
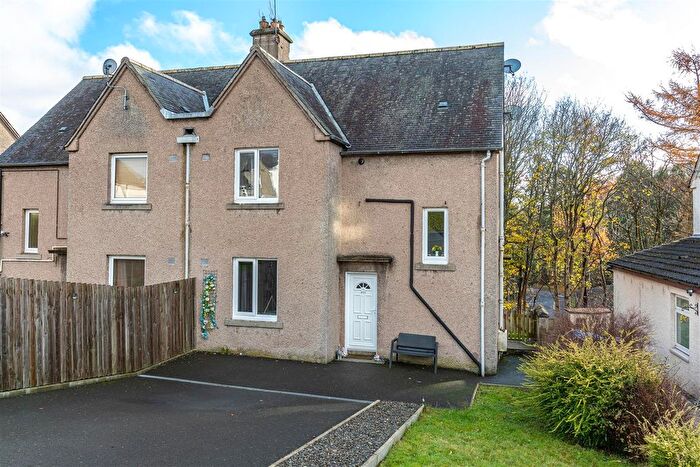
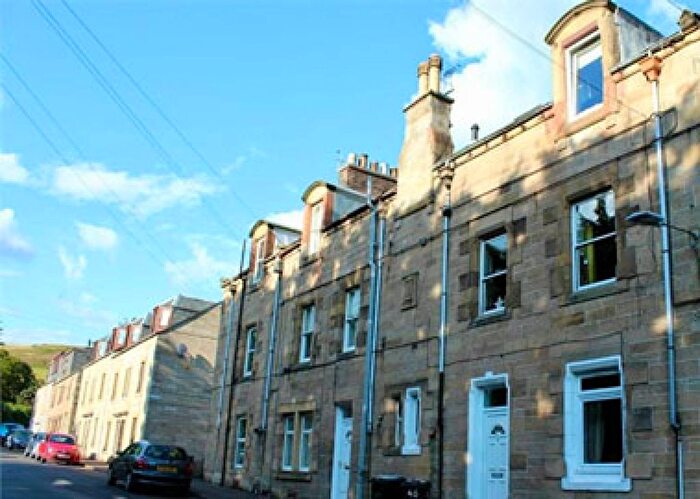
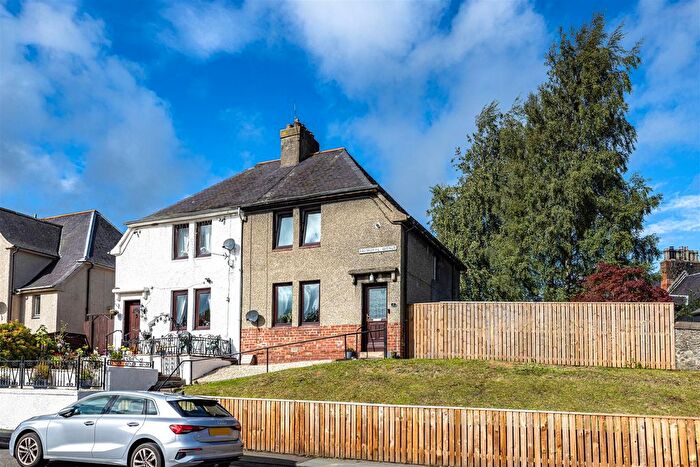
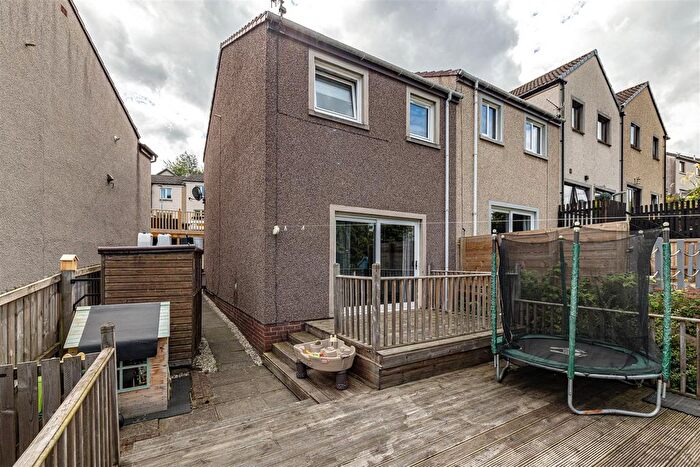
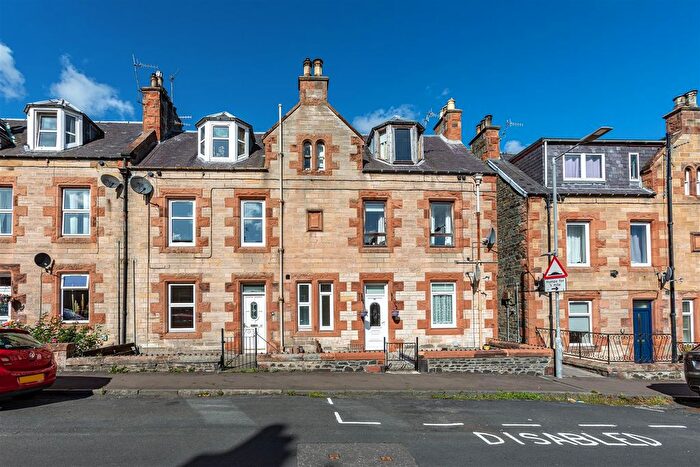
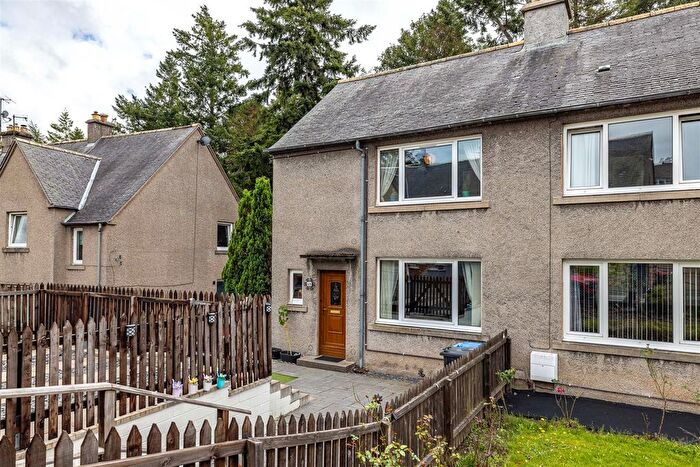
Houses for sale & to rent in Tweeddale East, Galashiels
House Prices in Tweeddale East
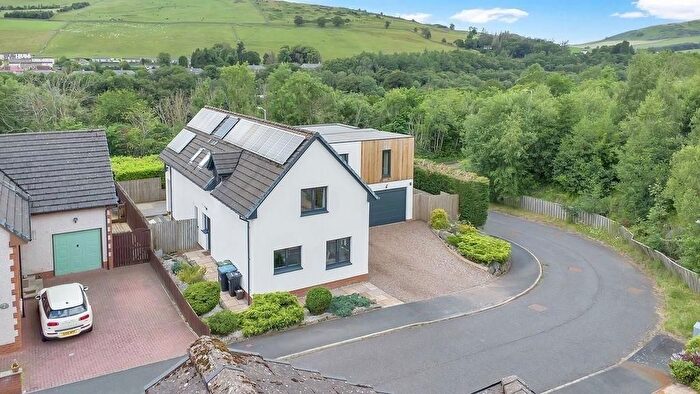
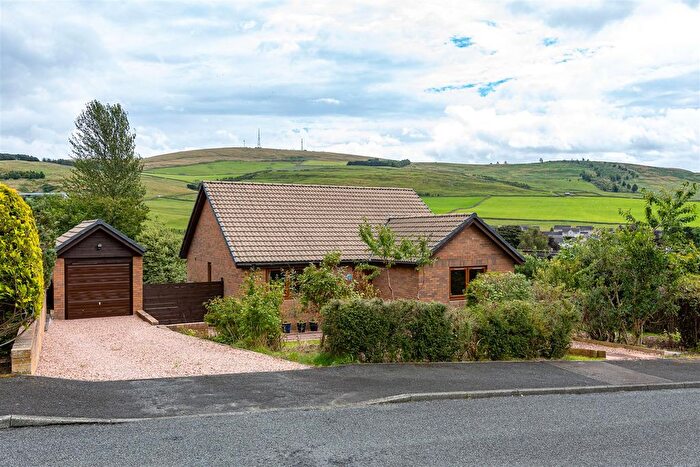
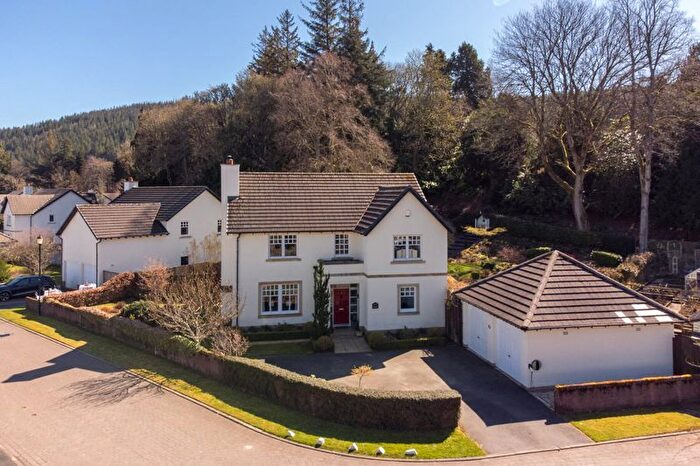
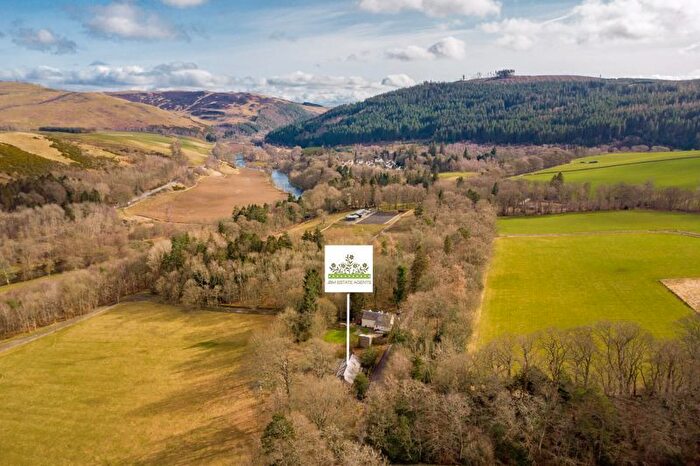
Properties in Tweeddale East have an average house price of £312,245.00 and had 11 Property Transactions within the last 3 years¹.
Tweeddale East is an area in Galashiels, Scottish Borders with 387 households², where the most expensive property was sold for £520,000.00.
Properties for sale in Tweeddale East
Previously listed properties in Tweeddale East
Roads and Postcodes in Tweeddale East
Navigate through our locations to find the location of your next house in Tweeddale East, Galashiels for sale or to rent.
| Streets | Postcodes |
|---|---|
| Bowland Road | TD1 3ND |
| Caddon Haugh | TD1 3LE |
| Caddonfoot Road | TD1 3LY |
| Craigmyle Gardens | TD1 3LP |
| Craigmyle Park | TD1 3LA |
| Lairburn Drive | TD1 3AJ |
| Leyden Grove | TD1 3NF |
| Leyden Park | TD1 3NH |
| Meigle Row | TD1 3LX |
| Millbank Road | TD1 3LZ |
| Old Vineries | TD1 3LB |
| Smithy Row | TD1 3NA |
| Station Yard | TD1 3LT |
| Stirling Terrace | TD1 3NB |
| Thomson Court | TD1 3LD |
| Todburn Way | TD1 3AL |
| Valley View | TD1 3NG |
| Vine Street | TD1 3LU |
| Whytbank Row | TD1 3NE |
| TD1 1TJ TD1 1TL TD1 1TN TD1 1TP TD1 1TR TD1 1TW TD1 1UB TD1 1UE TD1 1UF TD1 1UG TD1 1UH TD1 1UQ TD1 3LG TD1 3LH TD1 3LJ TD1 3LL TD1 3LN TD1 3LQ TD1 3LW TD1 3PP TD1 3PR TD1 3PS TD1 3PW |
Transport near Tweeddale East
- FAQ
- Price Paid By Year
Frequently asked questions about Tweeddale East
What is the average price for a property for sale in Tweeddale East?
The average price for a property for sale in Tweeddale East is £312,245. This amount is 108% higher than the average price in Galashiels. There are 215 property listings for sale in Tweeddale East.
What streets have the most expensive properties for sale in Tweeddale East?
The streets with the most expensive properties for sale in Tweeddale East are Craigmyle Park at an average of £520,000, Leyden Park at an average of £380,000 and Whytbank Row at an average of £355,250.
What streets have the most affordable properties for sale in Tweeddale East?
The streets with the most affordable properties for sale in Tweeddale East are Bowland Road at an average of £265,000, Caddon Haugh at an average of £285,000 and Leyden Grove at an average of £309,700.
Which train stations are available in or near Tweeddale East?
Some of the train stations available in or near Tweeddale East are Galashiels, Tweedbank and Stow.
Property Price Paid in Tweeddale East by Year
The average sold property price by year was:
| Year | Average Sold Price | Price Change |
Sold Properties
|
|---|---|---|---|
| 2025 | £325,625 | -20% |
4 Properties |
| 2024 | £389,233 | 38% |
3 Properties |
| 2023 | £241,125 | -54% |
4 Properties |
| 2022 | £370,543 | 29% |
11 Properties |
| 2021 | £262,387 | -6% |
20 Properties |
| 2020 | £278,321 | -26% |
14 Properties |
| 2019 | £350,628 | 42% |
16 Properties |
| 2018 | £204,695 | -21% |
13 Properties |
| 2017 | £248,511 | 11% |
21 Properties |
| 2016 | £220,777 | -6% |
25 Properties |
| 2015 | £233,493 | 9% |
35 Properties |
| 2014 | £213,343 | 7% |
37 Properties |
| 2013 | £199,258 | 7% |
17 Properties |
| 2012 | £184,793 | -14% |
30 Properties |
| 2011 | £210,450 | -26% |
21 Properties |
| 2010 | £264,300 | 18% |
5 Properties |
| 2009 | £215,522 | -80% |
11 Properties |
| 2008 | £388,787 | 39% |
12 Properties |
| 2007 | £236,810 | 14% |
21 Properties |
| 2006 | £202,662 | 2% |
14 Properties |
| 2005 | £198,666 | 10% |
6 Properties |
| 2004 | £178,151 | 27% |
20 Properties |
| 2003 | £130,369 | -41% |
26 Properties |
| 2002 | £183,376 | 59% |
42 Properties |
| 2001 | £75,910 | - |
5 Properties |

