
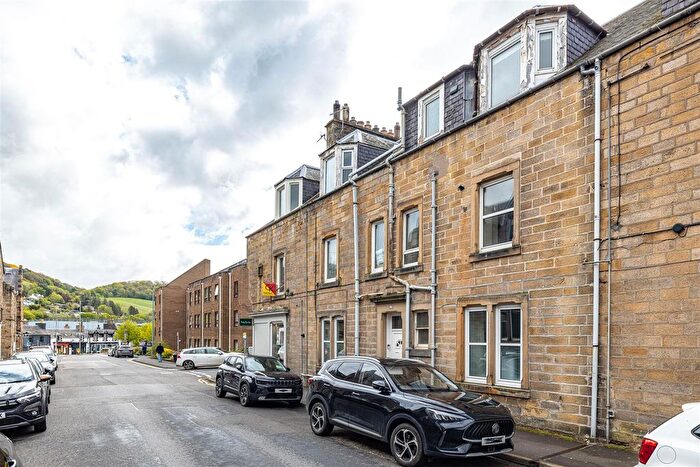
Houses for sale in Galashiels, Scottish Borders
House Prices in Galashiels
Properties in Galashiels have an average house price of £151k and had 562 Property Transactions within the last 3 years.¹
Galashiels is an area in Scottish Borders with 8,216 households², where the most expensive property was sold for £565k.
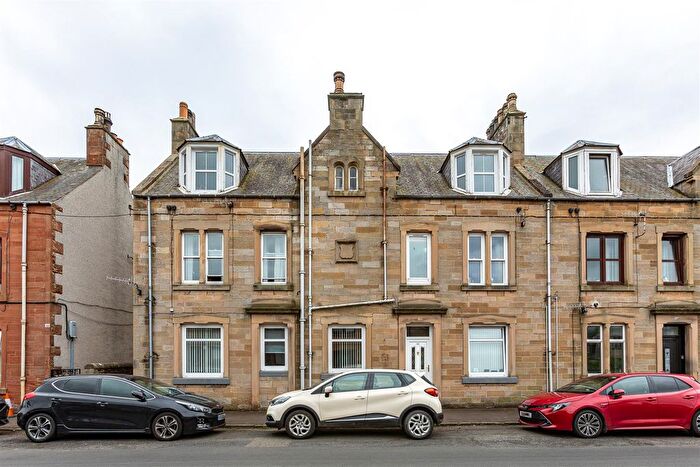
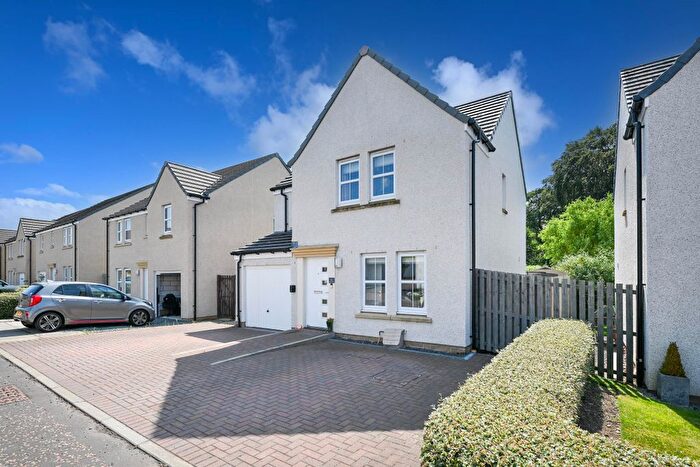
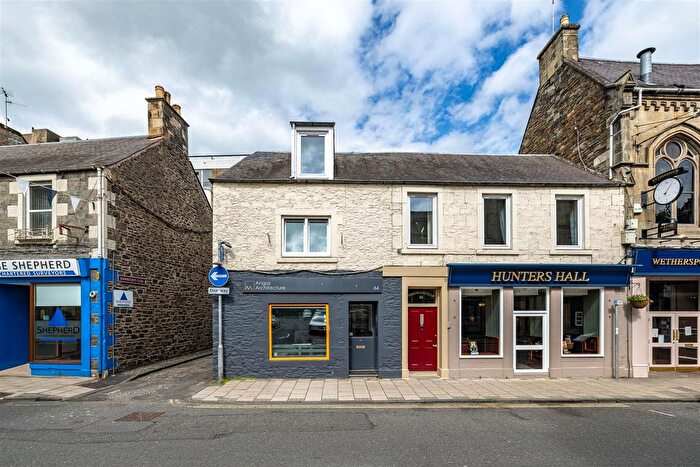
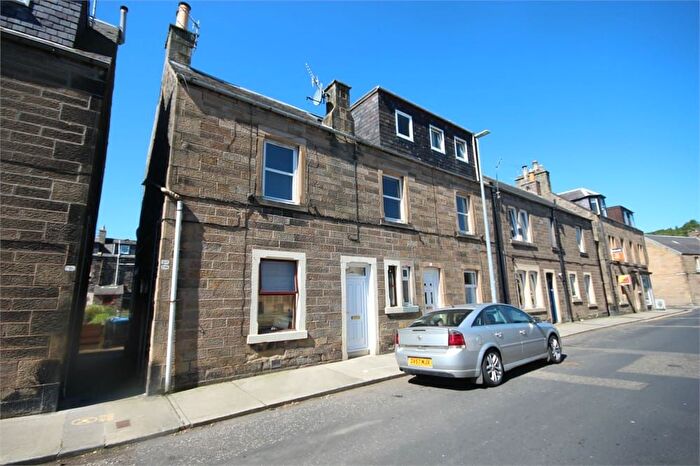
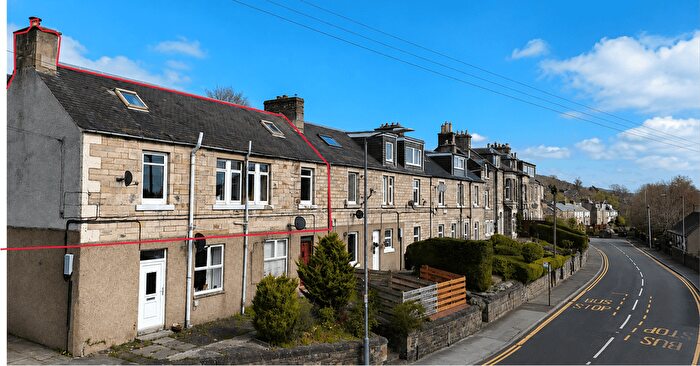
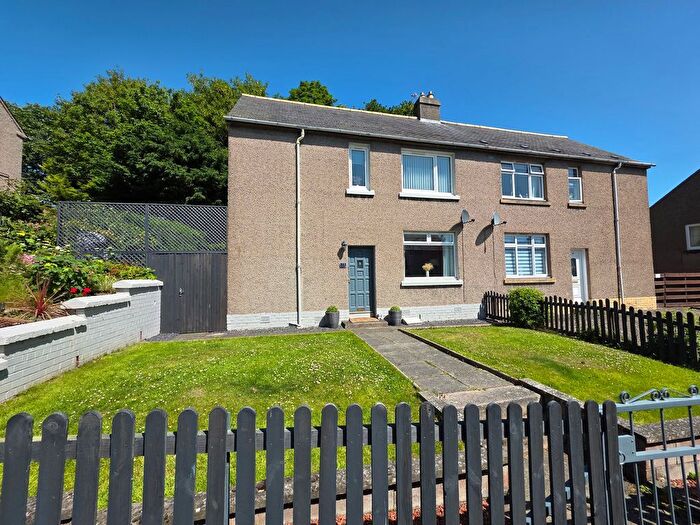
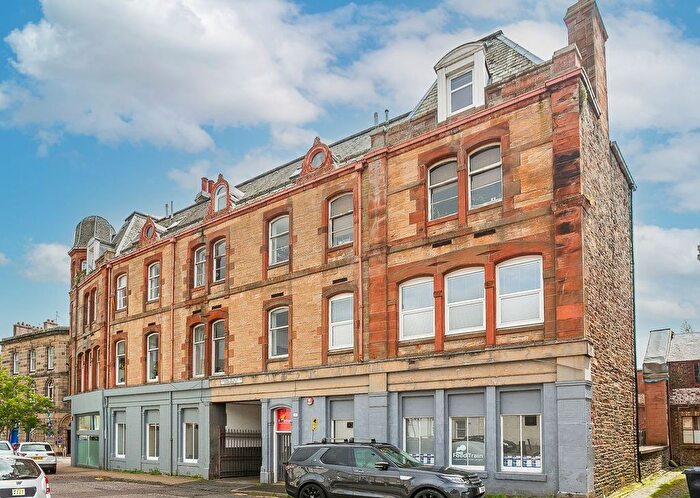
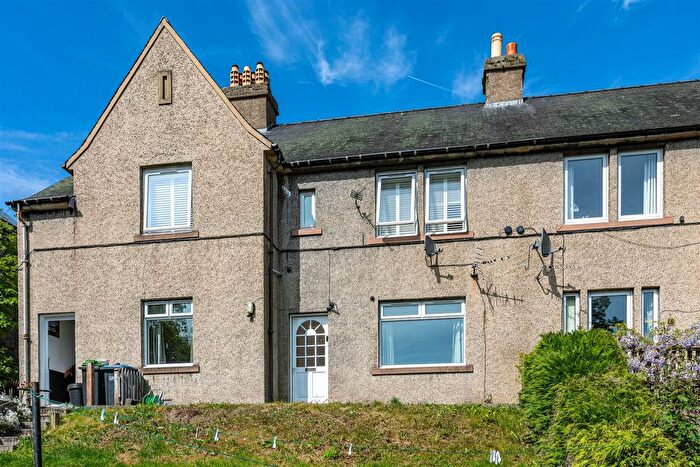
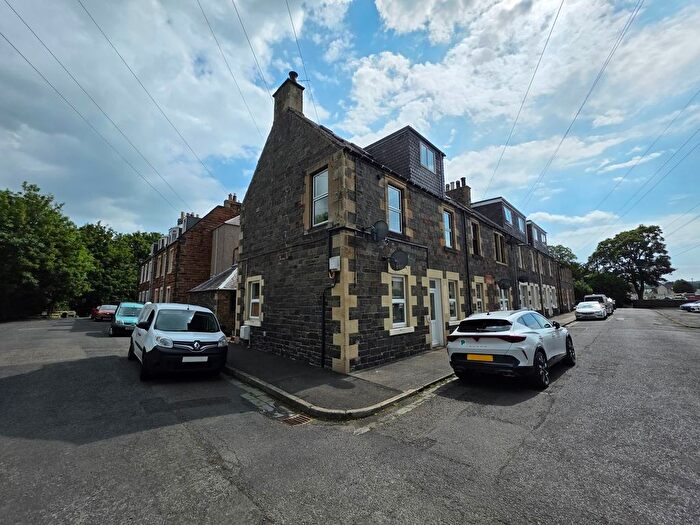
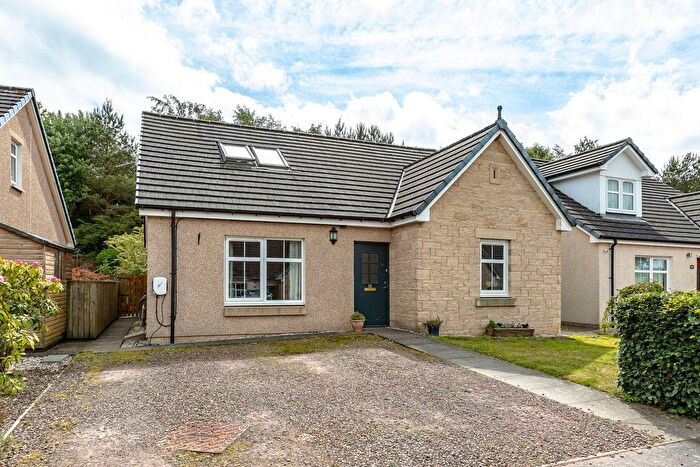
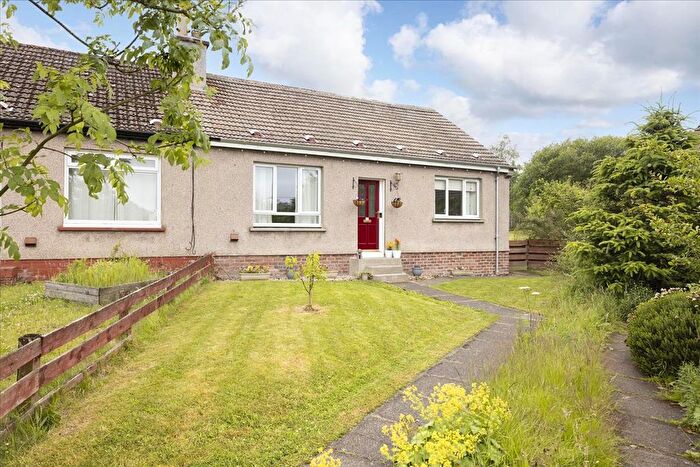
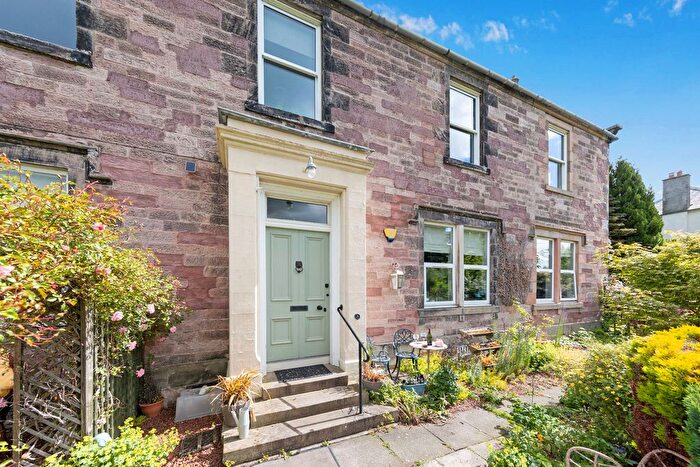
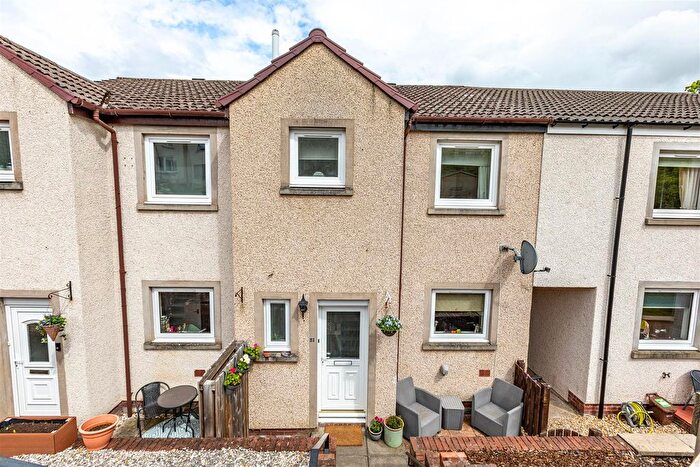
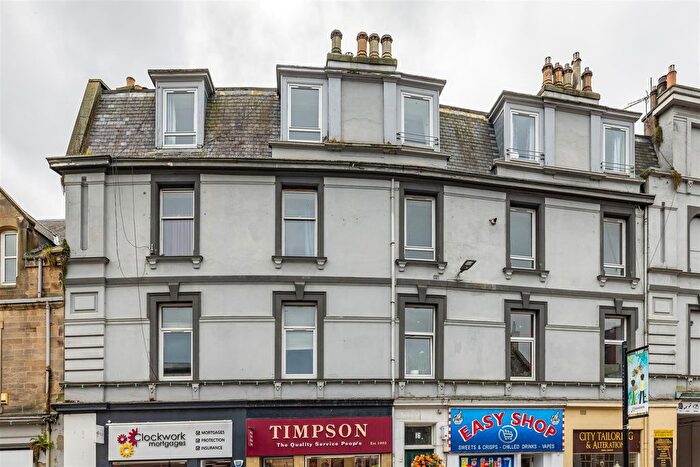
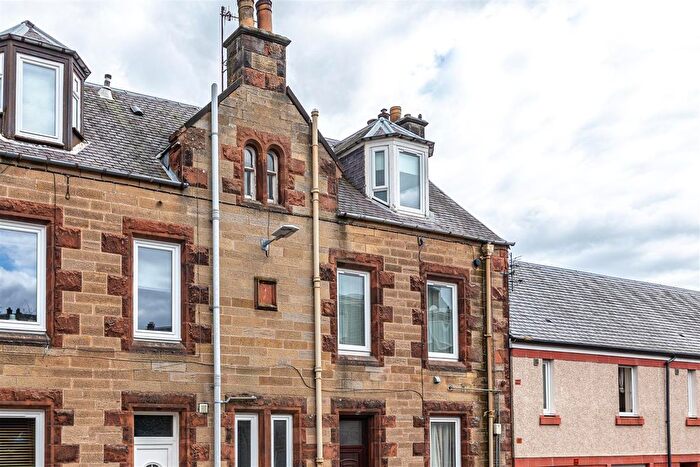
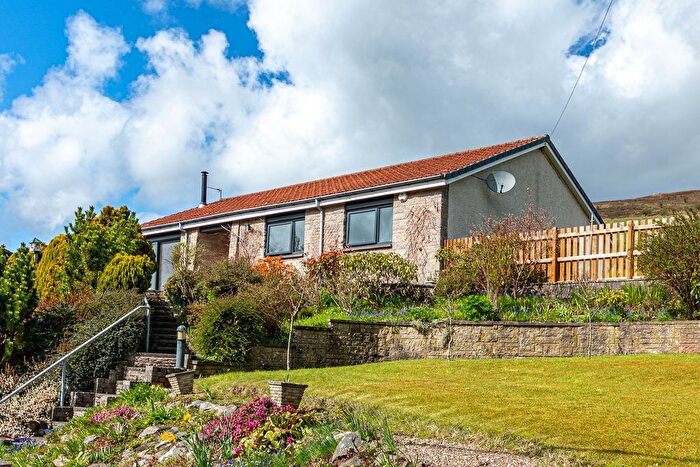
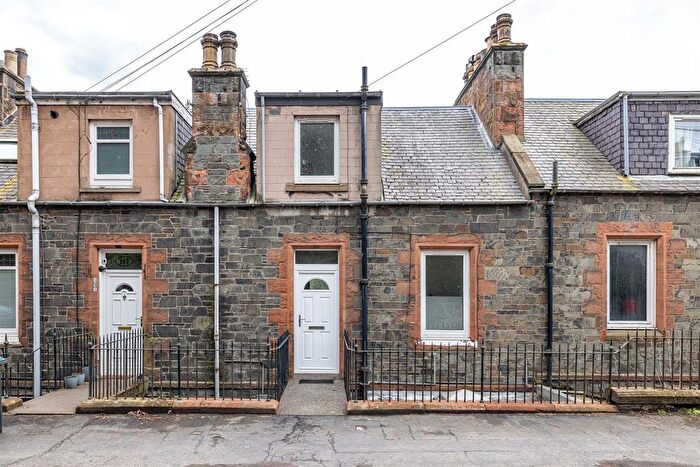
Properties for sale in Galashiels
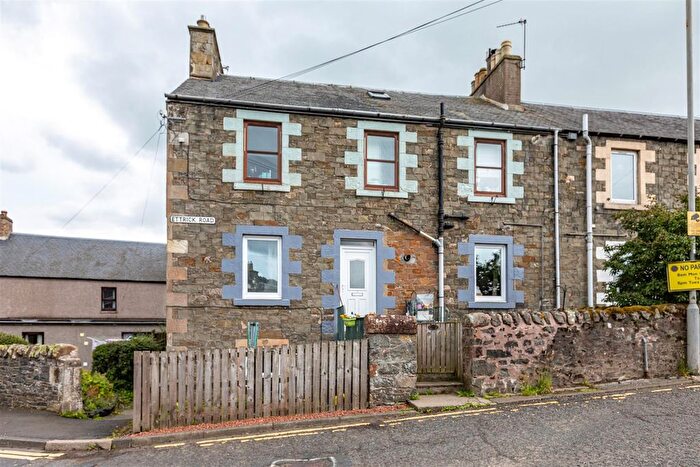
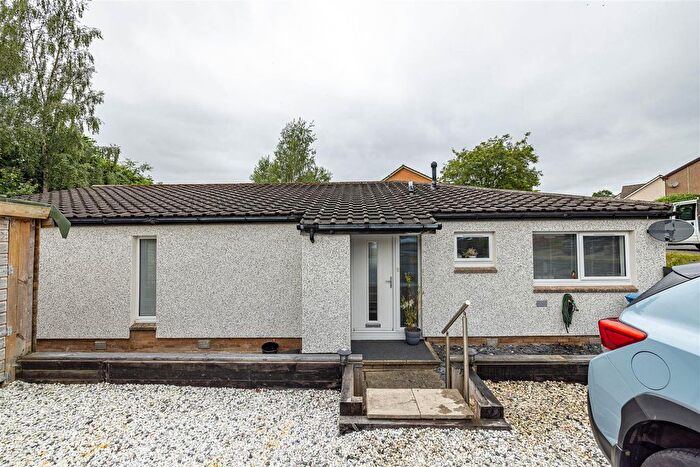
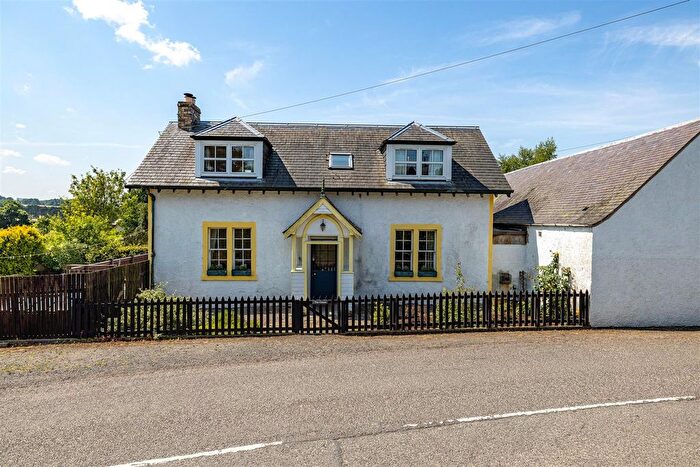
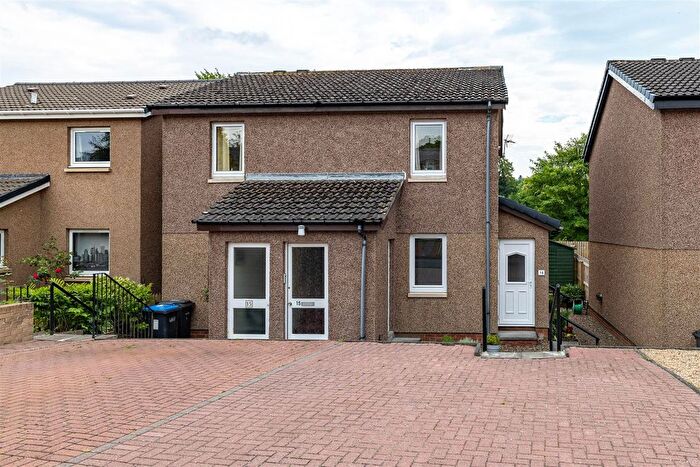
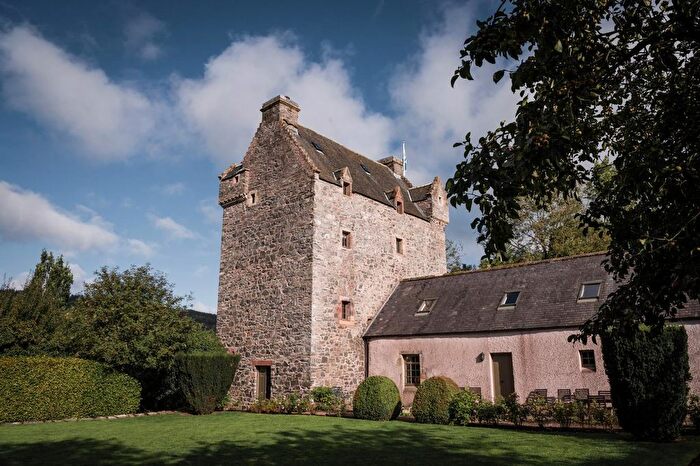
Previously listed properties in Galashiels
![]()
If you are looking to sell your house, let it out, or receive a property valuation, an expert can help you.
Click the button below to get started.
Neighbourhoods in Galashiels
Navigate through our locations to find the location of your next house in Galashiels, Scottish Borders for sale or to rent.
Property price trends in Galashiels
According to the latest Registers of Scotland data, the average home in Galashiels sold for £153,077 in 2025. That figure comes from a substantial record of 8,079 sales logged over the past 24 years.
Prices have fallen back over the last three years. Compared with 2022, when the typical sale came in around £168,312, that's a fall of roughly 9.1%.
Looking back five years, average prices are down about 1.1% since 2020, a drop of around £1,650 in cash terms.
Zoom out to the past decade for the fuller picture. Back in 2015, homes here averaged £144,677, so the typical sold price has climbed about 5.8% since then, roughly 0.6% a year. Stretch the view to fifteen years and that annual pace eases back to about -8.6%.
Frequently asked questions about Galashiels
What is the average price for a property for sale in Galashiels?
The average price for a property for sale in Galashiels is £150,509. This amount is 24% lower than the average price in Scottish Borders. There are 1,141 property listings for sale in Galashiels.
What locations have the most expensive properties for sale in Galashiels?
The locations with the most expensive properties for sale in Galashiels are Tweeddale East at an average of £312,245 and Leaderdale and Melrose at an average of £211,141.
What locations have the most affordable properties for sale in Galashiels?
The location with the most affordable properties for sale in Galashiels is Galashiels and District at an average of £140,484.
Which train stations are available in or near Galashiels?
Some of the train stations available in or near Galashiels are Galashiels, Tweedbank and Stow.
Property Price Paid in Galashiels by Year
The average sold property price by year was:
| Year | Average Sold Price | Price Change |
Sold Properties
|
|---|---|---|---|
| 2025 | £153,077 | 5% |
193 Properties |
| 2024 | £145,908 | -4% |
172 Properties |
| 2023 | £152,011 | -11% |
197 Properties |
| 2022 | £168,312 | 12% |
384 Properties |
| 2021 | £148,411 | -4% |
414 Properties |
| 2020 | £154,727 | 4% |
340 Properties |
| 2019 | £147,786 | 3% |
353 Properties |
| 2018 | £144,059 | -4% |
341 Properties |
| 2017 | £150,017 | 6% |
343 Properties |
| 2016 | £140,664 | -3% |
311 Properties |
Transport in Galashiels
Please see below transportation links in this area:
