
Houses for sale & to rent in Kelso, Scottish Borders
House Prices in Kelso
Properties in Kelso have an average house price of £228k and had 233 Property Transactions within the last 3 years.¹
Kelso is an area in Scottish Borders with 5,173 households², where the most expensive property was sold for £1.08M.
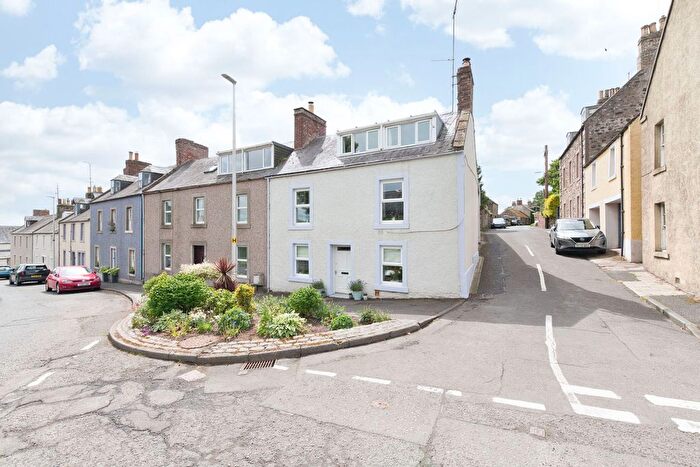
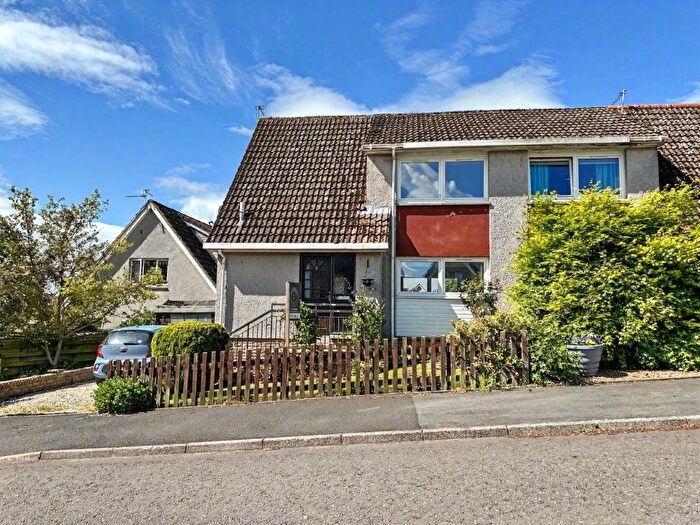
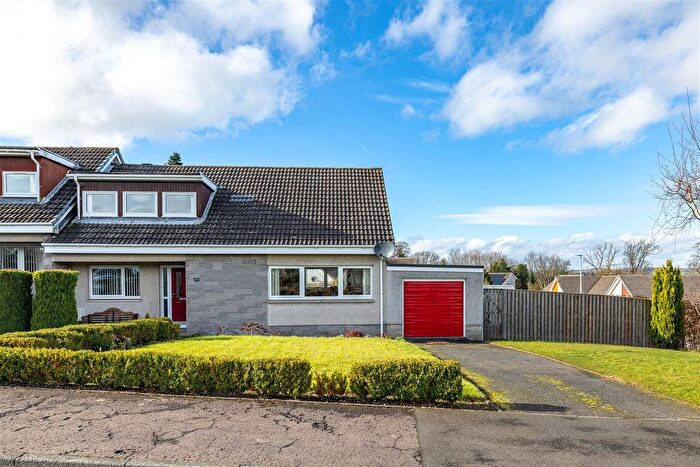
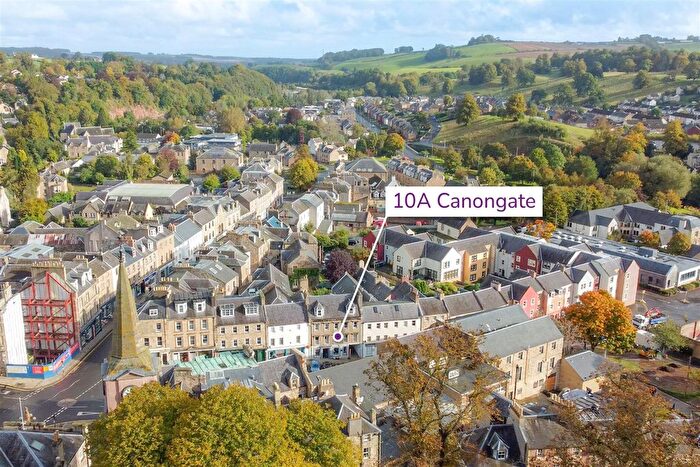
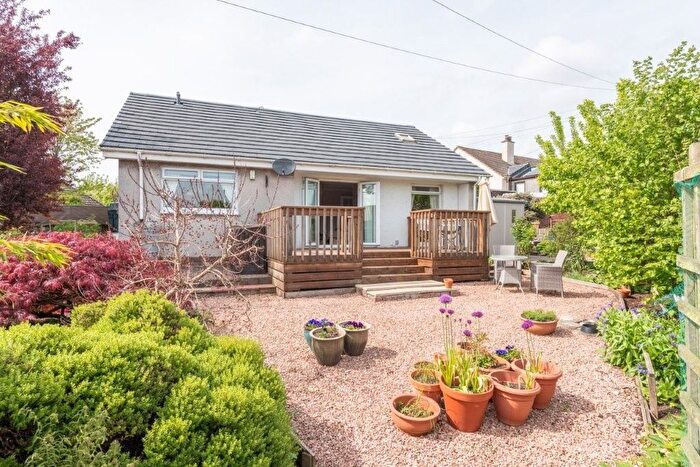
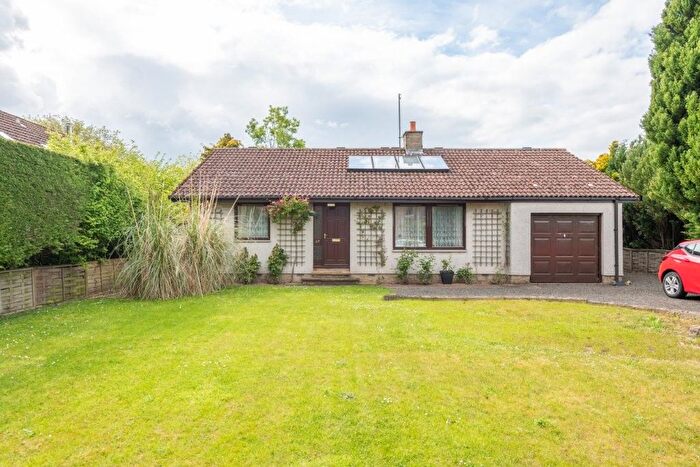
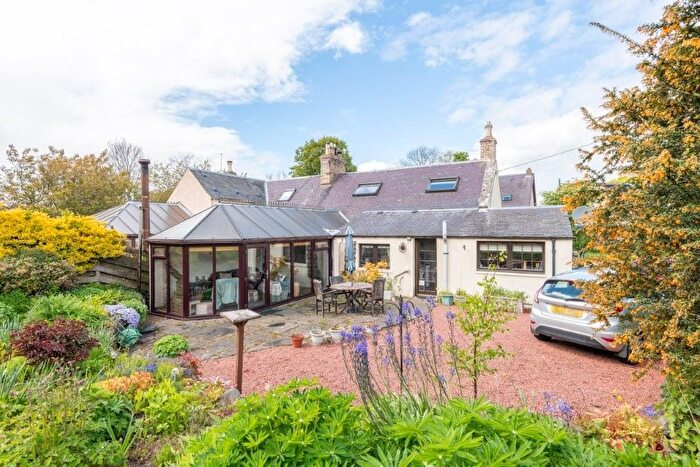
Properties for sale in Kelso
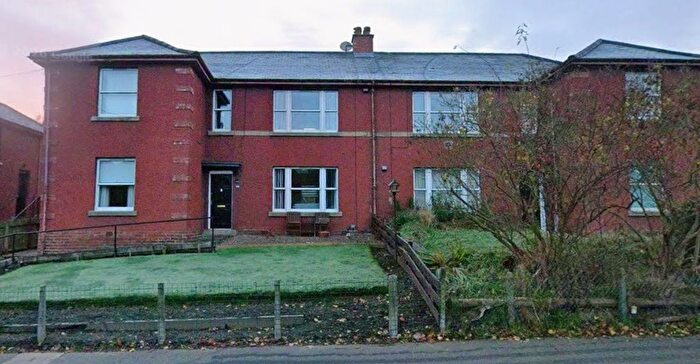
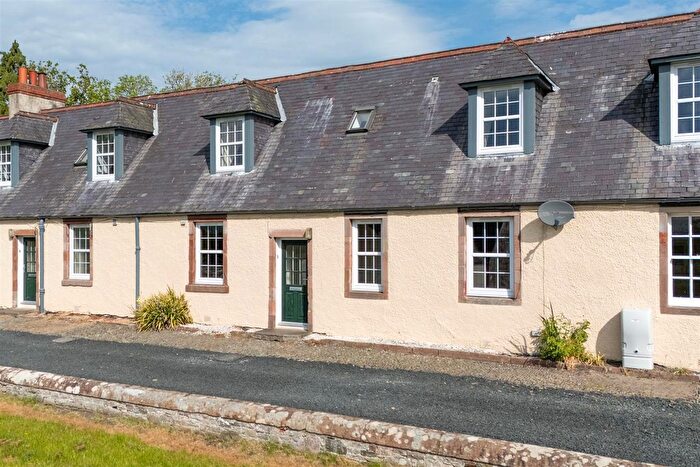
![]()
If you are looking to sell your house, let it out, or receive a property valuation, an expert can help you.
Click the button below to get started.
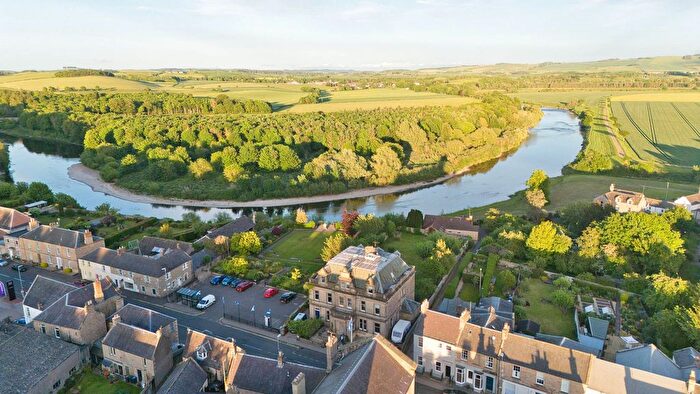
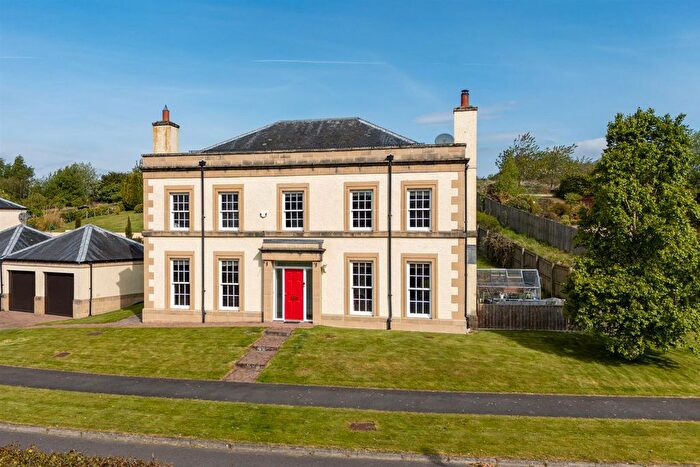
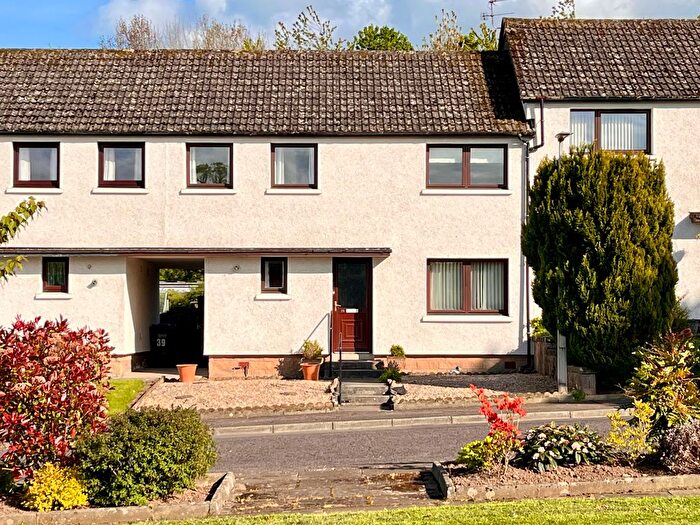
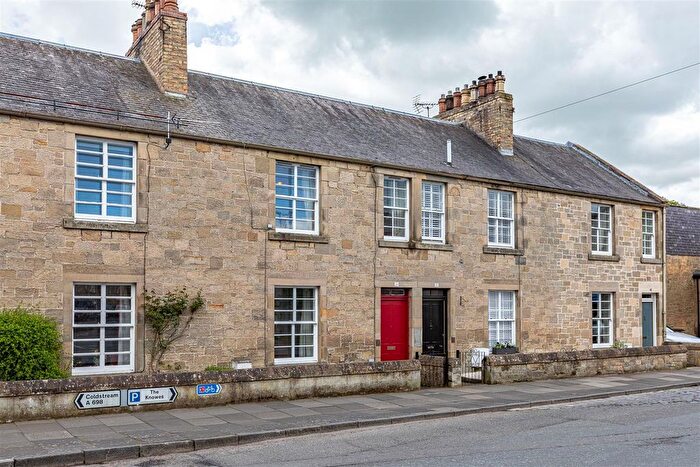
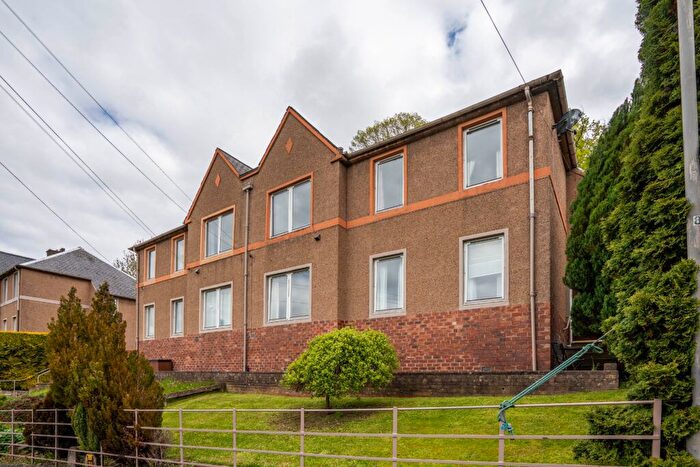
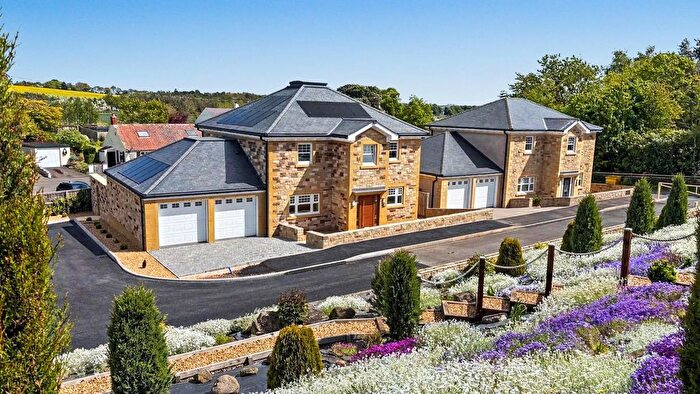
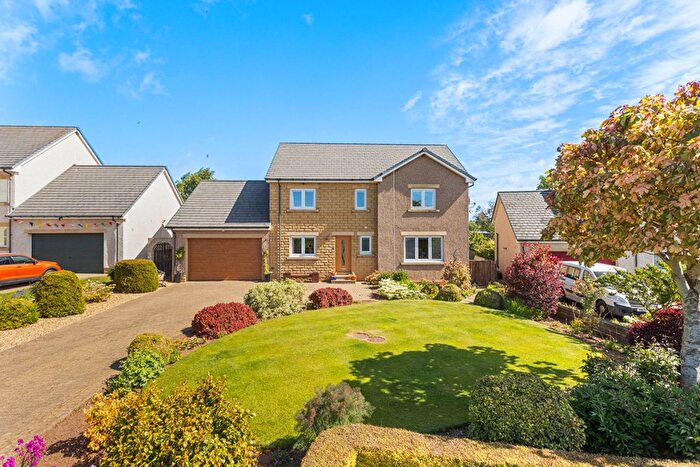
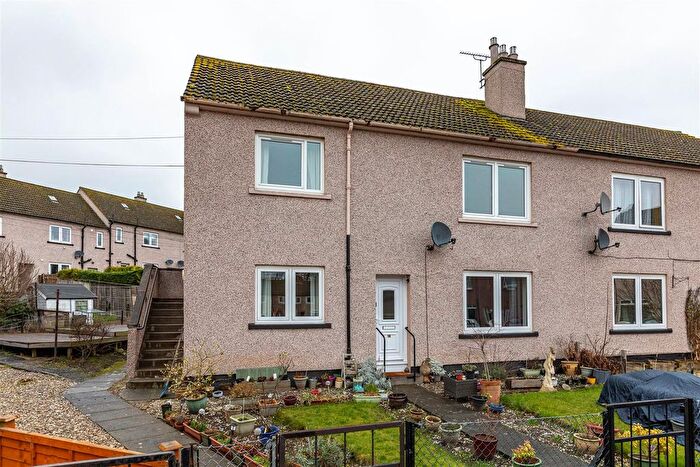
Previously listed properties in Kelso
![]()
If you are looking to sell your house, let it out, or receive a property valuation, an expert can help you.
Click the button below to get started.
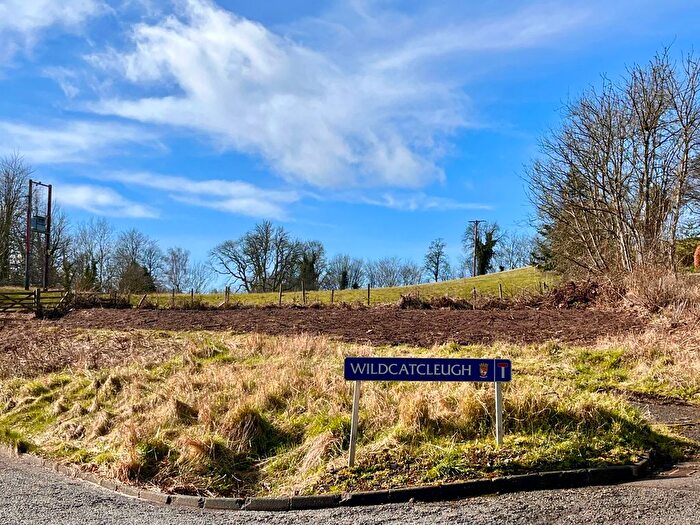
Neighbourhoods in Kelso
Navigate through our locations to find the location of your next house in Kelso, Scottish Borders for sale or to rent.
Transport in Kelso
Please see below transportation links in this area:

- FAQ
- Price Paid By Year
Frequently asked questions about Kelso
What is the average price for a property for sale in Kelso?
The average price for a property for sale in Kelso is £228,172. This amount is 16% higher than the average price in Scottish Borders. There are 875 property listings for sale in Kelso.
What locations have the most expensive properties for sale in Kelso?
The location with the most expensive properties for sale in Kelso is Jedburgh and District at an average of £475,500.
What locations have the most affordable properties for sale in Kelso?
The location with the most affordable properties for sale in Kelso is Kelso And District at an average of £221,634.
Which train stations are available in or near Kelso?
Some of the train stations available in or near Kelso are Tweedbank, Galashiels and Stow.
Property Price Paid in Kelso by Year
The average sold property price by year was:
| Year | Average Sold Price | Price Change |
Sold Properties
|
|---|---|---|---|
| 2025 | £224,842 | -1% |
78 Properties |
| 2024 | £228,058 | -1% |
64 Properties |
| 2023 | £231,106 | -10% |
91 Properties |
| 2022 | £253,392 | 12% |
201 Properties |
| 2021 | £222,313 | 5% |
197 Properties |
| 2020 | £210,459 | 6% |
185 Properties |
| 2019 | £197,394 | 8% |
183 Properties |
| 2018 | £180,890 | 1% |
210 Properties |
| 2017 | £179,959 | 6% |
190 Properties |
| 2016 | £169,152 | -15% |
192 Properties |
| 2015 | £193,727 | 7% |
186 Properties |
| 2014 | £180,539 | 5% |
167 Properties |
| 2013 | £171,320 | 1% |
173 Properties |
| 2012 | £169,307 | -5% |
118 Properties |
| 2011 | £177,953 | 5% |
126 Properties |
| 2010 | £168,537 | 12% |
124 Properties |
| 2009 | £148,738 | -7% |
131 Properties |
| 2008 | £159,466 | 3% |
163 Properties |
| 2007 | £155,189 | 1% |
196 Properties |
| 2006 | £153,761 | -0,3% |
251 Properties |
| 2005 | £154,200 | 30% |
193 Properties |
| 2004 | £108,304 | -16% |
210 Properties |
| 2003 | £125,971 | 39% |
248 Properties |
| 2002 | £76,552 | 28% |
264 Properties |
| 2001 | £54,934 | 34% |
18 Properties |
| 1999 | £36,000 | - |
1 Property |