
Houses for sale in Jedburgh and District, Kelso
House Prices in Jedburgh and District
Properties in Jedburgh and District have an average house price of £476k and had 6 Property Transactions within the last 3 years¹.
Jedburgh and District is an area in Kelso, Scottish Borders with 380 households², where the most expensive property was sold for £810k.
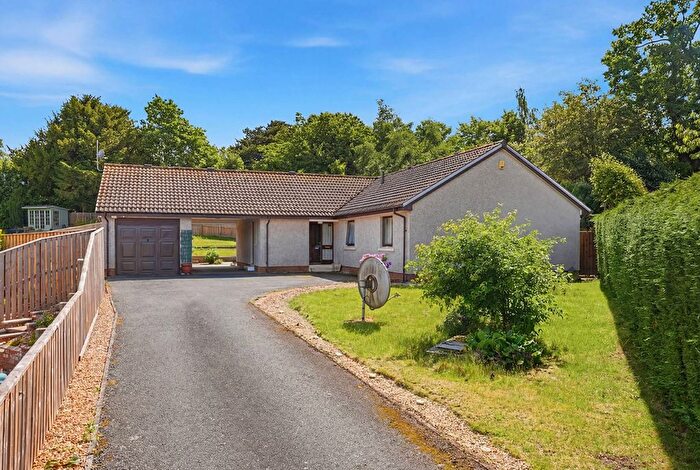
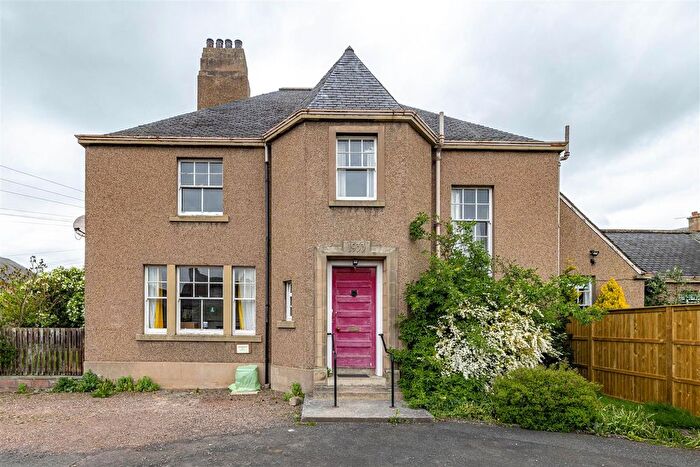
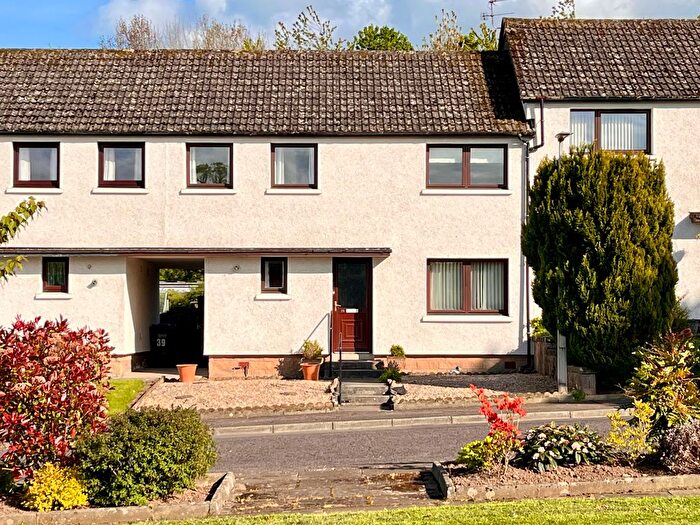
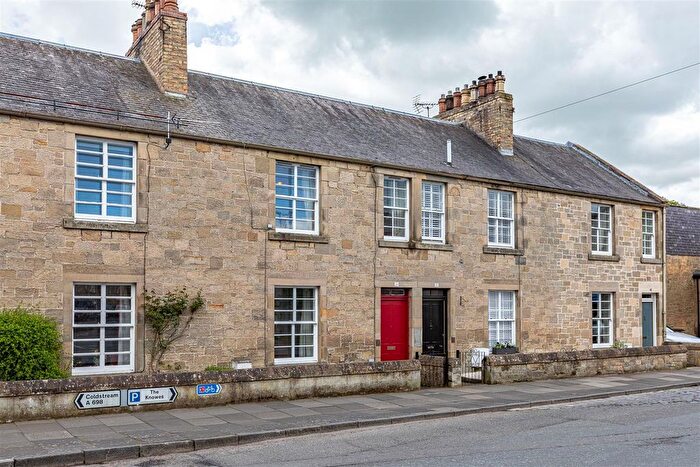
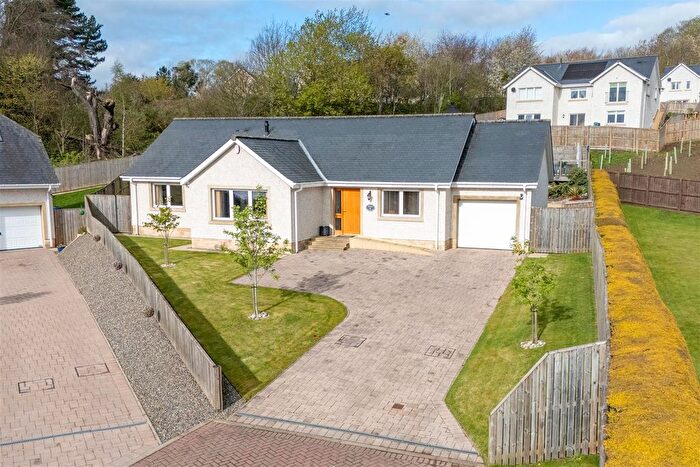
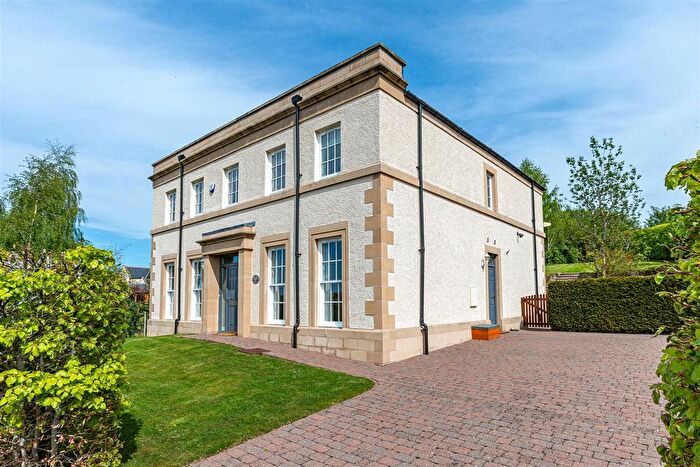
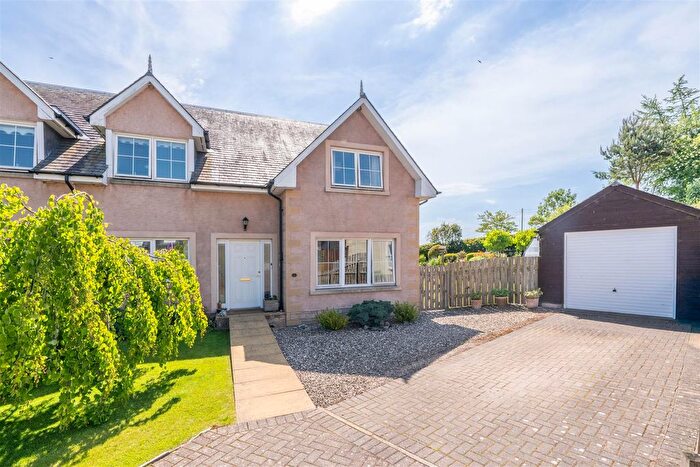
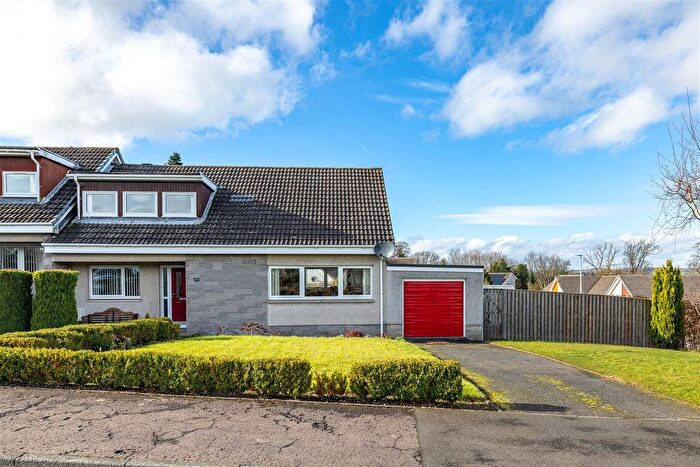
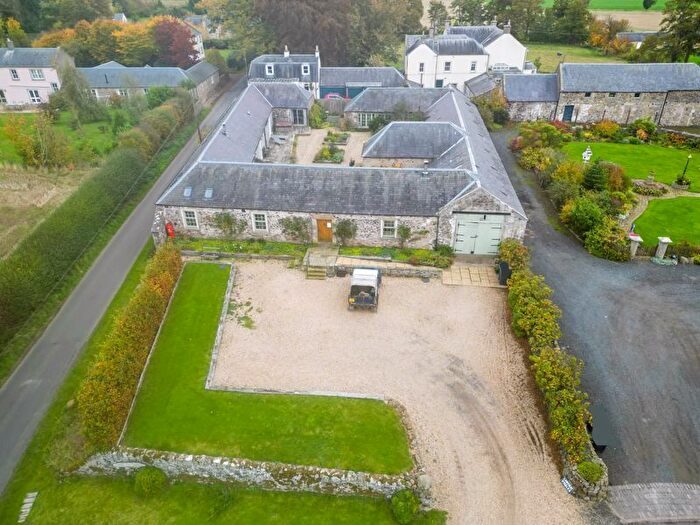
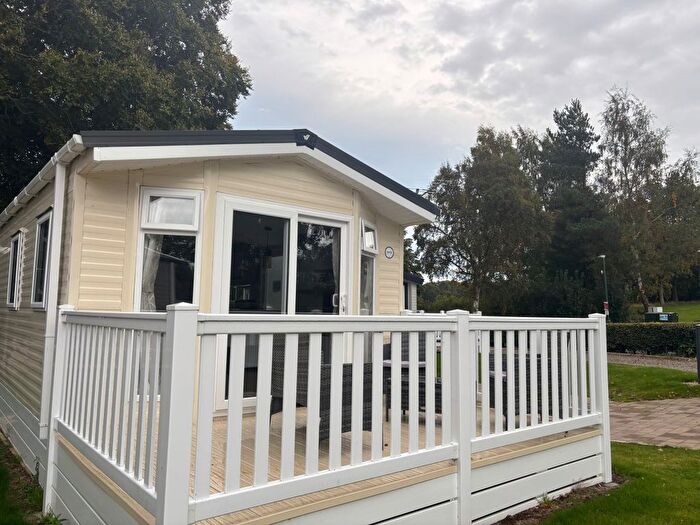
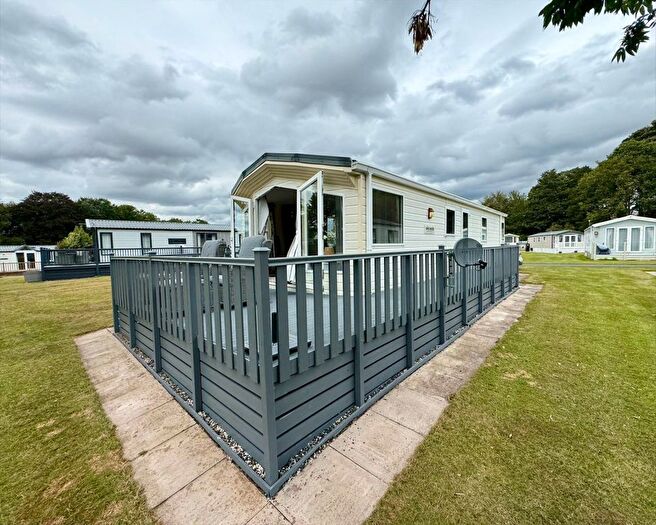
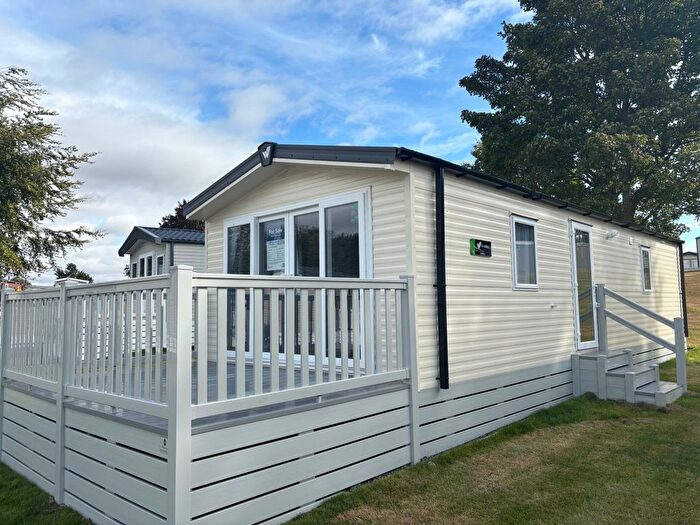
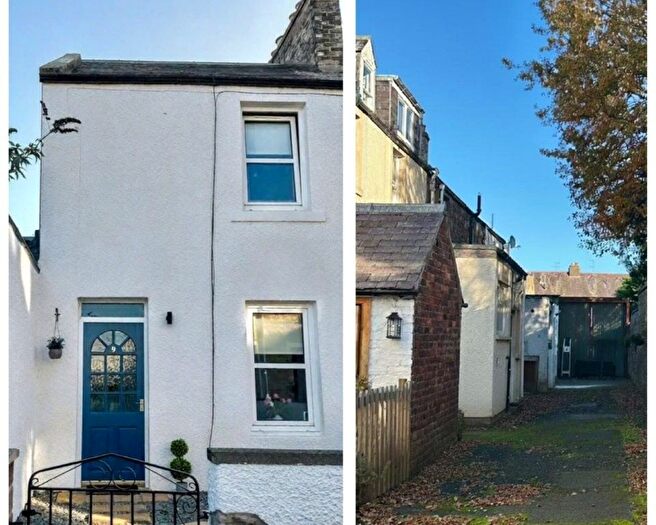
Properties for sale in Jedburgh and District
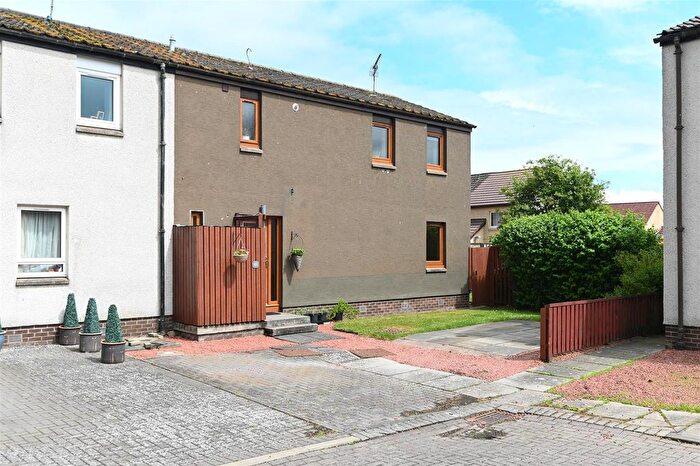
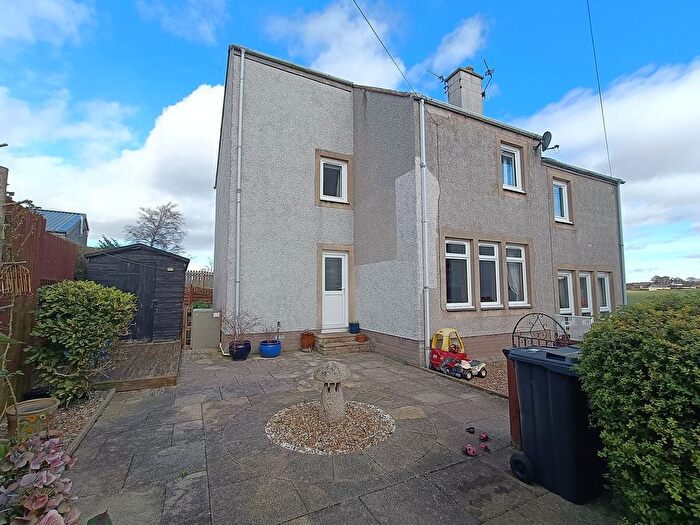
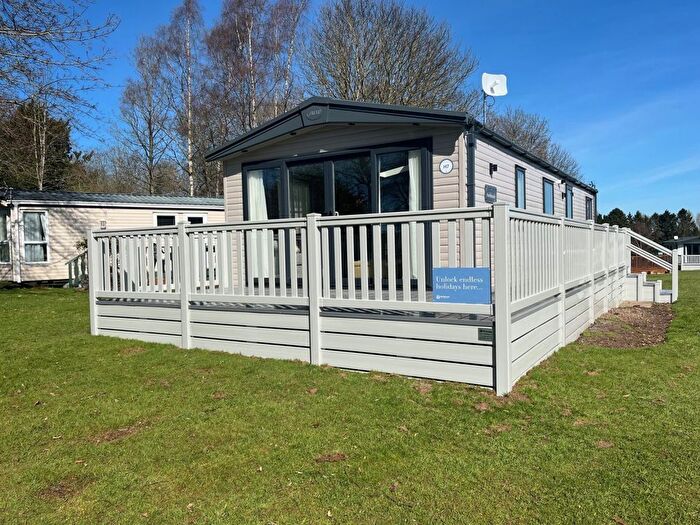
Previously listed properties in Jedburgh and District
![]()
If you are looking to sell your house, let it out, or receive a property valuation, an expert can help you.
Click the button below to get started.

Roads and Postcodes in Jedburgh and District
Navigate through our locations to find the location of your next house in Jedburgh and District, Kelso for sale or to rent.
| Streets | Postcodes |
|---|---|
| Bowmont Court | TD5 8JY |
| Eckford Road | TD5 8LN |
| Ladyrig View | TD5 8JU |
| Main Street | TD5 8JR |
| Roxburgh Road | TD5 8TP |
| Sunlaws Court | TD5 8JT |
| Sunlaws Place | TD5 8JS |
| Teviot Road | TD5 8NE |
| TD5 7PE TD5 8BH TD5 8BQ TD5 8DY TD5 8DZ TD5 8EA TD5 8EB TD5 8JP TD5 8JZ TD5 8LA TD5 8LB TD5 8LD TD5 8LE TD5 8LF TD5 8LG TD5 8LH TD5 8LJ TD5 8LL TD5 8LQ TD5 8LU TD5 8LX TD5 8LY TD5 8LZ TD5 8NA TD5 8NB TD5 8ND TD5 8NF TD5 8NJ TD5 8NL TD5 8NN TD5 8NP TD5 8NR TD5 8NS TD5 8NT TD5 8NW TD5 8PA |
Property price trends in Jedburgh and District
According to the latest Registers of Scotland data, the average home in Jedburgh and District sold for £289,000 in 2025. That figure comes from 226 sales logged over the past 24 years.
Prices have fallen back over the last three years. Compared with 2022, when the typical sale came in around £427,955, that's a fall of roughly 32.5%.
Looking back five years, average prices are down about 12.6% since 2020, a drop of around £41,562 in cash terms.
Zoom out to the past decade for the fuller picture. Back in 2015, homes here averaged £309,300, so the typical sold price has fallen about 6.6% since then, around 0.7% a year lower. Stretch the view to fifteen years and that annual pace edges up closer to 3.6%.
Frequently asked questions about Jedburgh and District
What is the average price for a property for sale in Jedburgh and District?
The average price for a property for sale in Jedburgh and District is £475,500. This amount is 108% higher than the average price in Kelso. There are 223 property listings for sale in Jedburgh and District.
What streets have the most expensive properties for sale in Jedburgh and District?
The streets with the most expensive properties for sale in Jedburgh and District are Bowmont Court at an average of £616,250 and Main Street at an average of £250,000.
What streets have the most affordable properties for sale in Jedburgh and District?
The street with the most affordable properties for sale in Jedburgh and District is Ladyrig View at an average of £138,000.
Which train stations are available in or near Jedburgh and District?
Some of the train stations available in or near Jedburgh and District are Tweedbank, Galashiels and Stow.
Property Price Paid in Jedburgh and District by Year
The average sold property price by year was:
| Year | Average Sold Price | Price Change |
Sold Properties
|
|---|---|---|---|
| 2025 | £289,000 | -64% |
2 Properties |
| 2024 | £475,000 | -39% |
2 Properties |
| 2023 | £662,500 | 35% |
2 Properties |
| 2022 | £427,955 | 13% |
18 Properties |
| 2021 | £373,834 | 12% |
19 Properties |
| 2020 | £330,562 | 31% |
16 Properties |
| 2019 | £229,285 | 38% |
10 Properties |
| 2018 | £142,000 | -114% |
7 Properties |
| 2017 | £304,285 | 22% |
7 Properties |
| 2016 | £236,785 | -31% |
7 Properties |
