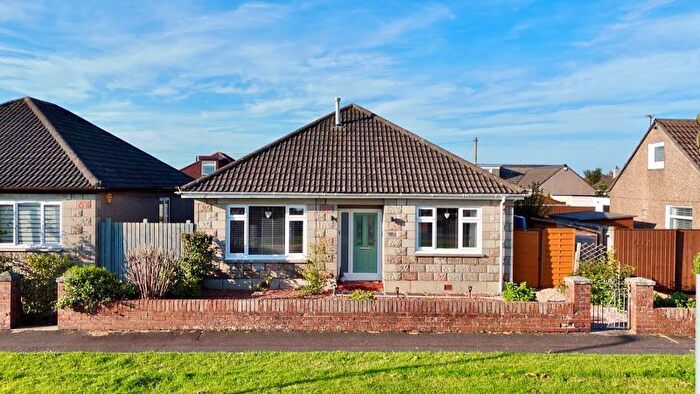
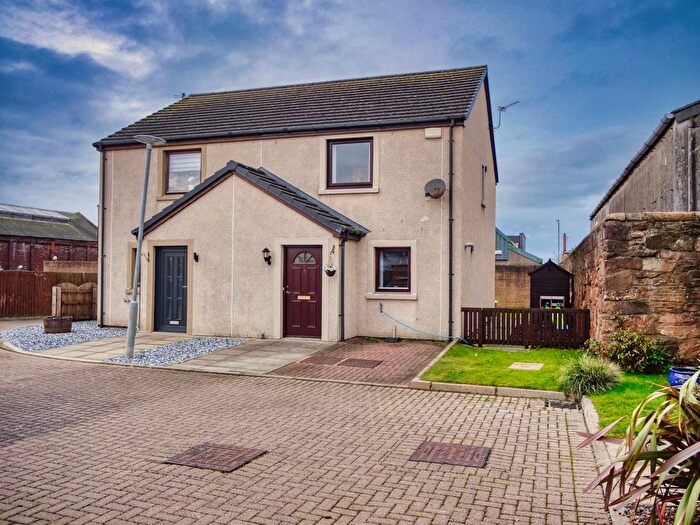
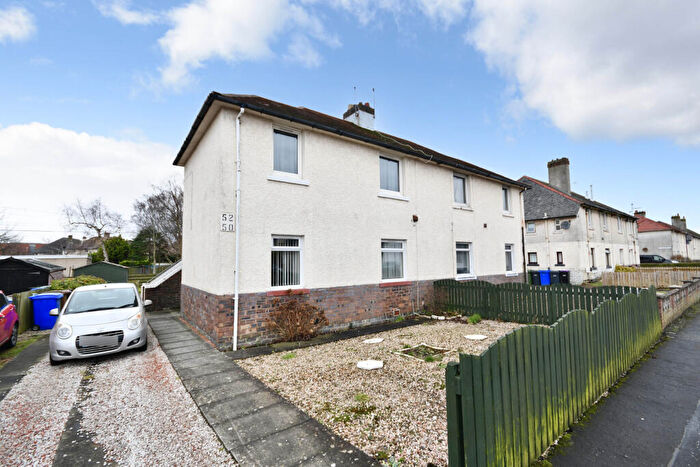
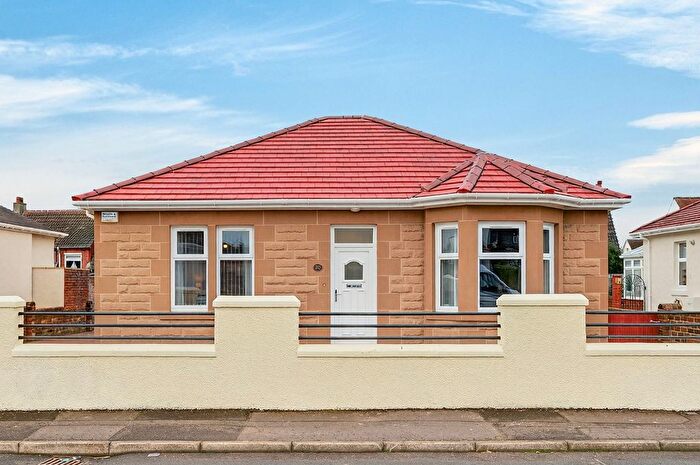
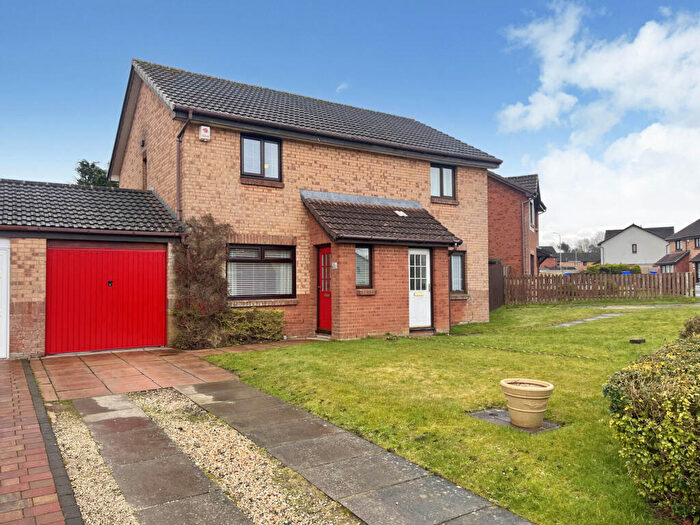
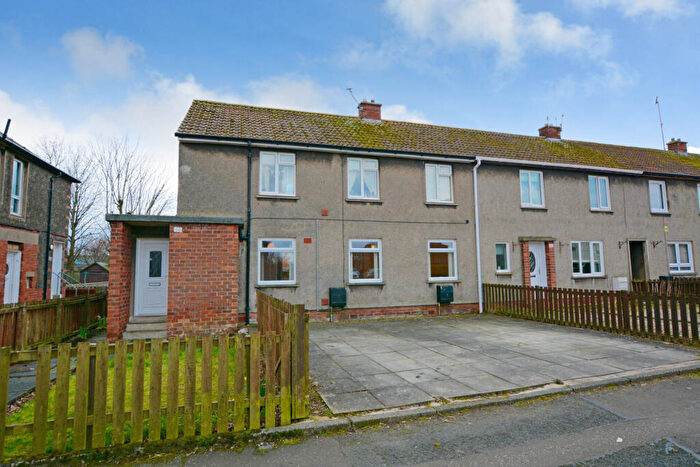
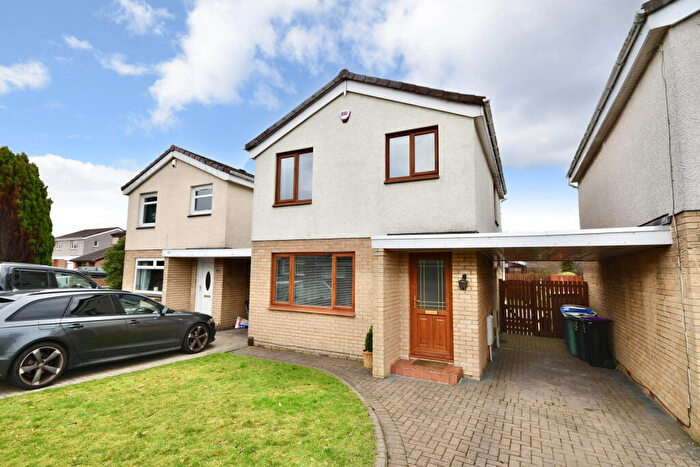
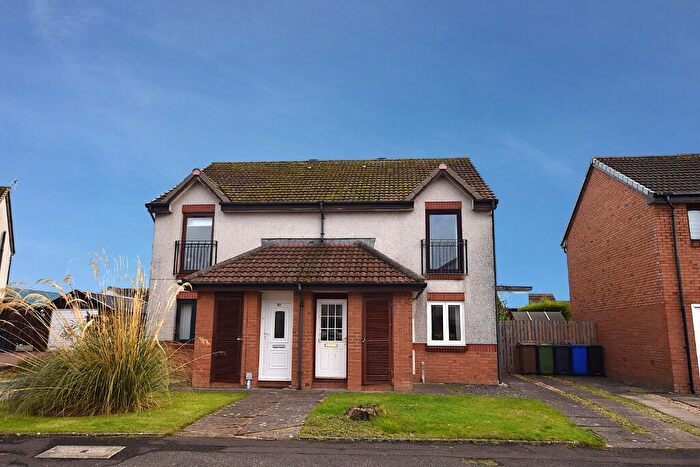
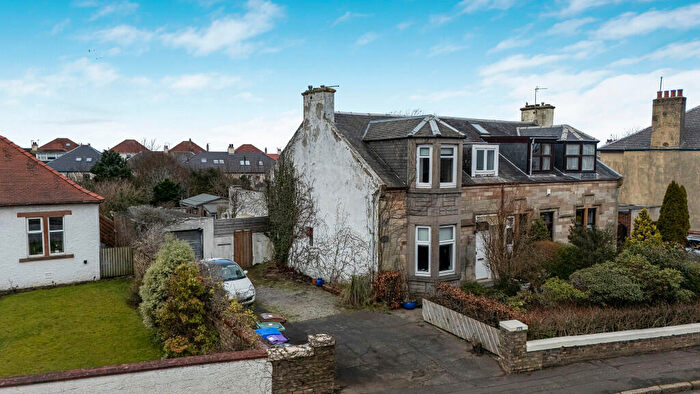
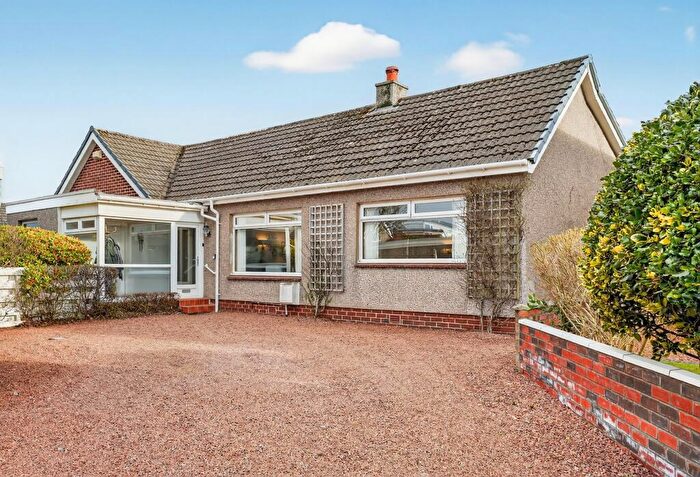
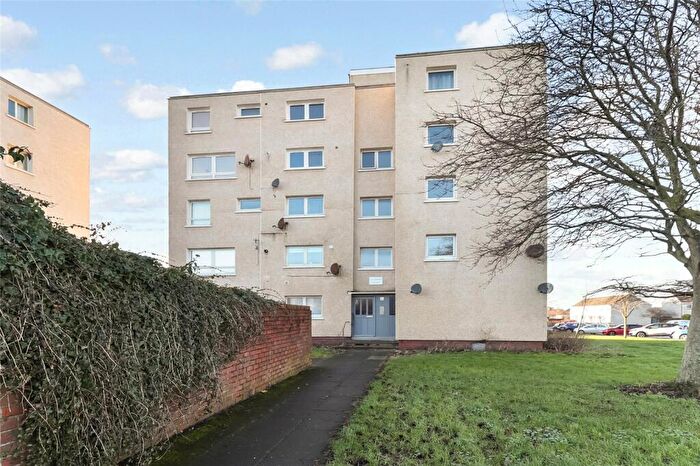
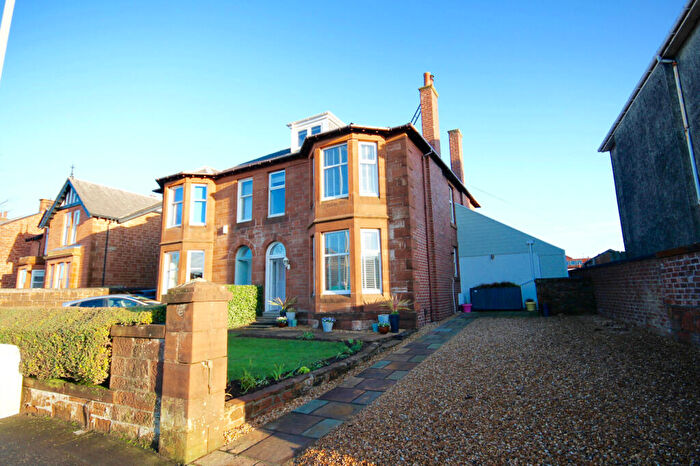
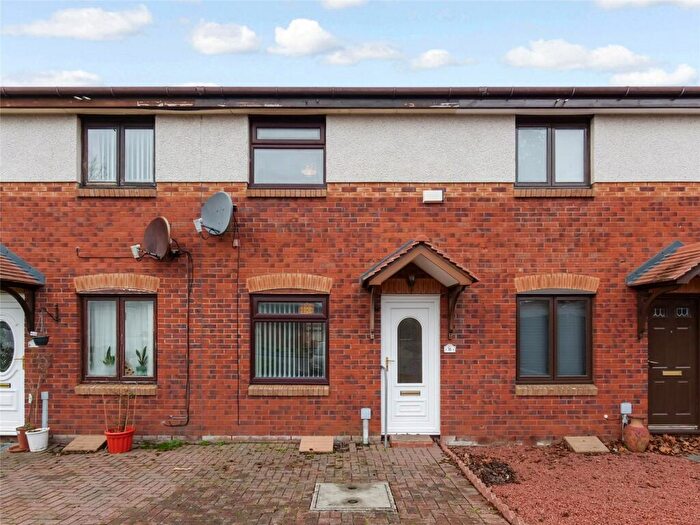
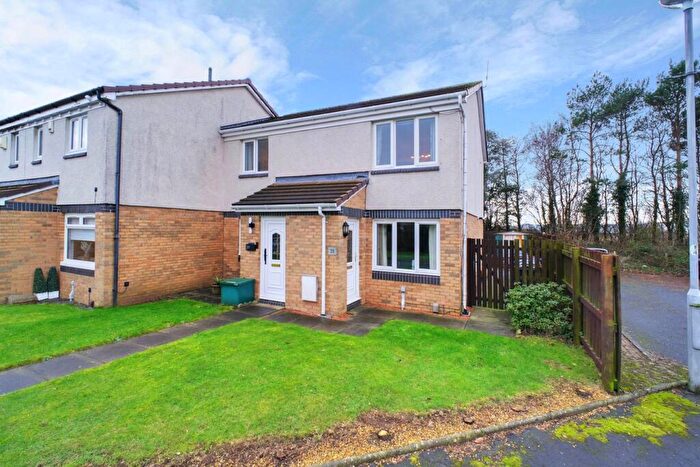
Houses for sale & to rent in Prestwick, Ayr
House Prices in Prestwick
Properties in Prestwick have an average house price of £156,316.00 and had 22 Property Transactions within the last 3 years¹.
Prestwick is an area in Ayr, South Ayrshire with 257 households², where the most expensive property was sold for £265,000.00.
Properties for sale in Prestwick
Previously listed properties in Prestwick
Roads and Postcodes in Prestwick
Navigate through our locations to find the location of your next house in Prestwick, Ayr for sale or to rent.
| Streets | Postcodes |
|---|---|
| Boundary Road | KA8 9DJ KA8 9SN KA8 9SW |
| Callander Road | KA8 9AF |
| East Road | KA8 9BA |
| Englewood Avenue | KA8 9EF |
| Forbes Drive | KA8 9FG |
| Heathfield Road | KA8 9BN KA8 9DR KA8 9DS KA8 9DT KA8 9DU KA8 9DX |
| Heathpark | KA8 9EN |
| Hunters Avenue | KA8 9EG |
| Liberator Drive | KA8 9BF |
| Lorien Court | KA8 9HG |
| Marchfield Road | KA8 8PN |
| Moor Place | KA8 9ER |
| Moor Road | KA8 9EP KA8 9EW |
| Oswald Road | KA8 8NX |
| Prestwick Road | KA8 8NW |
| Wallacetown Drive | KA8 9FH |
| Wheatpark Place | KA8 9RT |
| Young Street | KA8 8PW |
| KA6 5HQ |
Transport near Prestwick
- FAQ
- Price Paid By Year
Frequently asked questions about Prestwick
What is the average price for a property for sale in Prestwick?
The average price for a property for sale in Prestwick is £156,316. This amount is 15% lower than the average price in Ayr. There are 566 property listings for sale in Prestwick.
What streets have the most expensive properties for sale in Prestwick?
The streets with the most expensive properties for sale in Prestwick are Englewood Avenue at an average of £249,000, Heathpark at an average of £185,000 and Moor Road at an average of £182,142.
What streets have the most affordable properties for sale in Prestwick?
The streets with the most affordable properties for sale in Prestwick are Prestwick Road at an average of £73,125, Lorien Court at an average of £81,000 and Young Street at an average of £104,949.
Which train stations are available in or near Prestwick?
Some of the train stations available in or near Prestwick are Newton-On-Ayr, Prestwick and Ayr.
Property Price Paid in Prestwick by Year
The average sold property price by year was:
| Year | Average Sold Price | Price Change |
Sold Properties
|
|---|---|---|---|
| 2025 | £190,691 | 33% |
6 Properties |
| 2024 | £128,525 | -31% |
10 Properties |
| 2023 | £168,260 | 10% |
6 Properties |
| 2022 | £151,562 | -5% |
8 Properties |
| 2021 | £159,816 | 21% |
18 Properties |
| 2020 | £127,025 | 1% |
8 Properties |
| 2019 | £126,004 | -32% |
11 Properties |
| 2018 | £166,566 | 20% |
31 Properties |
| 2017 | £132,960 | 13% |
23 Properties |
| 2016 | £115,192 | 5% |
13 Properties |
| 2015 | £109,028 | 1% |
6 Properties |
| 2014 | £108,218 | 1% |
11 Properties |
| 2013 | £107,181 | 9% |
11 Properties |
| 2012 | £97,670 | -18% |
10 Properties |
| 2011 | £115,021 | 17% |
18 Properties |
| 2010 | £95,190 | -31% |
11 Properties |
| 2009 | £124,513 | 8% |
11 Properties |
| 2008 | £114,775 | -4% |
9 Properties |
| 2007 | £118,807 | -132% |
15 Properties |
| 2006 | £275,831 | 60% |
13 Properties |
| 2005 | £109,392 | -29% |
14 Properties |
| 2004 | £140,788 | 57% |
13 Properties |
| 2003 | £60,467 | -5013,8% |
25 Properties |
| 2002 | £3,092,150 | 97% |
10 Properties |
| 2001 | £79,125 | - |
1 Property |

