
Houses for sale & to rent in Ayr, South Ayrshire
House Prices in Ayr
Properties in Ayr have an average house price of £185k and had 1,888 Property Transactions within the last 3 years.¹
Ayr is an area in South Ayrshire with 25,303 households², where the most expensive property was sold for £1.25M.
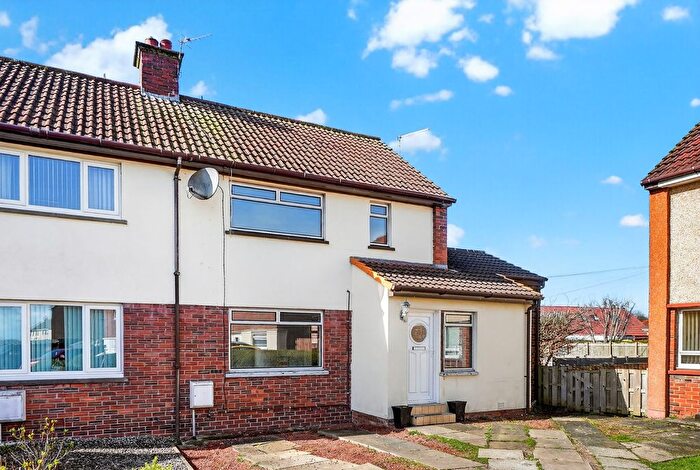
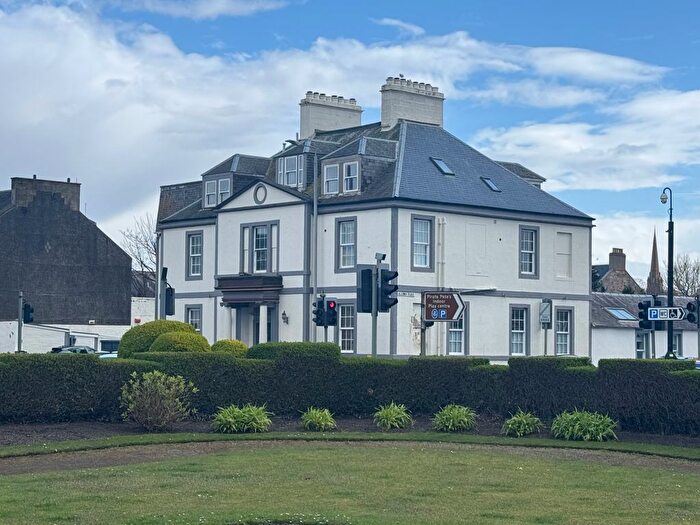
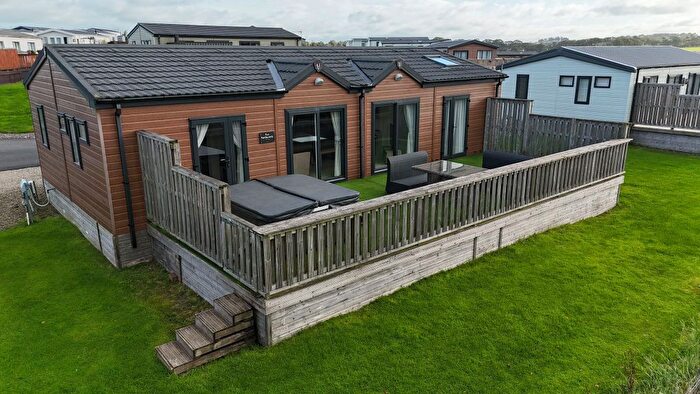
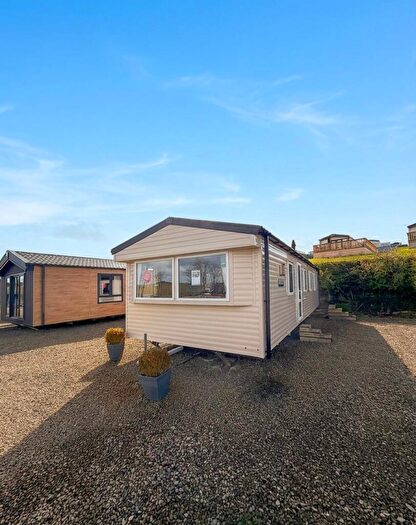
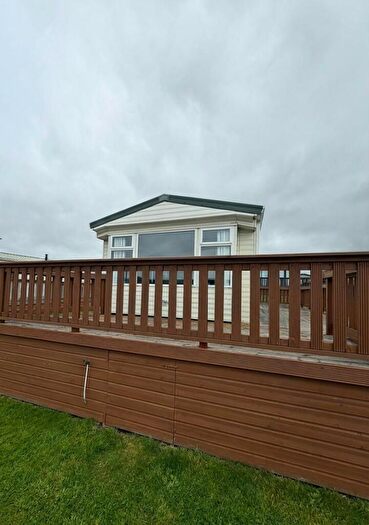
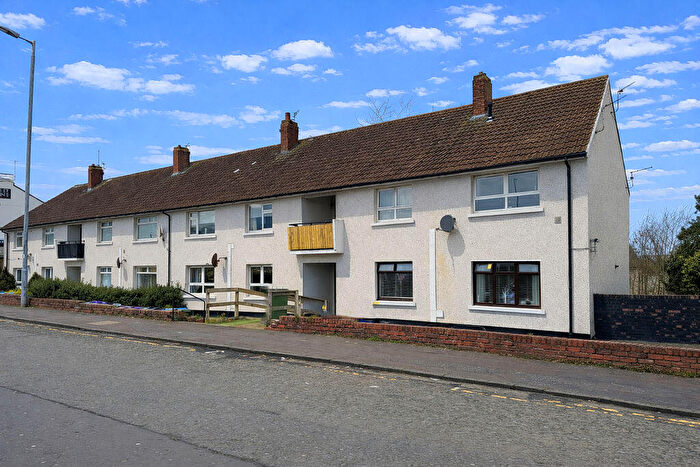
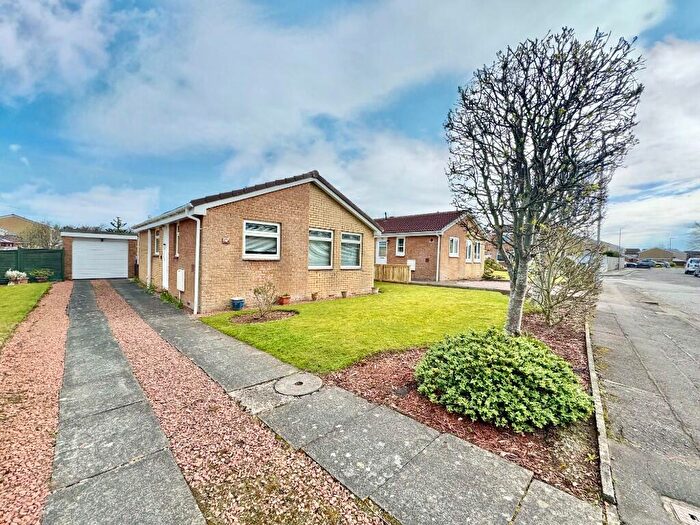
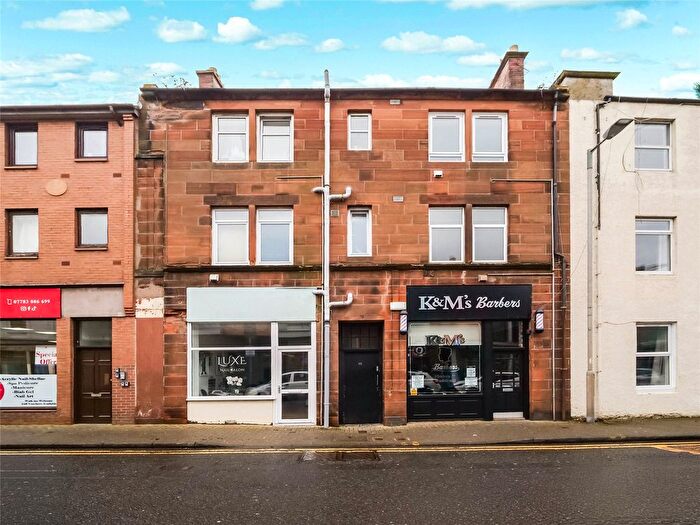
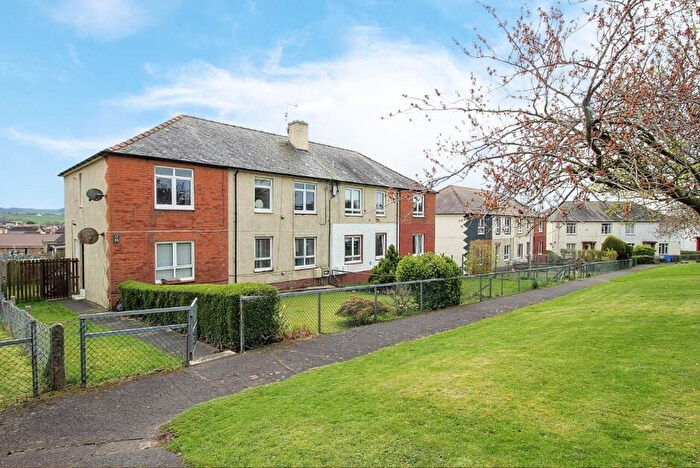
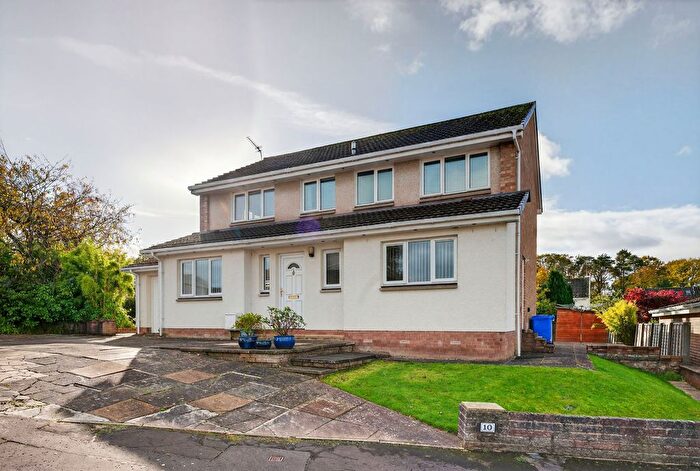
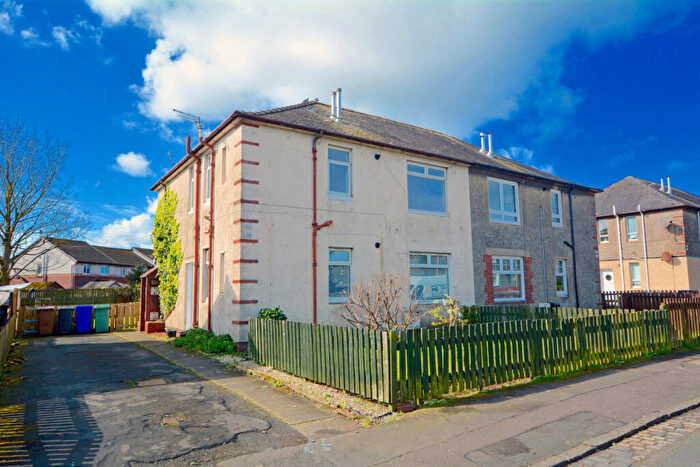
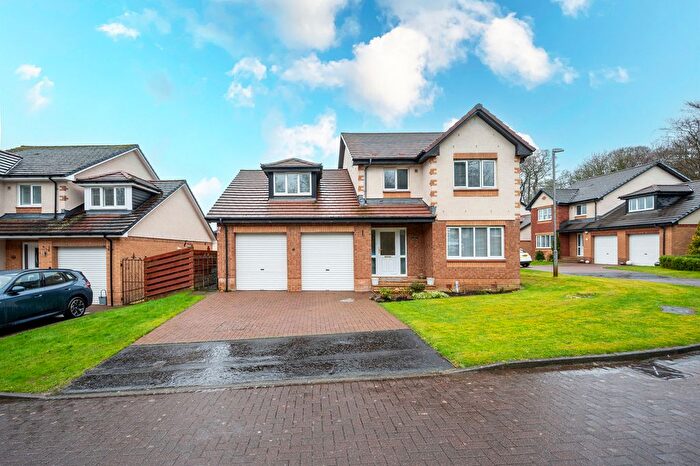
Properties for sale in Ayr


![]()
If you are looking to sell your house, let it out, or receive a property valuation, an expert can help you.
Click the button below to get started.

Neighbourhoods in Ayr
Navigate through our locations to find the location of your next house in Ayr, South Ayrshire for sale or to rent.
Transport in Ayr
Please see below transportation links in this area:

- FAQ
- Price Paid By Year
Frequently asked questions about Ayr
What is the average price for a property for sale in Ayr?
The average price for a property for sale in Ayr is £184,618. This amount is 0.47% lower than the average price in South Ayrshire. There are 4,562 property listings for sale in Ayr.
What locations have the most expensive properties for sale in Ayr?
The locations with the most expensive properties for sale in Ayr are Ayr West at an average of £259,898, Maybole, North Carrick and Coylton at an average of £183,269 and Ayr East at an average of £168,885.
What locations have the most affordable properties for sale in Ayr?
The locations with the most affordable properties for sale in Ayr are Ayr North at an average of £115,621, Kyle at an average of £136,092 and Prestwick at an average of £156,316.
Which train stations are available in or near Ayr?
Some of the train stations available in or near Ayr are Ayr, Newton-On-Ayr and Prestwick.
Property Price Paid in Ayr by Year
The average sold property price by year was:
| Year | Average Sold Price | Price Change |
Sold Properties
|
|---|---|---|---|
| 2025 | £186,554 | 5% |
600 Properties |
| 2024 | £177,049 | -7% |
638 Properties |
| 2023 | £190,260 | 1% |
650 Properties |
| 2022 | £189,242 | 1% |
1,081 Properties |
| 2021 | £187,002 | 4% |
1,252 Properties |
| 2020 | £179,918 | 17% |
962 Properties |
| 2019 | £148,538 | -13% |
1,087 Properties |
| 2018 | £167,378 | 9% |
1,180 Properties |
| 2017 | £153,076 | 0,1% |
1,113 Properties |
| 2016 | £152,963 | 0,2% |
1,072 Properties |
| 2015 | £152,725 | -0,1% |
1,000 Properties |
| 2014 | £152,864 | -1% |
1,038 Properties |
| 2013 | £154,488 | 7% |
916 Properties |
| 2012 | £143,960 | -5% |
833 Properties |
| 2011 | £151,201 | -15% |
845 Properties |
| 2010 | £174,425 | 12% |
845 Properties |
| 2009 | £152,626 | -1% |
853 Properties |
| 2008 | £153,855 | -15% |
1,096 Properties |
| 2007 | £176,363 | 9% |
1,659 Properties |
| 2006 | £160,110 | -0,4% |
1,503 Properties |
| 2005 | £160,755 | 16% |
1,665 Properties |
| 2004 | £134,994 | 17% |
1,562 Properties |
| 2003 | £112,519 | -21% |
1,726 Properties |
| 2002 | £135,800 | 28% |
1,615 Properties |
| 2001 | £98,263 | - |
129 Properties |