
Houses for sale & to rent in Girvan and South Carrick, Girvan
House Prices in Girvan and South Carrick
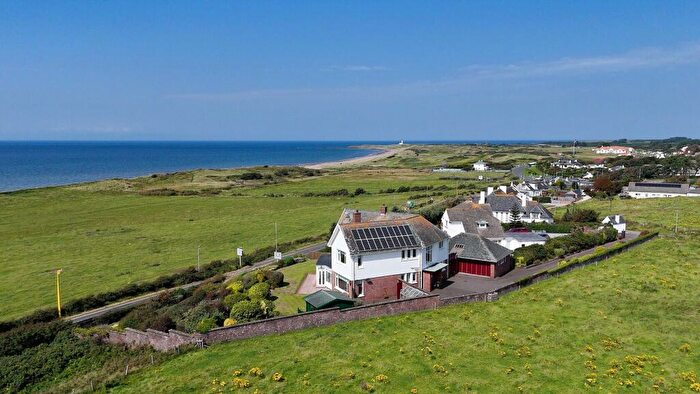
Properties in Girvan and South Carrick have an average house price of £157,396.00 and had 203 Property Transactions within the last 3 years¹.
Girvan and South Carrick is an area in Girvan, South Ayrshire with 4,951 households², where the most expensive property was sold for £3,100,000.00.
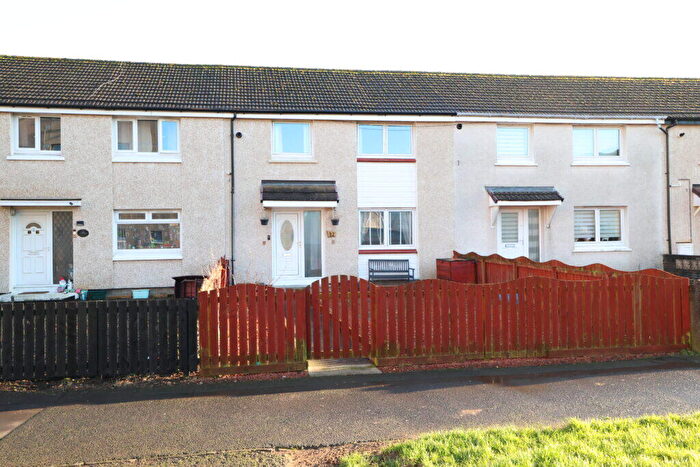
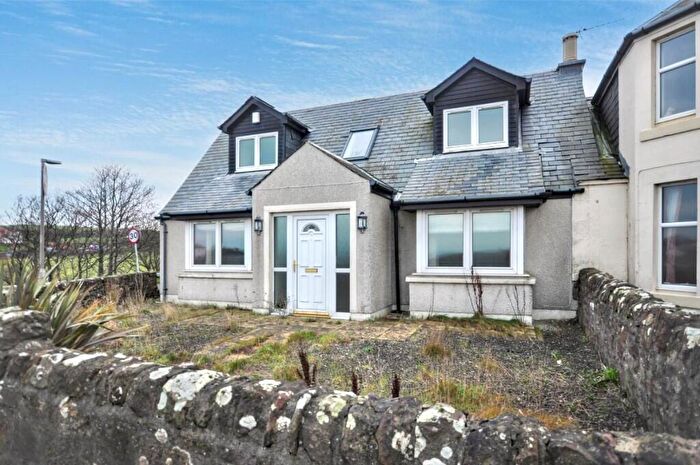
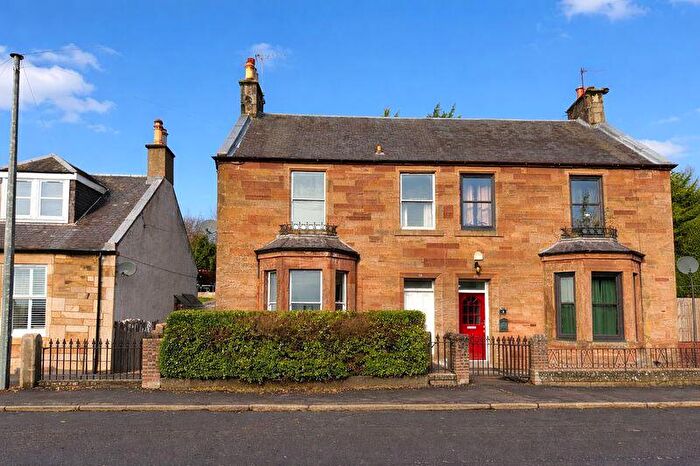
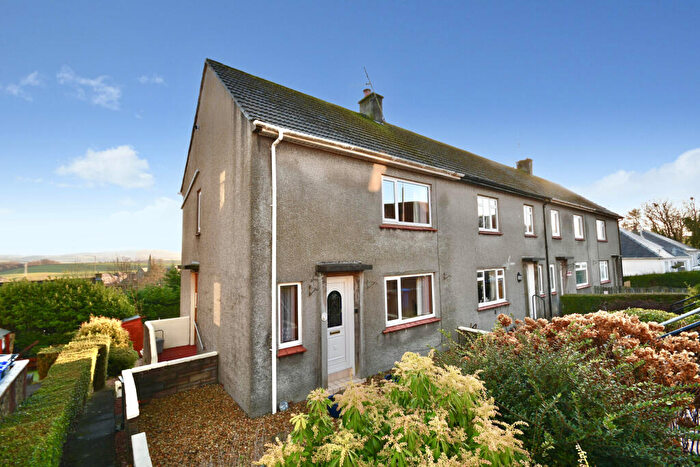
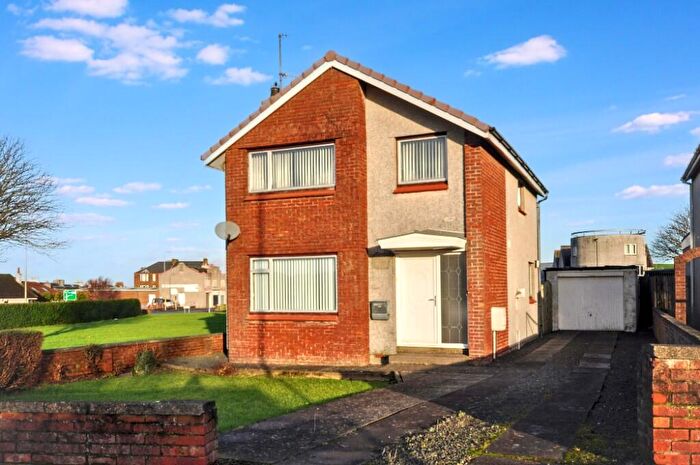
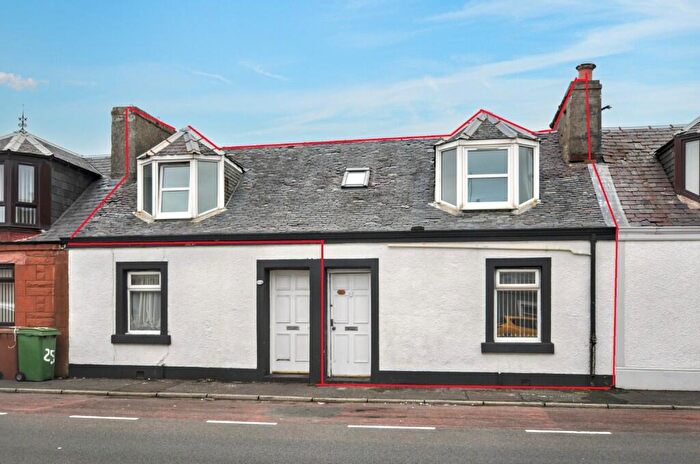
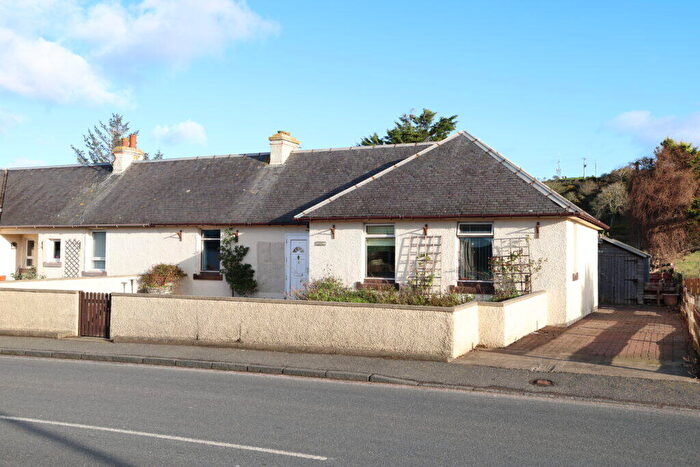
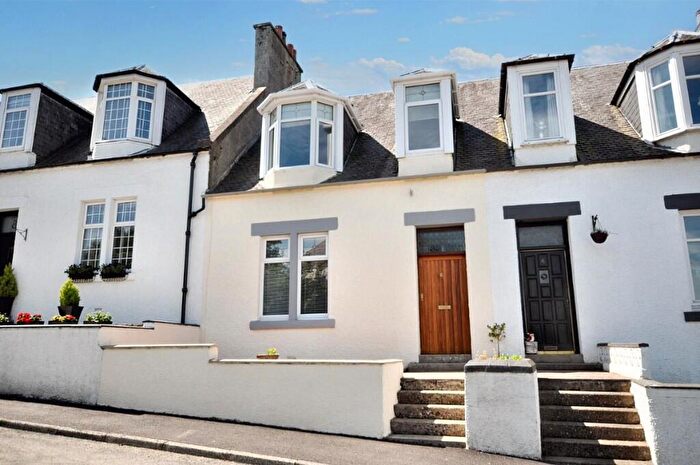
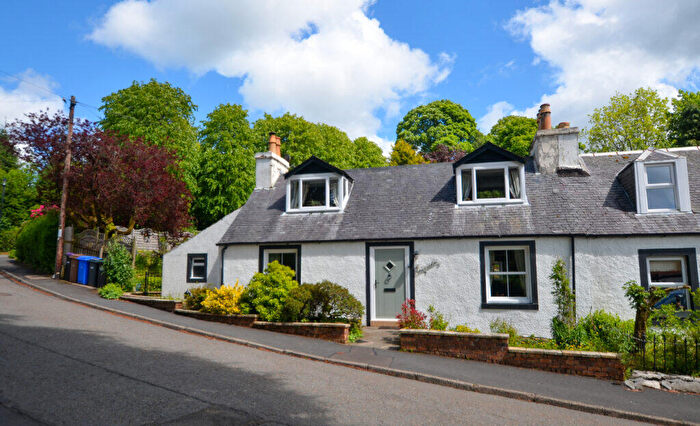
Properties for sale in Girvan and South Carrick

![]()
If you are looking to sell your house, let it out, or receive a property valuation, an expert can help you.
Click the button below to get started.
Roads and Postcodes in Girvan and South Carrick
Navigate through our locations to find the location of your next house in Girvan and South Carrick, Girvan for sale or to rent.
Transport near Girvan and South Carrick

- FAQ
- Price Paid By Year
Frequently asked questions about Girvan and South Carrick
What is the average price for a property for sale in Girvan and South Carrick?
The average price for a property for sale in Girvan and South Carrick is £157,396. There are 1,017 property listings for sale in Girvan and South Carrick.
Which train stations are available in or near Girvan and South Carrick?
Some of the train stations available in or near Girvan and South Carrick are Girvan, Barrhill and Maybole.
Property Price Paid in Girvan and South Carrick by Year
The average sold property price by year was:
| Year | Average Sold Price | Price Change |
Sold Properties
|
|---|---|---|---|
| 2023 | £212,234 | 31% |
36 Properties |
| 2022 | £145,575 | -3% |
167 Properties |
| 2021 | £149,704 | 19% |
190 Properties |
| 2020 | £121,451 | 6% |
139 Properties |
| 2019 | £114,113 | -3% |
179 Properties |
| 2018 | £117,955 | 8% |
163 Properties |
| 2017 | £109,007 | 6% |
182 Properties |
| 2016 | £102,448 | 1% |
197 Properties |
| 2015 | £101,221 | -8% |
142 Properties |
| 2014 | £109,116 | 4% |
162 Properties |
| 2013 | £104,888 | -7% |
118 Properties |
| 2012 | £112,669 | -15% |
116 Properties |
| 2011 | £129,519 | 25% |
102 Properties |
| 2010 | £97,061 | -4% |
115 Properties |
| 2009 | £100,926 | -3% |
129 Properties |
| 2008 | £103,635 | -25% |
161 Properties |
| 2007 | £129,854 | -7% |
234 Properties |
| 2006 | £139,159 | 37% |
254 Properties |
| 2005 | £87,020 | -7% |
232 Properties |
| 2004 | £92,953 | -260% |
238 Properties |
| 2003 | £334,488 | 84% |
258 Properties |
| 2002 | £52,121 | -24% |
248 Properties |
| 2001 | £64,555 | - |
20 Properties |