
Houses for sale & to rent in Girvan, South Ayrshire
House Prices in Girvan
Properties in Girvan have an average house price of £141k and had 271 Property Transactions within the last 3 years.¹
Girvan is an area in South Ayrshire with 4,951 households², where the most expensive property was sold for £3.1M.
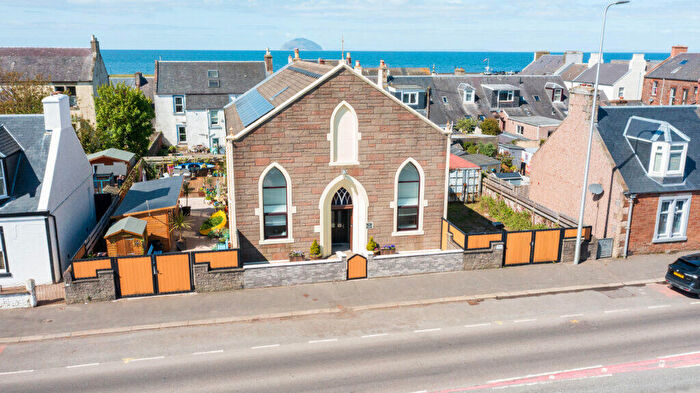
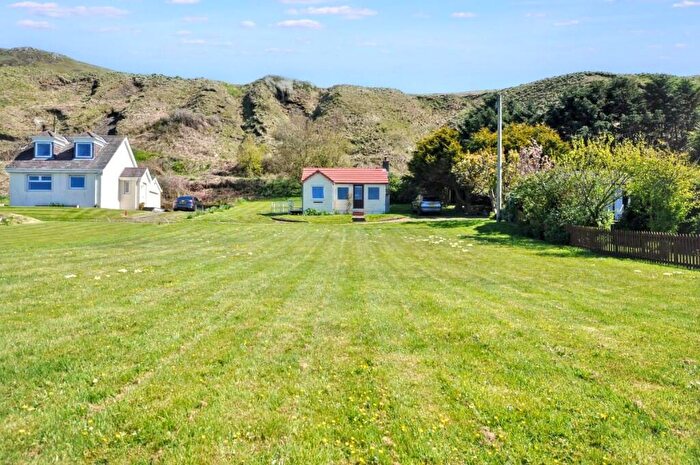
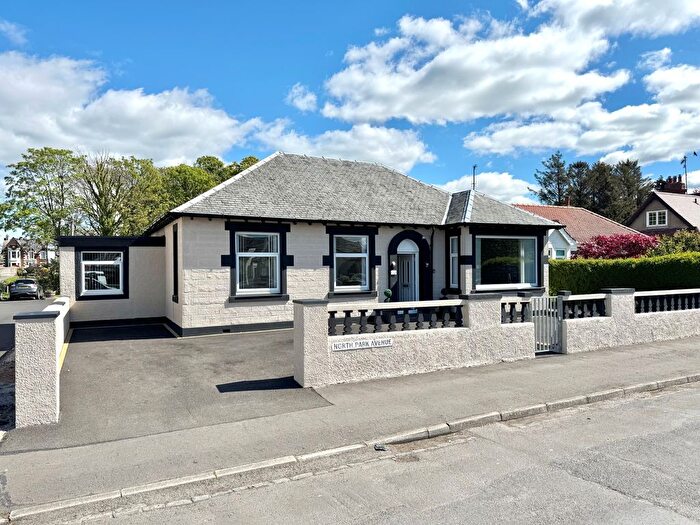
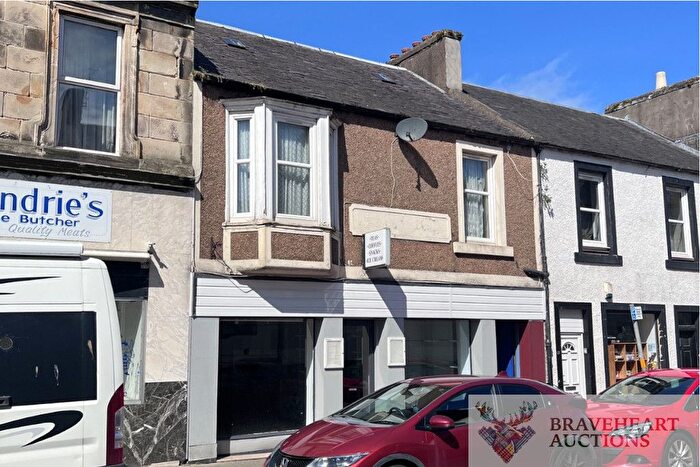
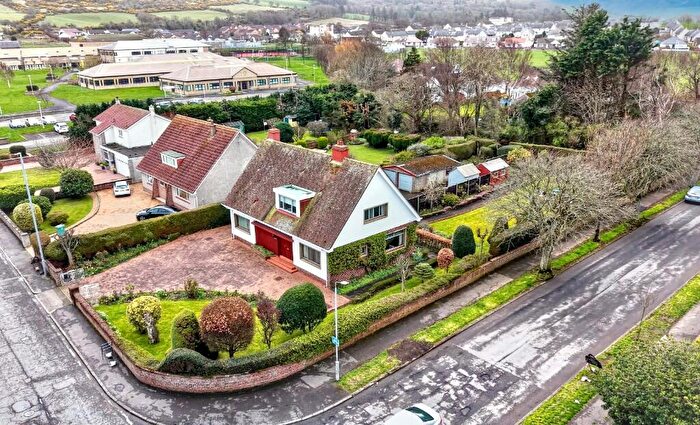
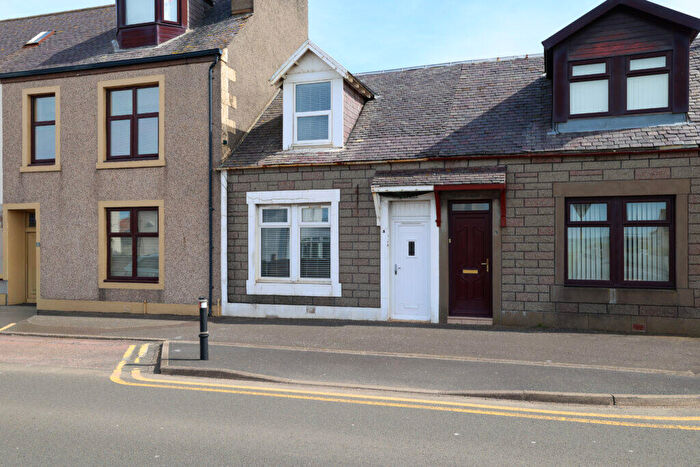
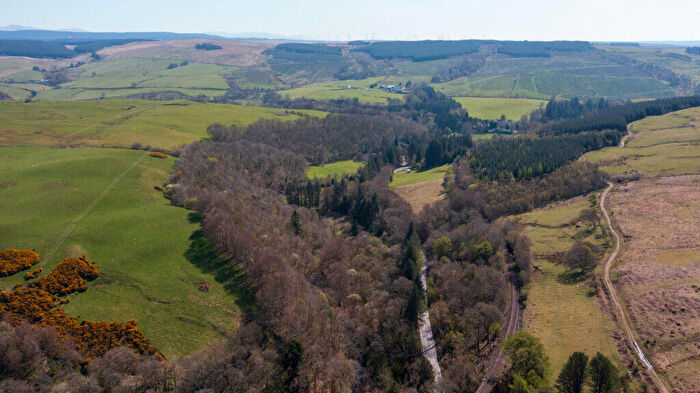
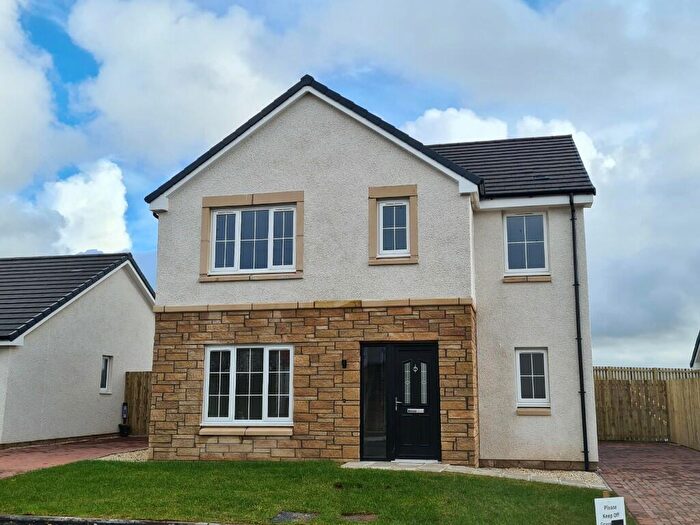
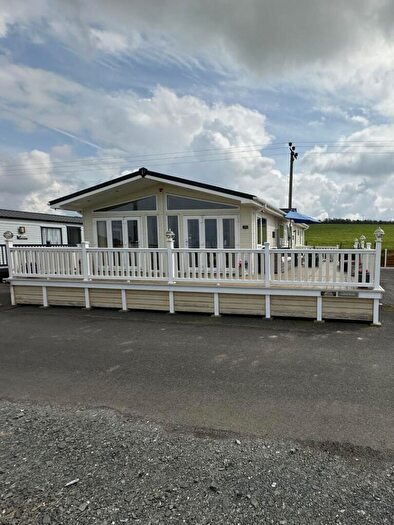
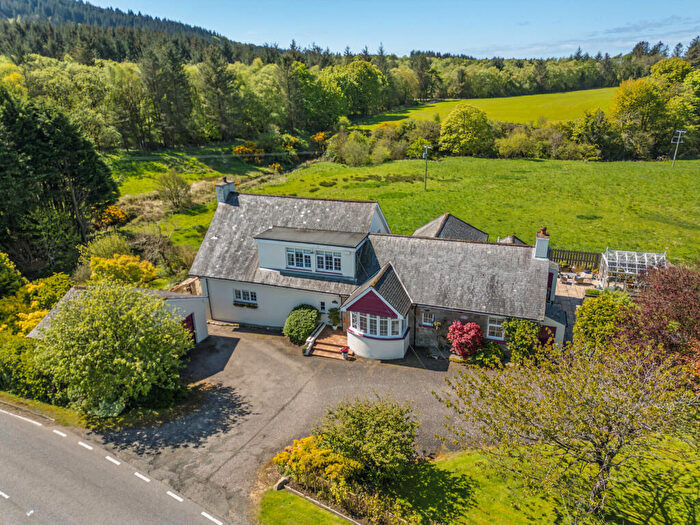
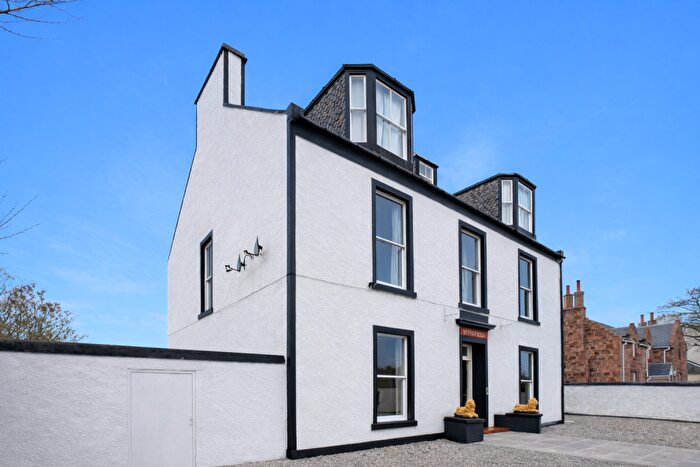
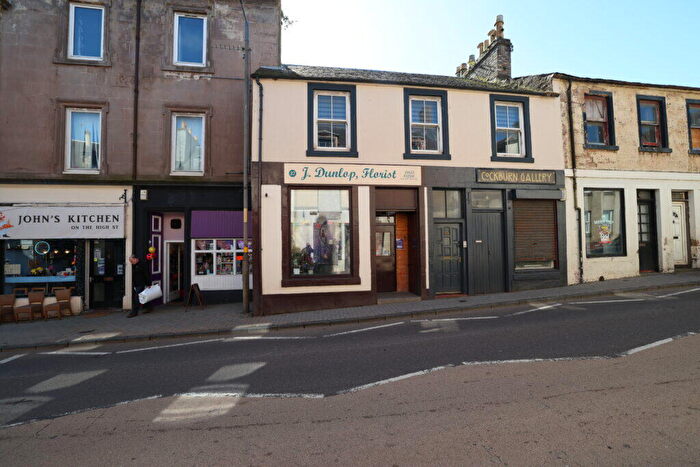
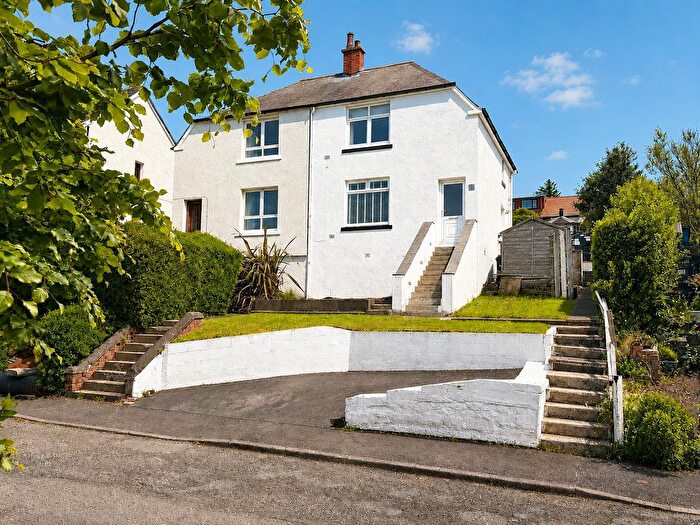
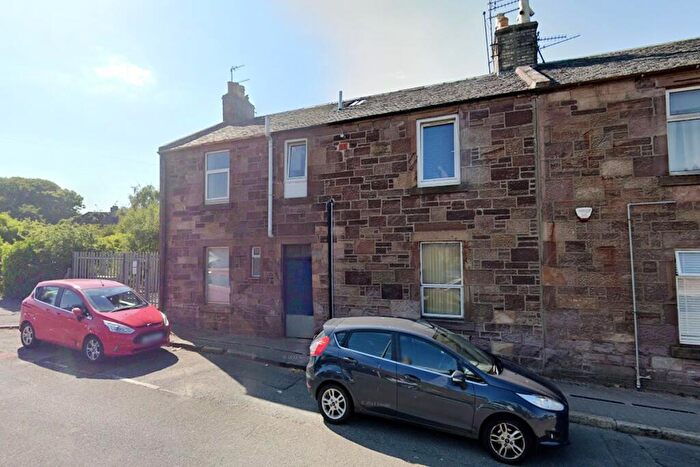
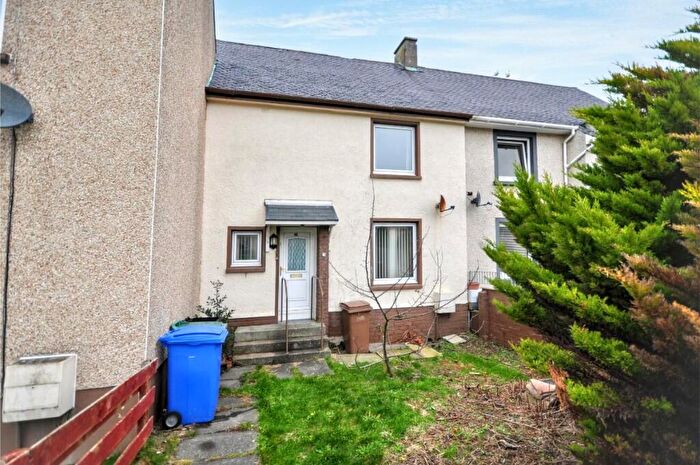
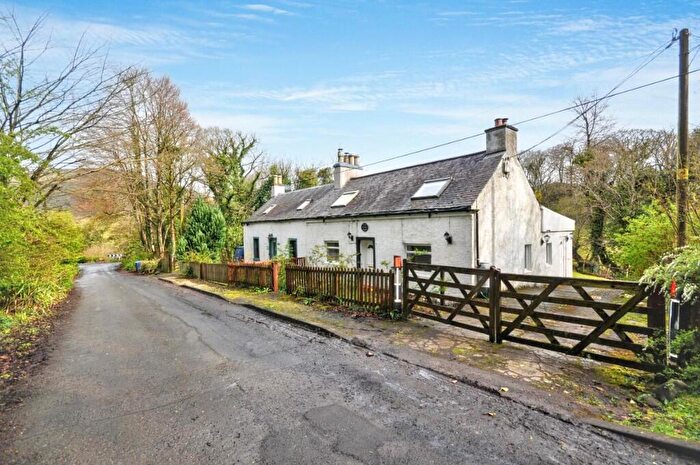
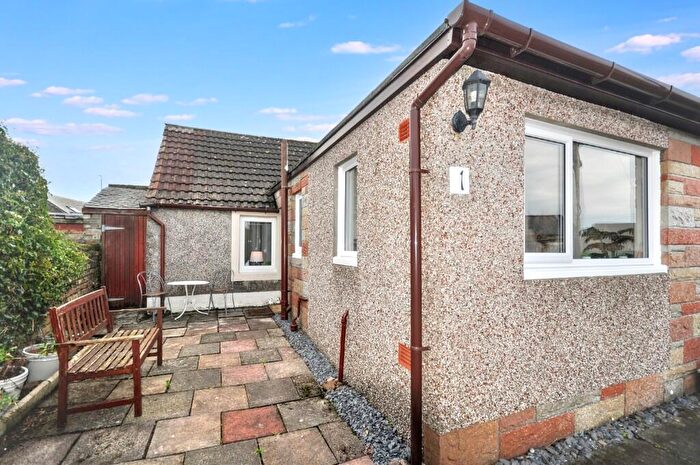
Properties for sale in Girvan
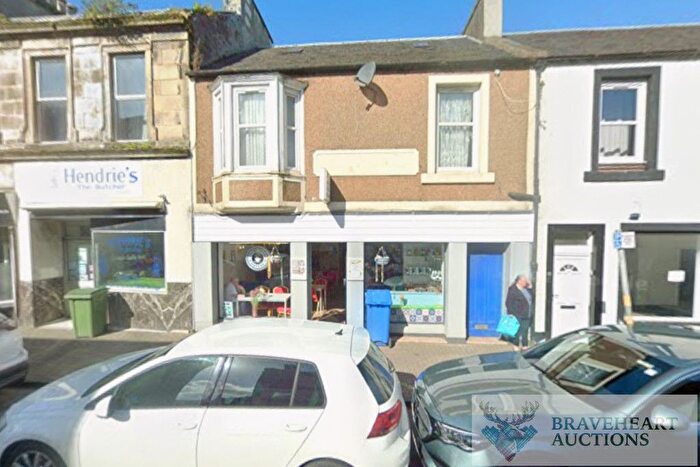
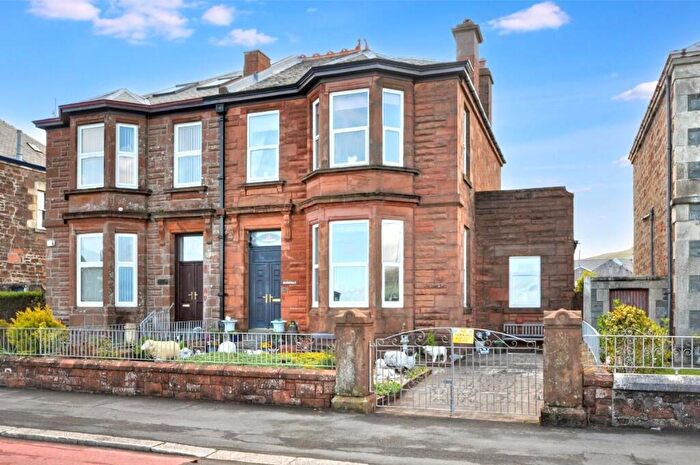
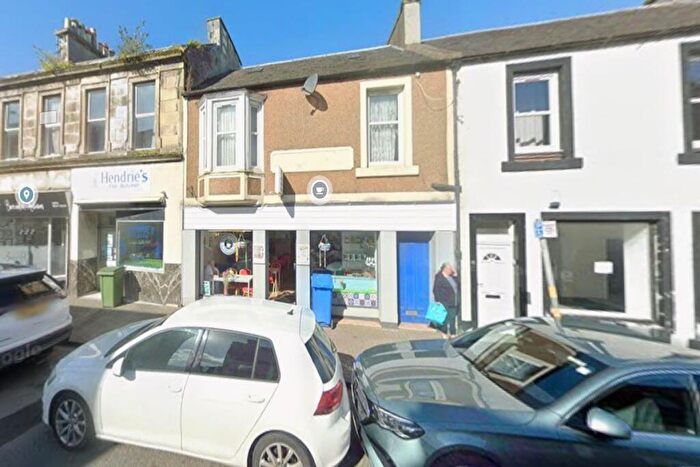
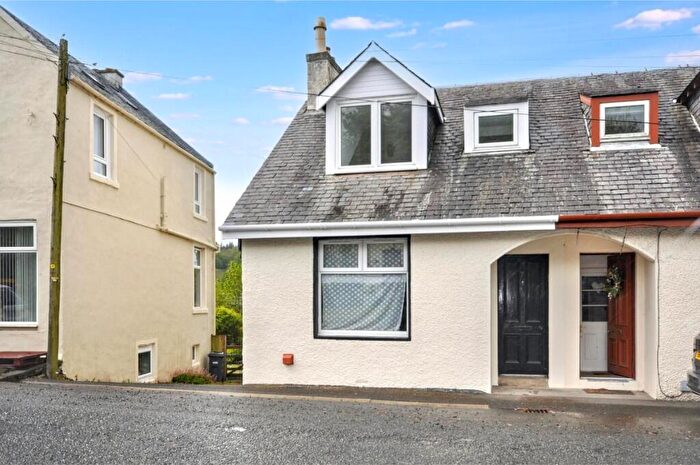
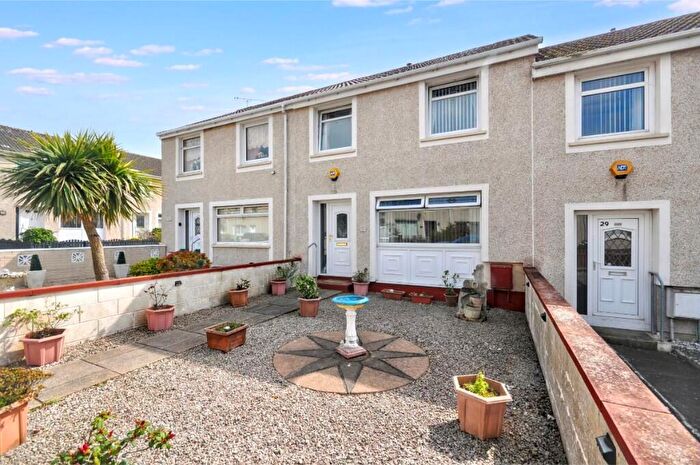
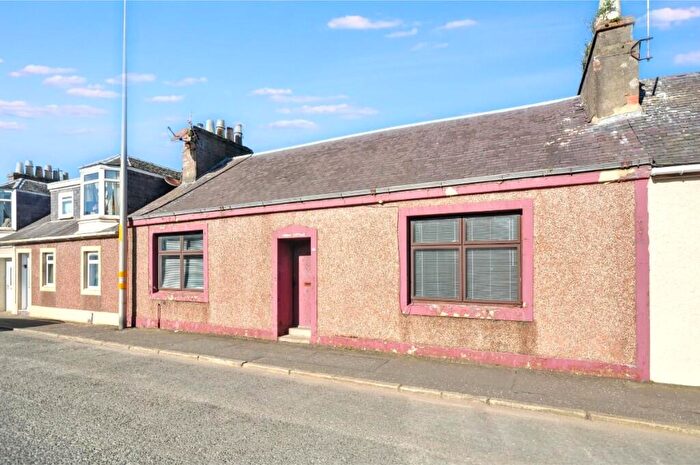
![]()
If you are looking to sell your house, let it out, or receive a property valuation, an expert can help you.
Click the button below to get started.

Neighbourhoods in Girvan
Navigate through our locations to find the location of your next house in Girvan, South Ayrshire for sale or to rent.
Transport in Girvan
Please see below transportation links in this area:

- FAQ
- Price Paid By Year
Frequently asked questions about Girvan
What is the average price for a property for sale in Girvan?
The average price for a property for sale in Girvan is £140,541. This amount is 24% lower than the average price in South Ayrshire. There are 1,031 property listings for sale in Girvan.
Which train stations are available in or near Girvan?
Some of the train stations available in or near Girvan are Girvan, Barrhill and Maybole.
Property Price Paid in Girvan by Year
The average sold property price by year was:
| Year | Average Sold Price | Price Change |
Sold Properties
|
|---|---|---|---|
| 2025 | £137,631 | 0,2% |
94 Properties |
| 2024 | £137,318 | -6% |
71 Properties |
| 2023 | £145,281 | 1% |
106 Properties |
| 2022 | £143,952 | -5% |
171 Properties |
| 2021 | £151,074 | 21% |
194 Properties |
| 2020 | £119,599 | 4% |
143 Properties |
| 2019 | £115,038 | -2% |
181 Properties |
| 2018 | £117,572 | 3% |
164 Properties |
| 2017 | £113,699 | 12% |
190 Properties |
| 2016 | £100,325 | - |
221 Properties |
| 2015 | £100,373 | -10% |
151 Properties |
| 2014 | £110,164 | 6% |
166 Properties |
| 2013 | £103,205 | -9% |
124 Properties |
| 2012 | £112,132 | -18% |
118 Properties |
| 2011 | £132,484 | 26% |
109 Properties |
| 2010 | £97,938 | -4% |
121 Properties |
| 2009 | £102,026 | -0,2% |
132 Properties |
| 2008 | £102,247 | -28% |
179 Properties |
| 2007 | £130,366 | -7% |
271 Properties |
| 2006 | £138,843 | 38% |
274 Properties |
| 2005 | £86,473 | -9% |
238 Properties |
| 2004 | £94,642 | -250% |
245 Properties |
| 2003 | £331,021 | 84% |
262 Properties |
| 2002 | £51,855 | -32% |
252 Properties |
| 2001 | £68,528 | - |
21 Properties |