
Houses for sale & to rent in Biggar, South Lanarkshire
House Prices in Biggar
Properties in Biggar have an average house price of £218k and had 174 Property Transactions within the last 3 years.¹
Biggar is an area in South Lanarkshire with 3,066 households², where the most expensive property was sold for £625k.
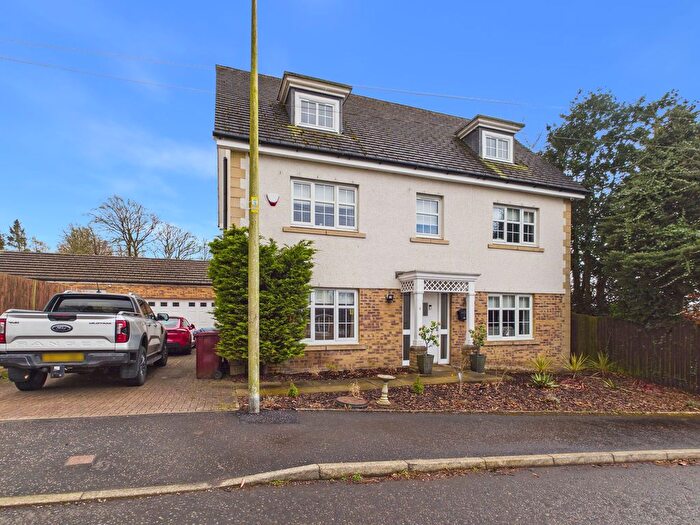
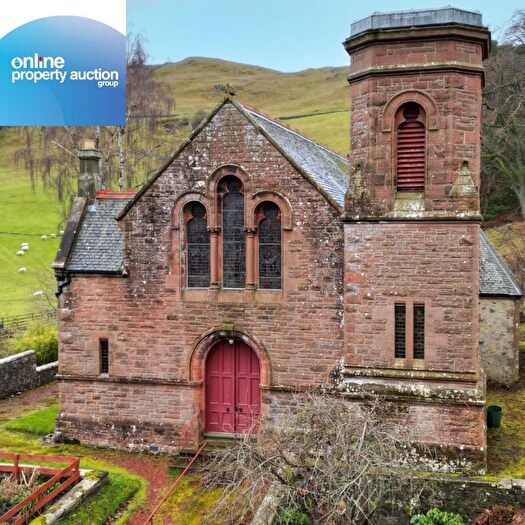
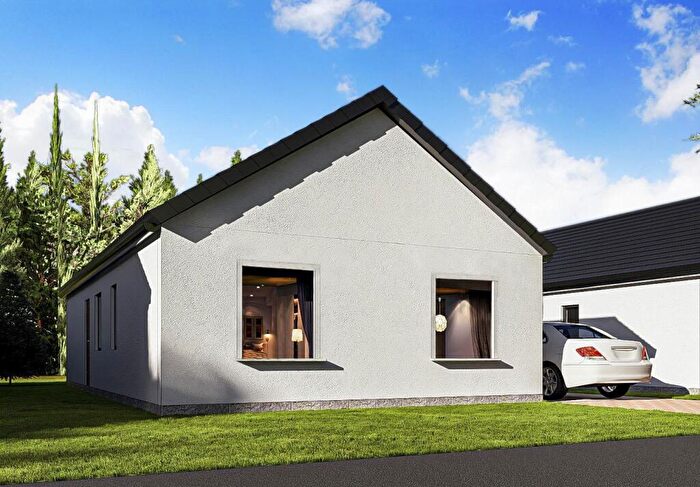
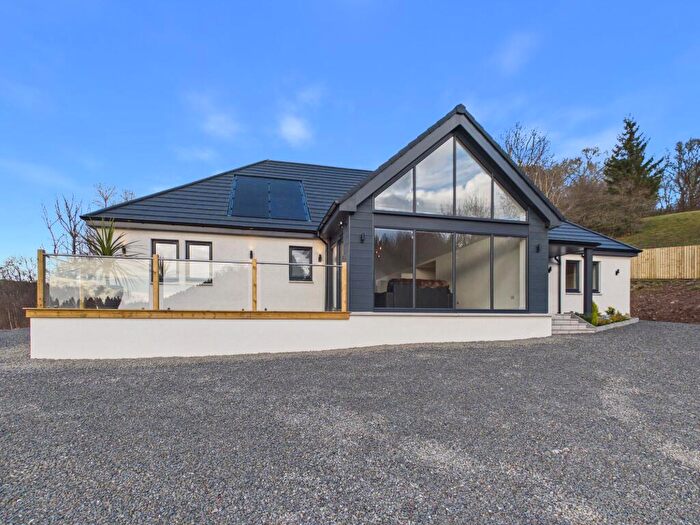
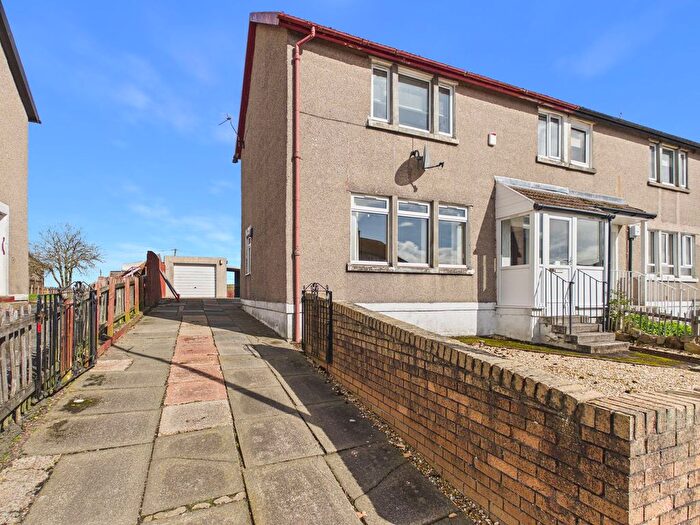
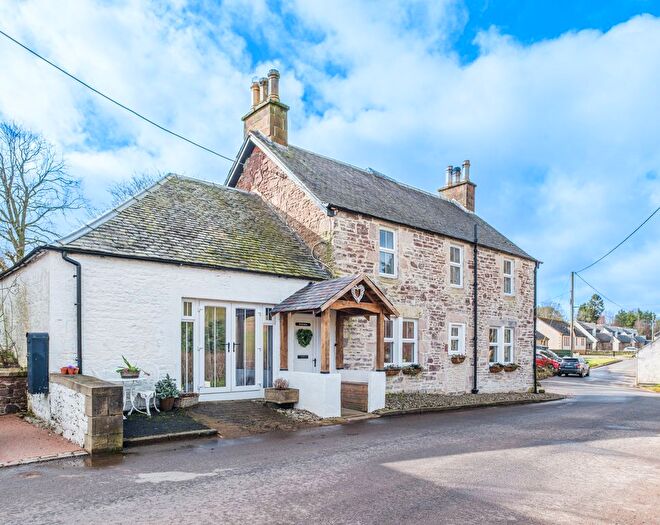
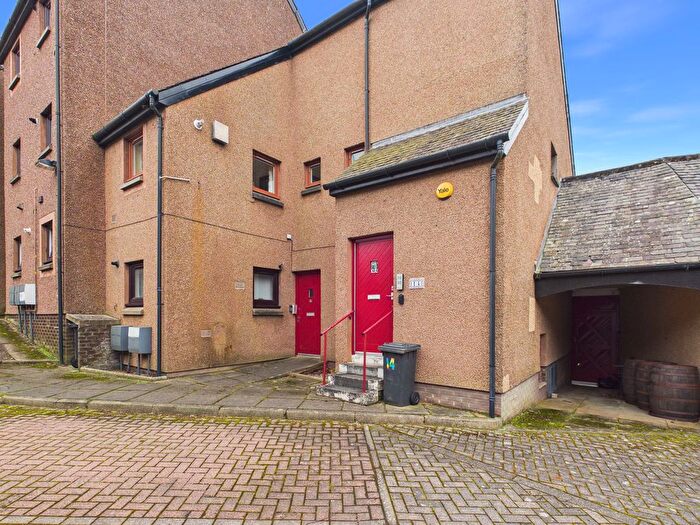
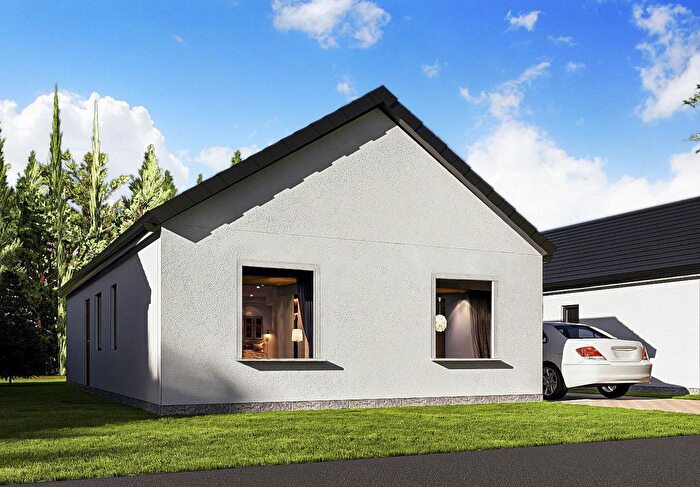
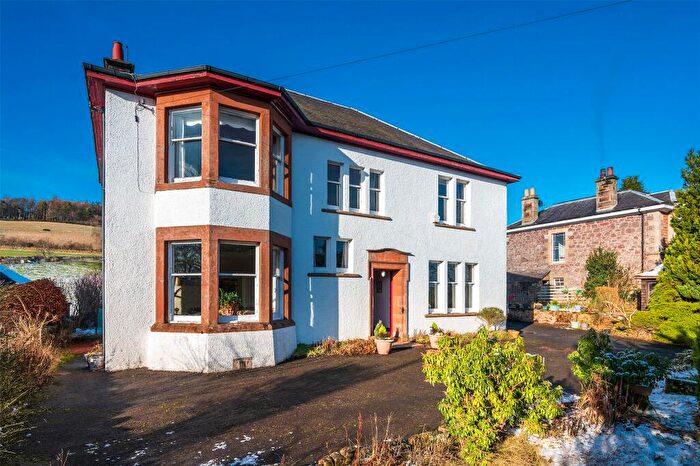
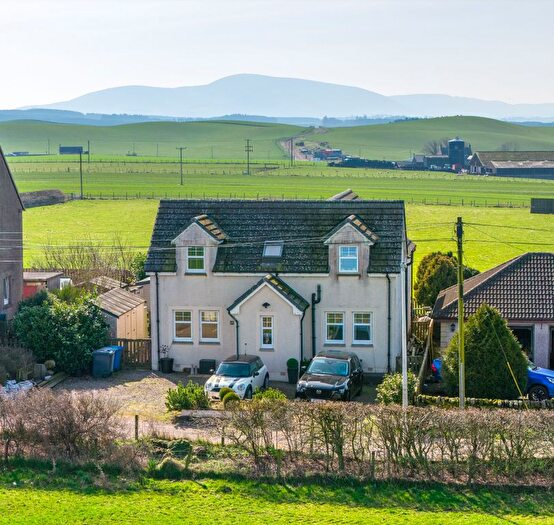
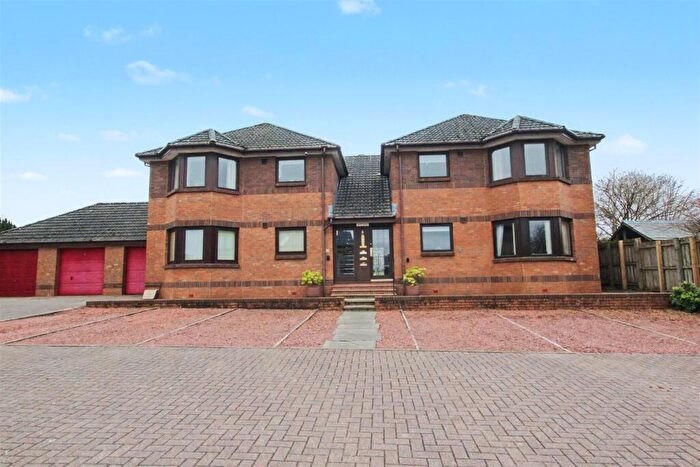
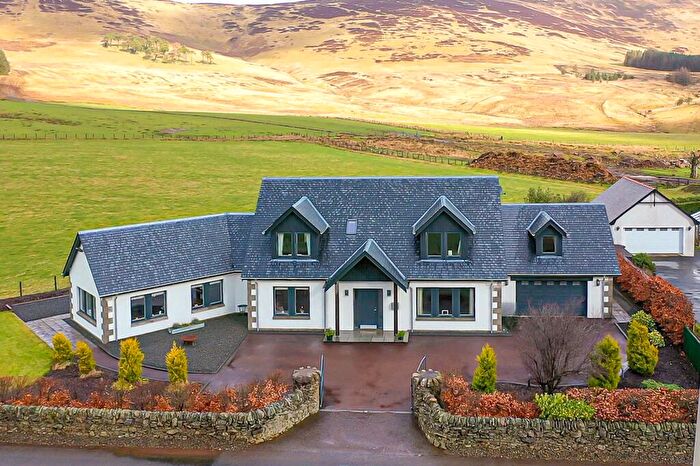
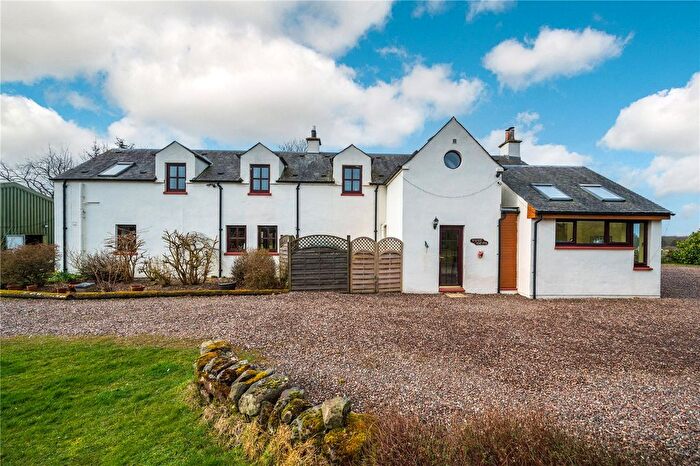
Properties for sale in Biggar
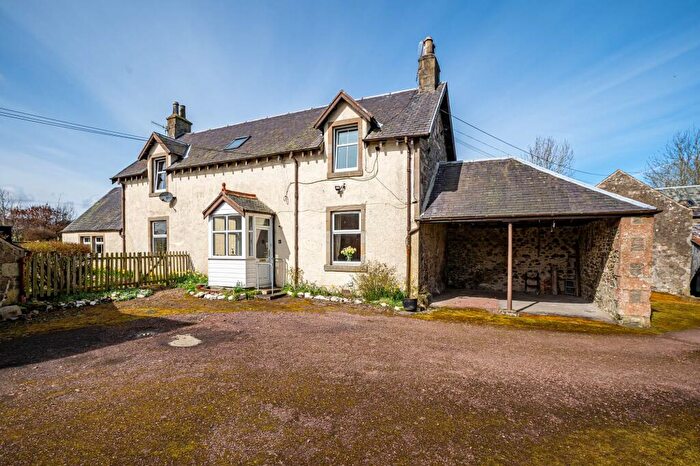

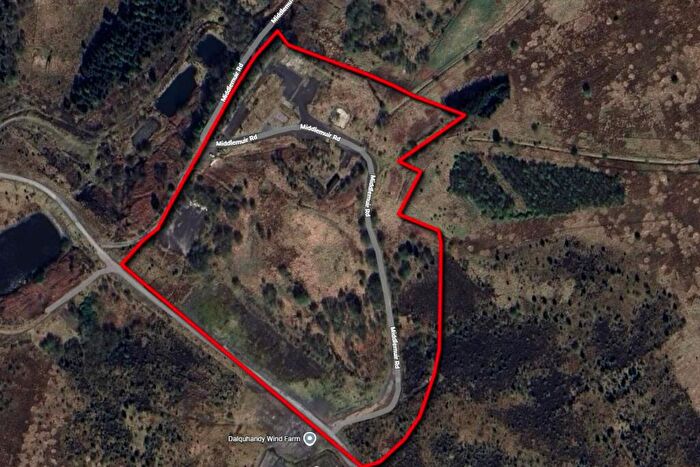
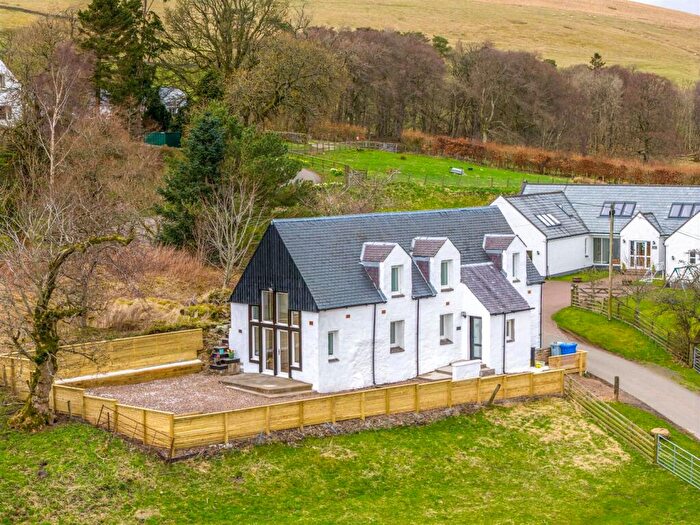
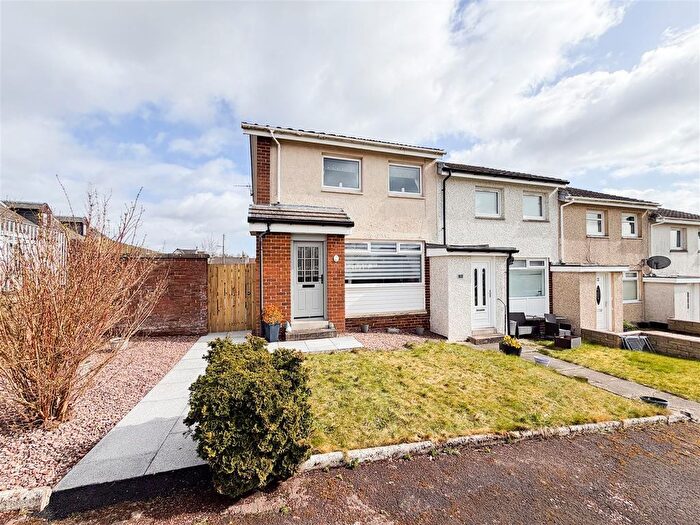
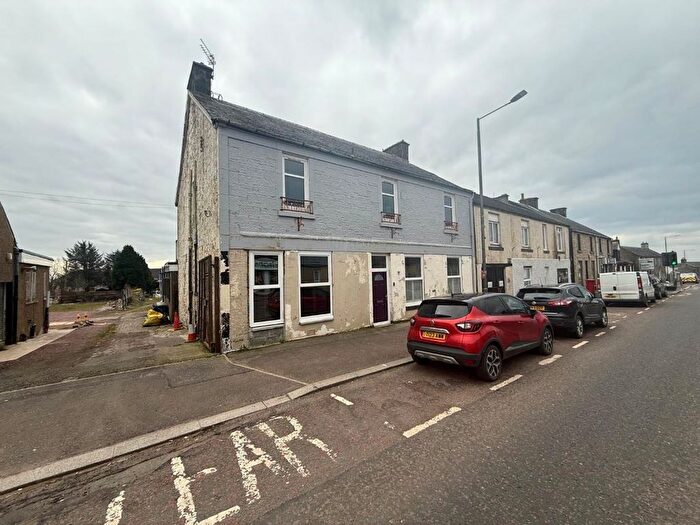
![]()
If you are looking to sell your house, let it out, or receive a property valuation, an expert can help you.
Click the button below to get started.


Neighbourhoods in Biggar
Navigate through our locations to find the location of your next house in Biggar, South Lanarkshire for sale or to rent.
Transport in Biggar
Please see below transportation links in this area:

- FAQ
- Price Paid By Year
Frequently asked questions about Biggar
What is the average price for a property for sale in Biggar?
The average price for a property for sale in Biggar is £218,260. This amount is 21% higher than the average price in South Lanarkshire. There are 1,824 property listings for sale in Biggar.
Which train stations are available in or near Biggar?
Some of the train stations available in or near Biggar are Carstairs, Lanark and Carluke.
Property Price Paid in Biggar by Year
The average sold property price by year was:
| Year | Average Sold Price | Price Change |
Sold Properties
|
|---|---|---|---|
| 2025 | £233,959 | 15% |
54 Properties |
| 2024 | £198,993 | -12% |
57 Properties |
| 2023 | £222,236 | -9% |
63 Properties |
| 2022 | £241,563 | 4% |
191 Properties |
| 2021 | £231,725 | 13% |
211 Properties |
| 2020 | £202,164 | -1% |
165 Properties |
| 2019 | £203,853 | 3% |
154 Properties |
| 2018 | £197,483 | 3% |
150 Properties |
| 2017 | £190,702 | 0,5% |
191 Properties |
| 2016 | £189,836 | 5% |
167 Properties |
| 2015 | £180,563 | 13% |
161 Properties |
| 2014 | £157,591 | 3% |
126 Properties |
| 2013 | £153,200 | -16% |
103 Properties |
| 2012 | £177,051 | -11% |
121 Properties |
| 2011 | £196,584 | 12% |
100 Properties |
| 2010 | £172,572 | 9% |
90 Properties |
| 2009 | £157,704 | -15% |
86 Properties |
| 2008 | £180,866 | 0,4% |
142 Properties |
| 2007 | £180,130 | 17% |
160 Properties |
| 2006 | £148,741 | 15% |
176 Properties |
| 2005 | £126,893 | -4% |
157 Properties |
| 2004 | £132,349 | 18% |
171 Properties |
| 2003 | £108,608 | 28% |
206 Properties |
| 2002 | £77,979 | -73% |
165 Properties |
| 2001 | £134,574 | - |
9 Properties |