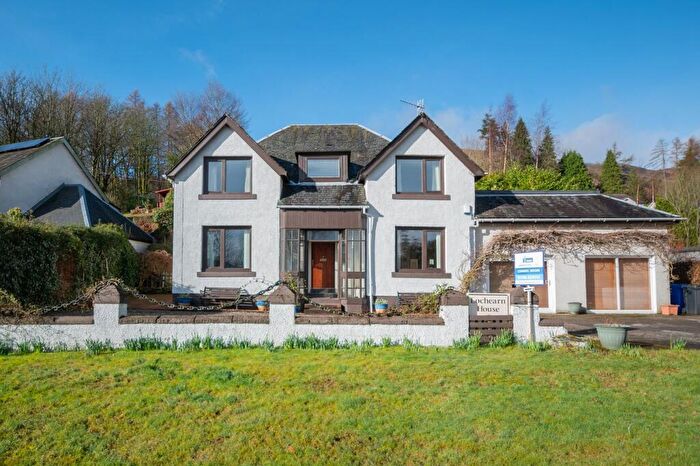
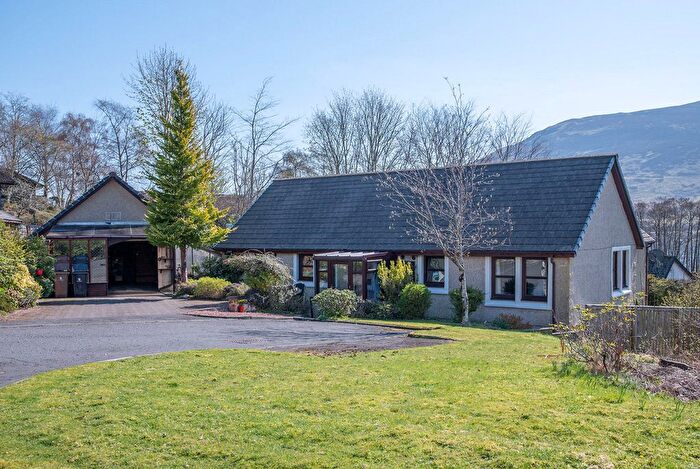
Houses for sale & to rent in Trossachs and Teith, Lochearnhead
House Prices in Trossachs and Teith
Properties in Trossachs and Teith have an average house price of £390,000.00 and had 1 Property Transaction within the last 3 years¹.
Trossachs and Teith is an area in Lochearnhead, Stirling with 234 households², where the most expensive property was sold for £390,000.00.
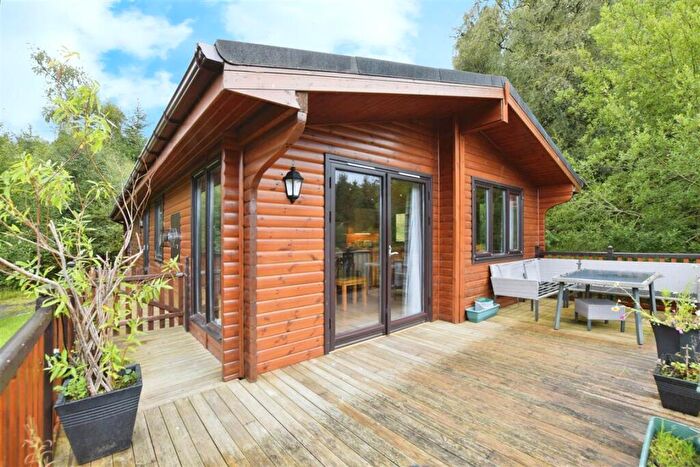
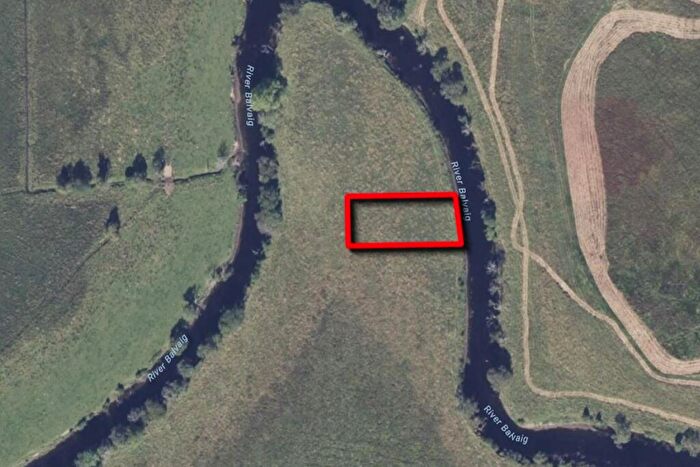
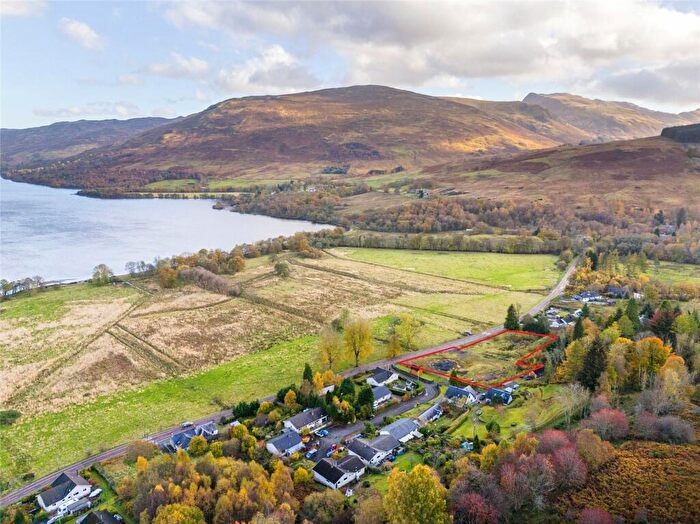
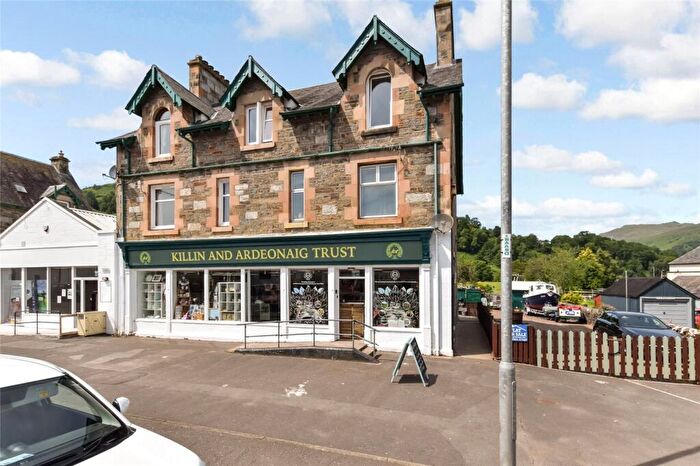
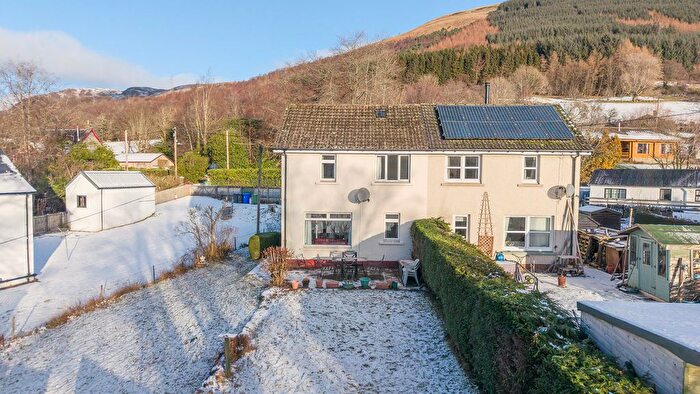
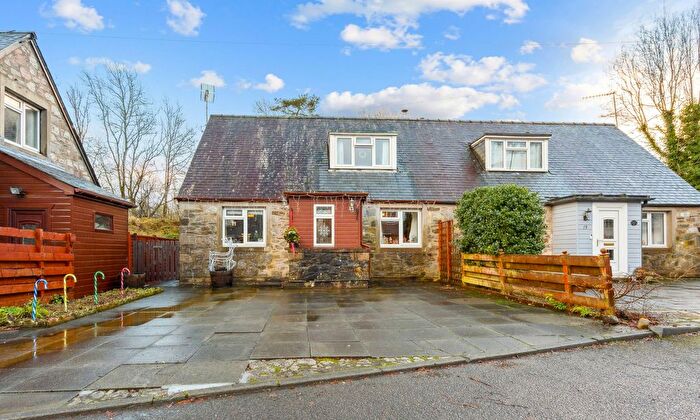
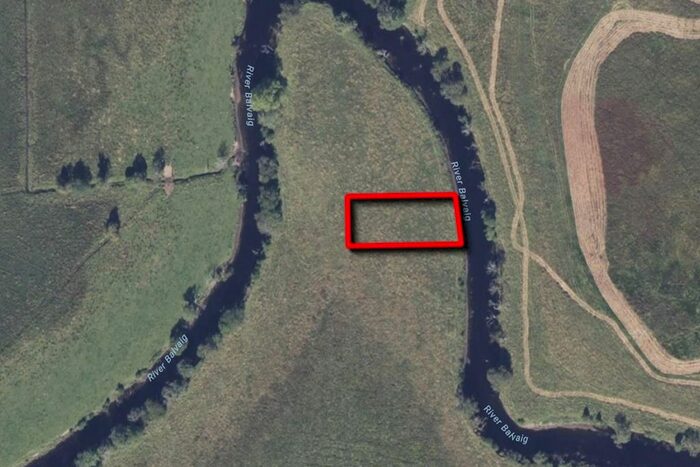
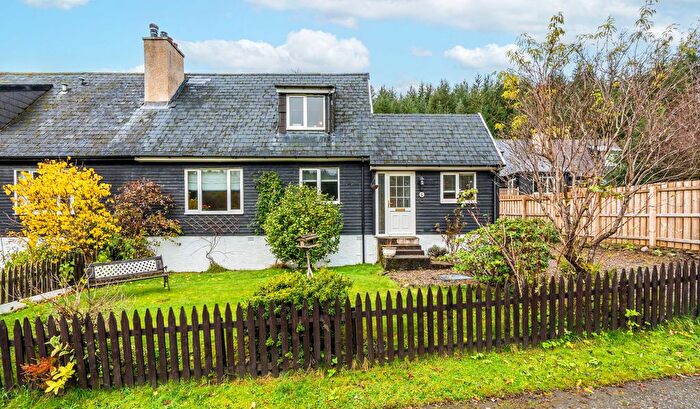
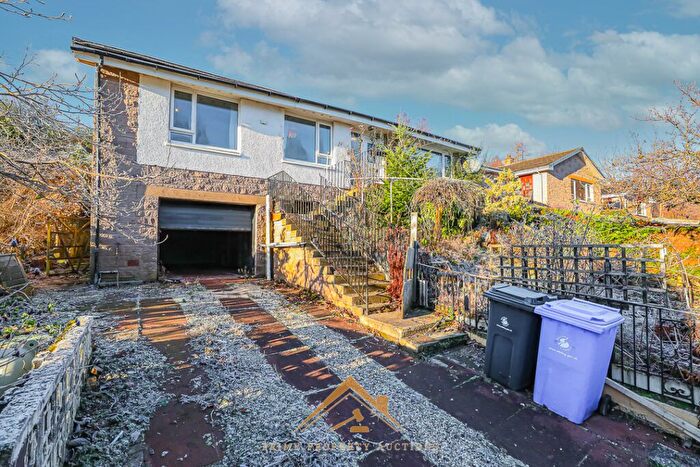
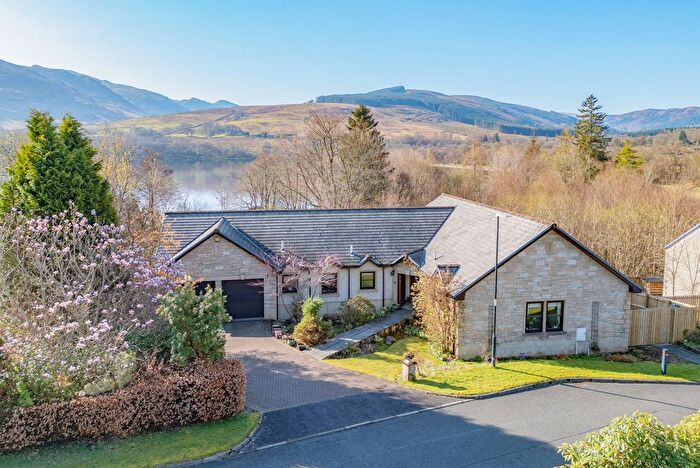
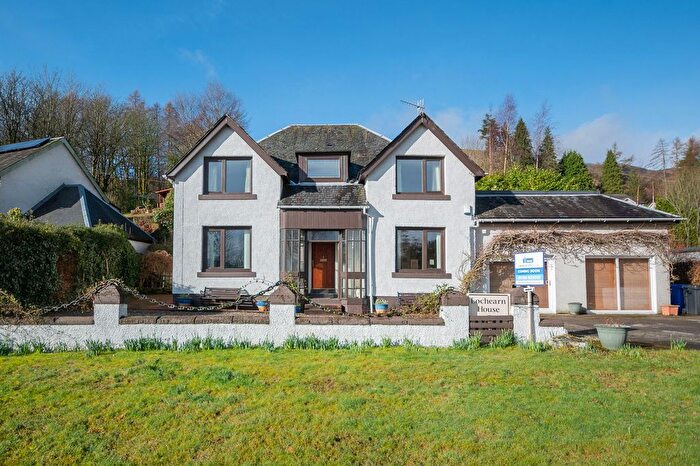
Properties for sale in Trossachs and Teith
Previously listed properties in Trossachs and Teith
Roads and Postcodes in Trossachs and Teith
Navigate through our locations to find the location of your next house in Trossachs and Teith, Lochearnhead for sale or to rent.
| Streets | Postcodes |
|---|---|
| Auchraw Brae | FK19 8PN |
| Auchraw Terrace | FK19 8PS |
| Balquhidder Station | FK19 8NX |
| Cameron Court | FK19 8PD |
| Ravenscroft Road | FK19 8PW |
| Vorlich Road | FK19 8QG |
| FK19 8NR FK19 8NS FK19 8NT FK19 8NY FK19 8NZ FK19 8PA FK19 8PB FK19 8PE FK19 8PF FK19 8PH FK19 8PQ FK19 8PR FK19 8PT FK19 8PU FK19 8PX FK19 8PY FK19 8PZ FK19 8QB FK19 8QD FK19 8QE FK19 8QF FK19 8YF |
Transport near Trossachs and Teith
-
Crianlarich Station
-
Upper Tyndrum Station
-
Tyndrum Lower Station
-
Ardlui Station
-
Dunblane Station
-
Arrochar and Tarbet Station
-
Bridge Of Orchy Station
- FAQ
- Price Paid By Year
Frequently asked questions about Trossachs and Teith
What is the average price for a property for sale in Trossachs and Teith?
The average price for a property for sale in Trossachs and Teith is £390,000. There are 370 property listings for sale in Trossachs and Teith.
Which train stations are available in or near Trossachs and Teith?
Some of the train stations available in or near Trossachs and Teith are Crianlarich, Upper Tyndrum and Tyndrum Lower.
Property Price Paid in Trossachs and Teith by Year
The average sold property price by year was:
| Year | Average Sold Price | Price Change |
Sold Properties
|
|---|---|---|---|
| 2024 | £390,000 | 16% |
1 Property |
| 2022 | £329,100 | -4% |
10 Properties |
| 2021 | £342,636 | 24% |
11 Properties |
| 2020 | £261,050 | 10% |
10 Properties |
| 2019 | £234,384 | -8% |
13 Properties |
| 2018 | £254,265 | -48% |
15 Properties |
| 2017 | £375,416 | 29% |
6 Properties |
| 2016 | £267,000 | 21% |
8 Properties |
| 2015 | £209,871 | -25% |
16 Properties |
| 2014 | £261,693 | -0,3% |
7 Properties |
| 2013 | £262,500 | -12% |
4 Properties |
| 2012 | £293,000 | 32% |
2 Properties |
| 2011 | £198,720 | - |
8 Properties |
| 2010 | £198,714 | -9% |
7 Properties |
| 2009 | £216,833 | -28% |
6 Properties |
| 2008 | £277,591 | 24% |
12 Properties |
| 2007 | £212,058 | -28% |
11 Properties |
| 2006 | £272,142 | 25% |
7 Properties |
| 2005 | £204,880 | 1% |
8 Properties |
| 2004 | £202,636 | 37% |
18 Properties |
| 2003 | £128,275 | -27% |
13 Properties |
| 2002 | £163,399 | - |
17 Properties |

