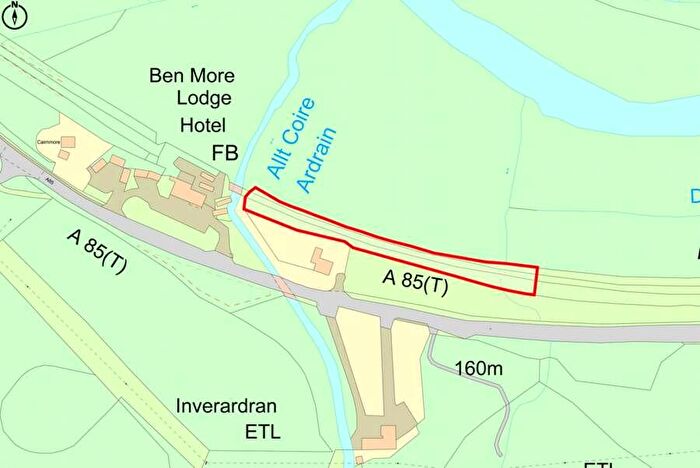
Houses for sale & to rent in Trossachs and Teith, Crianlarich
House Prices in Trossachs and Teith
Properties in Trossachs and Teith have an average house price of £221,000.00 and had 2 Property Transactions within the last 3 years¹.
Trossachs and Teith is an area in Crianlarich, Stirling with 146 households², where the most expensive property was sold for £285,000.00.
Properties for sale in Trossachs and Teith
Previously listed properties in Trossachs and Teith
Roads and Postcodes in Trossachs and Teith
Navigate through our locations to find the location of your next house in Trossachs and Teith, Crianlarich for sale or to rent.
| Streets | Postcodes |
|---|---|
| Glenfalloch Road | FK20 8RJ |
| Mansefield | FK20 8RQ |
| Meadow Grove | FK20 8QU |
| Strathfillan Terrace | FK20 8QW |
| Strathmore Terrace | FK20 8QP |
| Tyndrum Terrace | FK20 8RT |
| Willow Brae | FK20 8RP |
| Willow Square | FK20 8RR |
| FK20 8QN FK20 8QQ FK20 8QR FK20 8QS FK20 8QT FK20 8RL FK20 8RN FK20 8RS FK20 8RU FK20 8RW FK20 8RX FK20 8RY FK20 8RZ FK20 8SA |
Transport near Trossachs and Teith
- FAQ
- Price Paid By Year
Frequently asked questions about Trossachs and Teith
What is the average price for a property for sale in Trossachs and Teith?
The average price for a property for sale in Trossachs and Teith is £221,000. There are 88 property listings for sale in Trossachs and Teith.
Which train stations are available in or near Trossachs and Teith?
Some of the train stations available in or near Trossachs and Teith are Crianlarich, Upper Tyndrum and Tyndrum Lower.
Property Price Paid in Trossachs and Teith by Year
The average sold property price by year was:
| Year | Average Sold Price | Price Change |
Sold Properties
|
|---|---|---|---|
| 2023 | £221,000 | -19% |
2 Properties |
| 2022 | £263,074 | 24% |
5 Properties |
| 2021 | £199,363 | 19% |
11 Properties |
| 2020 | £161,666 | 39% |
3 Properties |
| 2019 | £98,333 | -78% |
3 Properties |
| 2018 | £175,142 | 37% |
7 Properties |
| 2017 | £111,035 | 1% |
7 Properties |
| 2016 | £110,000 | -107% |
2 Properties |
| 2015 | £228,166 | 21% |
6 Properties |
| 2014 | £180,000 | -2% |
2 Properties |
| 2013 | £182,750 | -20% |
6 Properties |
| 2012 | £219,500 | 46% |
3 Properties |
| 2011 | £118,250 | -64% |
4 Properties |
| 2010 | £193,500 | 64% |
4 Properties |
| 2009 | £69,500 | -216% |
2 Properties |
| 2008 | £219,471 | 12% |
7 Properties |
| 2007 | £193,412 | -2% |
4 Properties |
| 2006 | £197,750 | 12% |
6 Properties |
| 2005 | £173,525 | -36% |
6 Properties |
| 2004 | £236,239 | 53% |
9 Properties |
| 2003 | £109,916 | 34% |
6 Properties |
| 2002 | £72,200 | -109% |
9 Properties |
| 2001 | £150,850 | - |
3 Properties |

