
Houses for sale in Stirling, Scotland
House Prices in Stirling
Properties in Stirling have
an average house price of
£238k
and had 2,493 Property Transactions
within the last 3 years.¹
Stirling is a location in
Scotland with
37,486 households², where the most expensive property was sold for £1.68M.
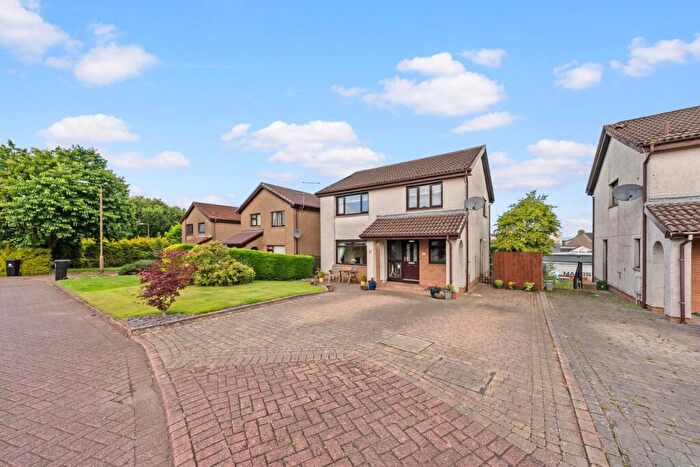
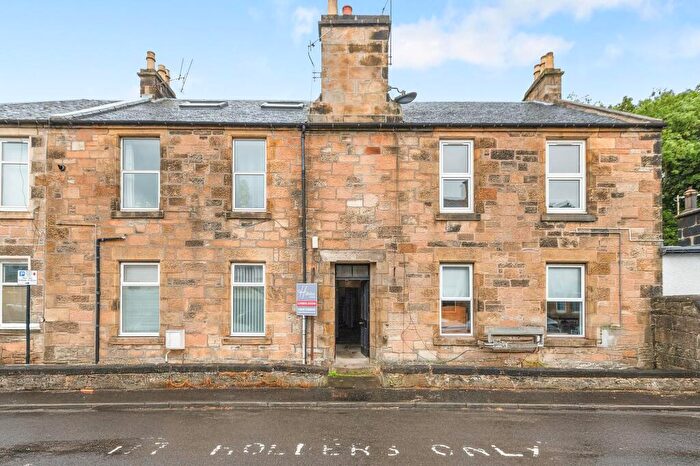
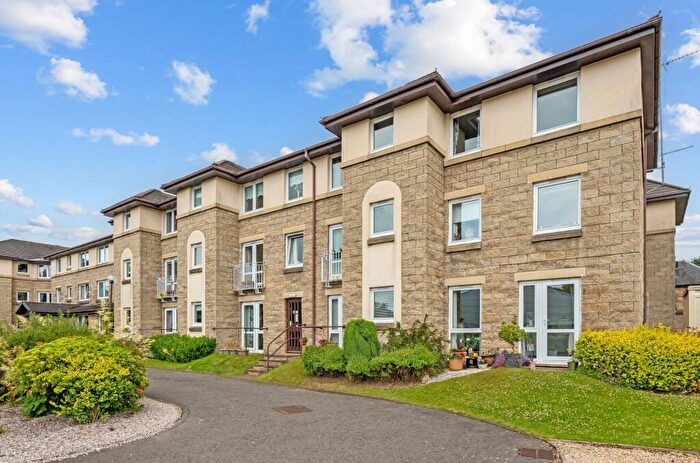
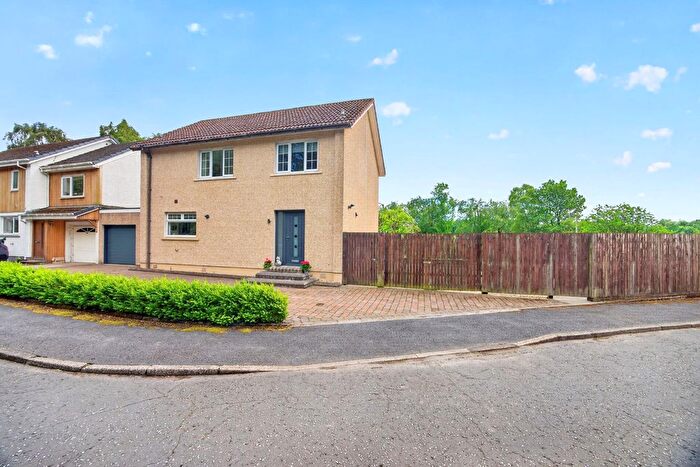
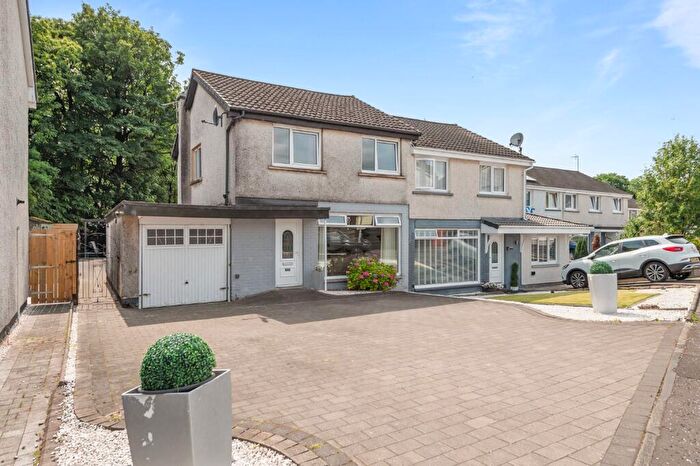
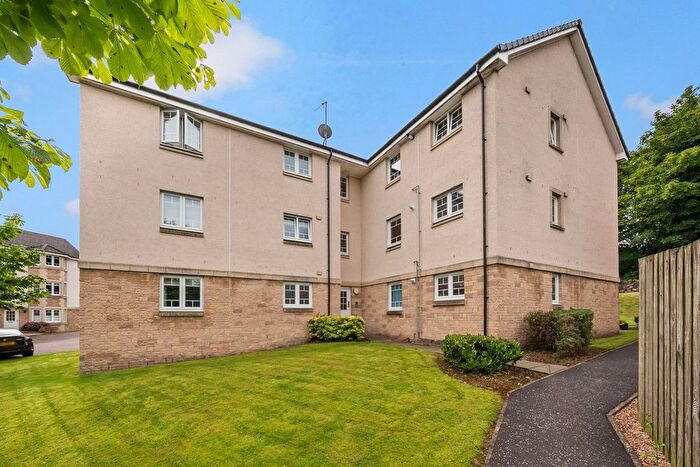
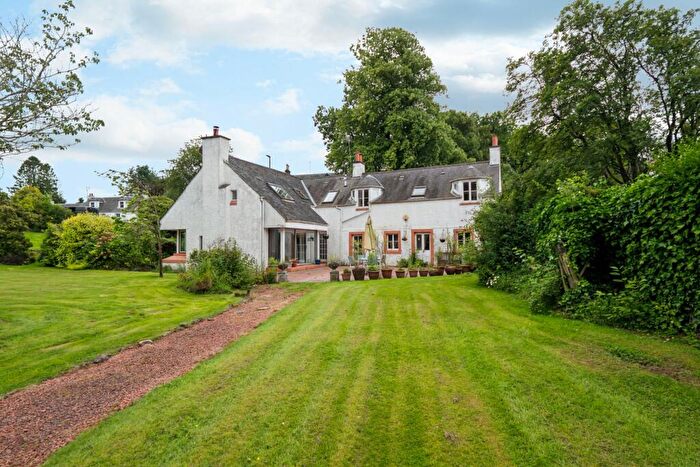
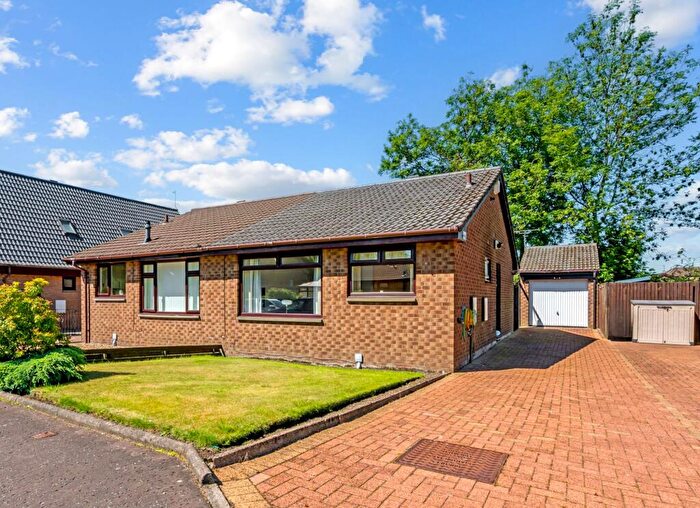
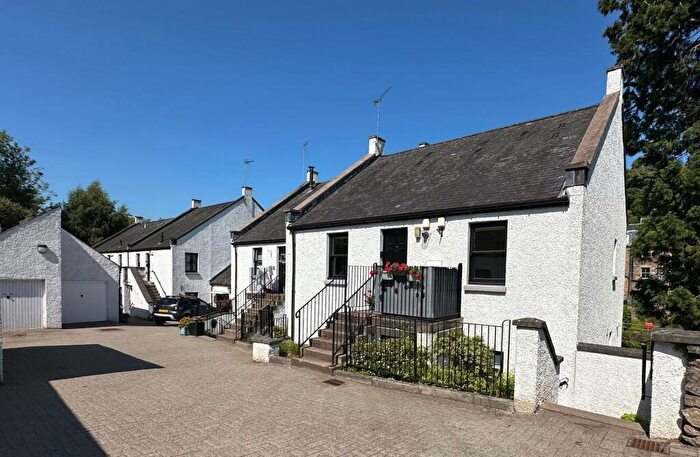
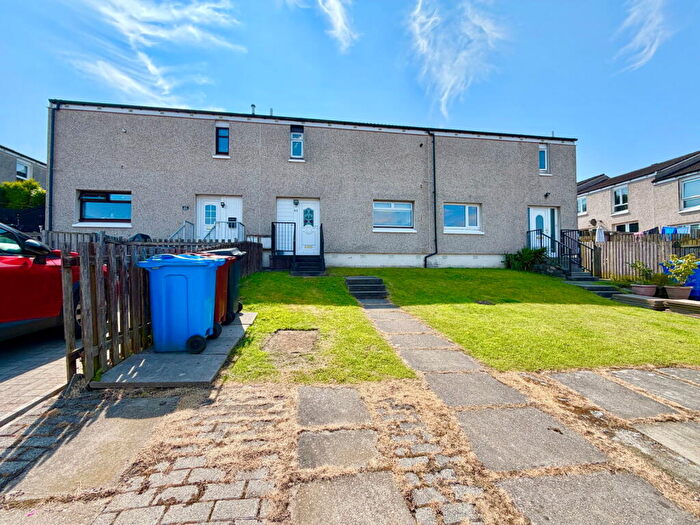
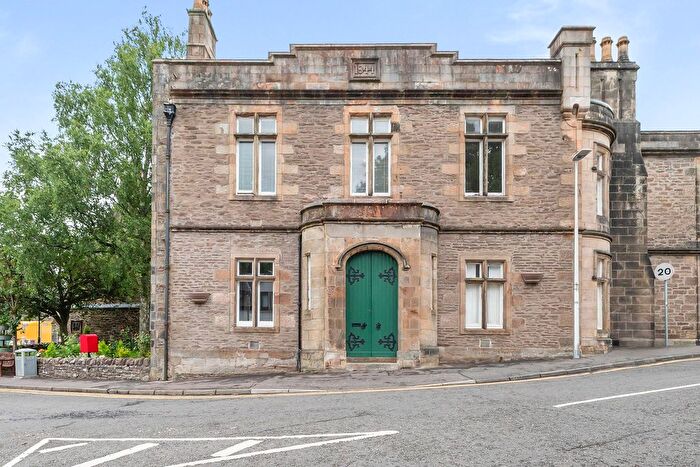
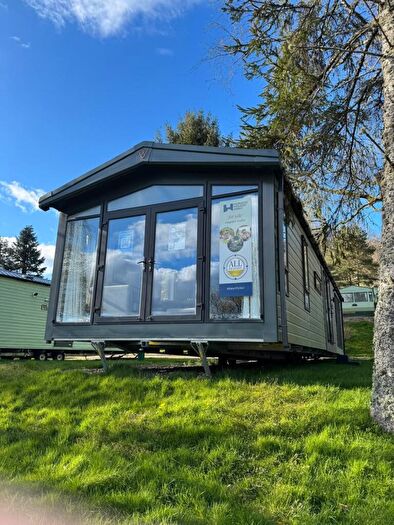
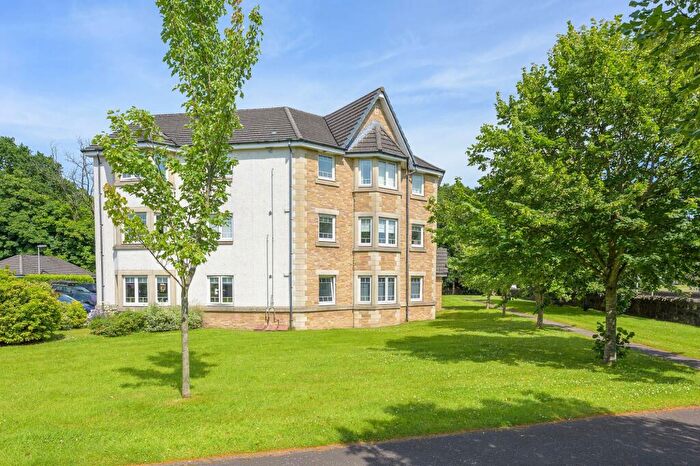
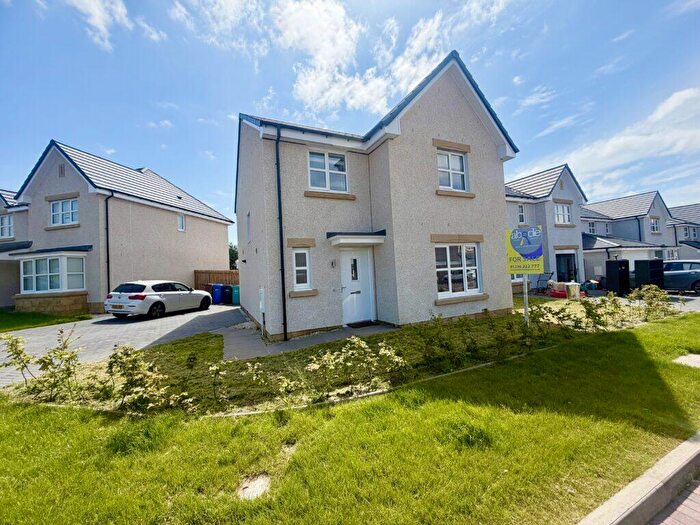
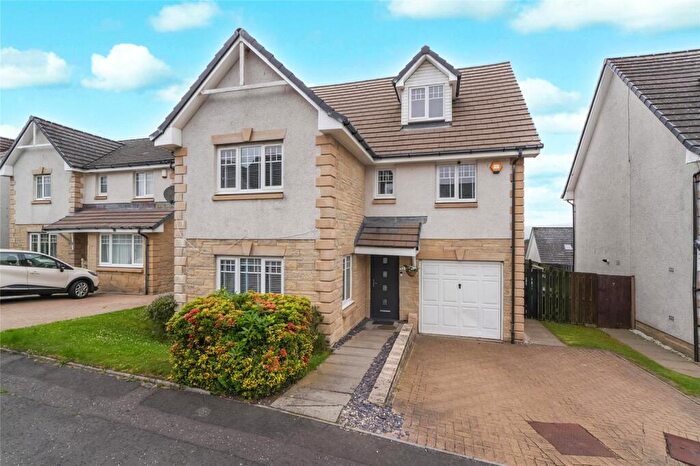
Properties for sale in Stirling
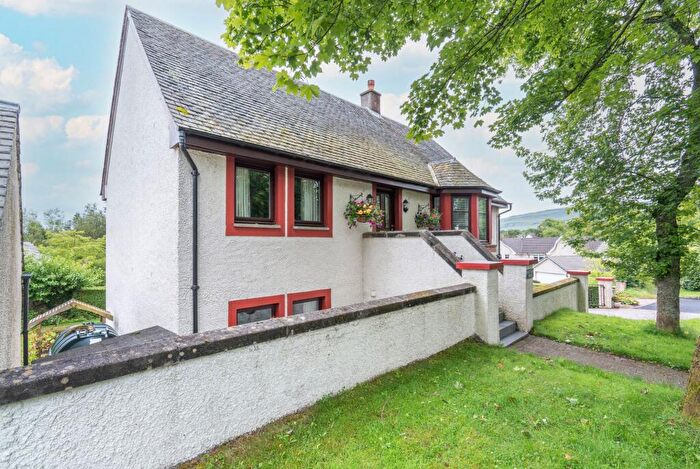
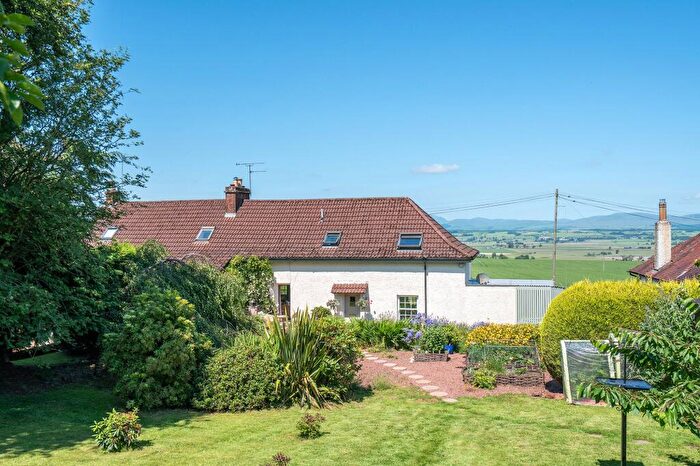
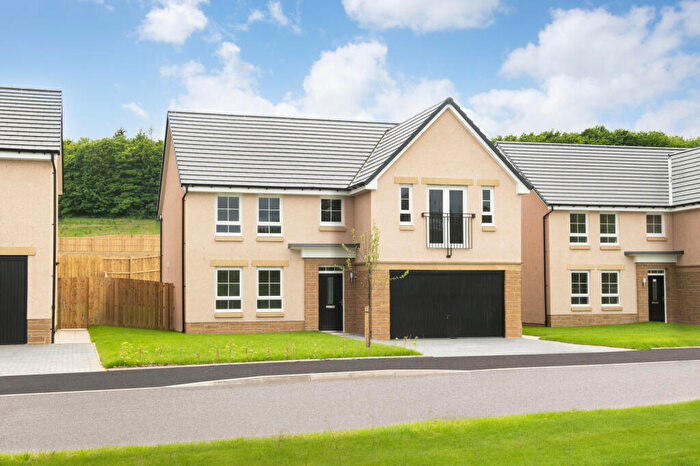
![]()
If you are looking to sell your house, let it out, or receive a property valuation, an expert can help you.
Click the button below to get started.
Towns in Stirling
Navigate through our locations to find the location of your next house in Stirling, Scotland for sale or to rent.
Property price trends in Stirling
According to the latest Registers of Scotland data, the average home in Stirling sold for £267,892 in 2026. That figure comes from a substantial record of 39,629 sales logged over the past 25 years.
Prices have continued to climb over the last three years. Compared with 2023, when the typical sale came in around £230,612, that's a rise of roughly 16.2%.
Looking back five years, average prices are up about 9.9% since 2021, a gain of around £24,048 in cash terms.
Zoom out to the past decade for the fuller picture. Back in 2016, homes here averaged £191,119, so the typical sold price has climbed about 40.2% since then, roughly 3.4% a year. Stretch the view to fifteen years and that annual pace eases back to about 2.6%.
Frequently asked questions about Stirling
What is the average price for a property for sale in Stirling?
The average price for a property for sale in Stirling is £237,784. This amount is 18% higher than the average price in Scotland. There are more than 10,000 property listings for sale in Stirling.
What locations have the most expensive properties for sale in Stirling?
The locations with the most expensive properties for sale in Stirling are Lochearnhead at an average of £390,000, Dunblane at an average of £326,983 and Doune at an average of £282,926.
What locations have the most affordable properties for sale in Stirling?
The locations with the most affordable properties for sale in Stirling are Stirling at an average of £213,279, Killin at an average of £229,047 and Callander at an average of £244,493.
Which train stations are available in or near Stirling?
Some of the train stations available in or near Stirling are Bridge Of Allan, Stirling and Dunblane.
Property Price Paid in Stirling by Year
The average sold property price by year was:
| Year | Average Sold Price | Price Change |
Sold Properties
|
|---|---|---|---|
| 2026 | £267,892 | 11% |
151 Properties |
| 2025 | £238,312 | -1% |
718 Properties |
| 2024 | £239,820 | 4% |
730 Properties |
| 2023 | £230,612 | -9% |
894 Properties |
| 2022 | £252,179 | 3% |
1,712 Properties |
| 2021 | £243,844 | 5% |
1,851 Properties |
| 2020 | £231,804 | 11% |
1,392 Properties |
| 2019 | £206,854 | 1% |
1,672 Properties |
| 2018 | £204,612 | 3% |
1,752 Properties |
| 2017 | £197,991 | 3% |
1,787 Properties |
Transport in Stirling
Please see below transportation links in this area:
