
Houses for sale in Stirling, Stirling
House Prices in Stirling
Properties in Stirling have an average house price of £213k and had 1,685 Property Transactions within the last 3 years.¹
Stirling is an area in Stirling with 26,466 households², where the most expensive property was sold for £1.48M.
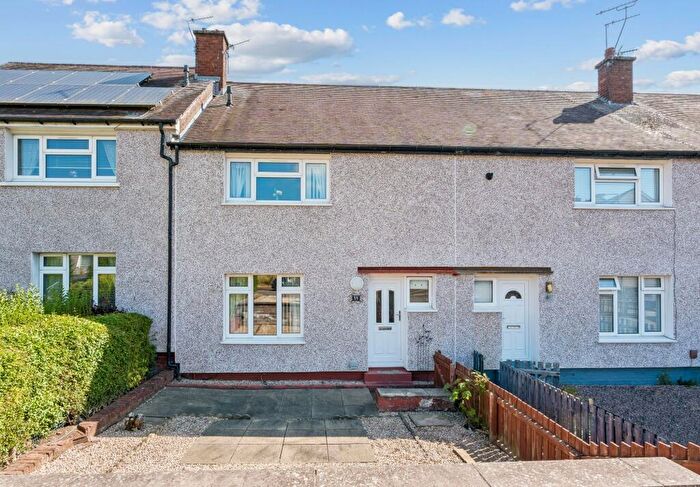
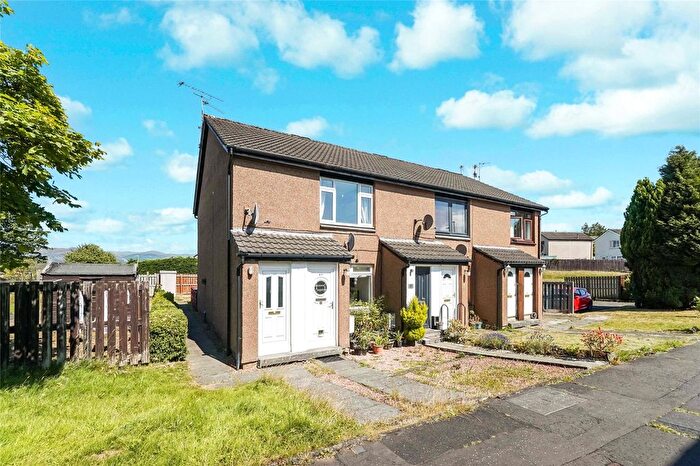
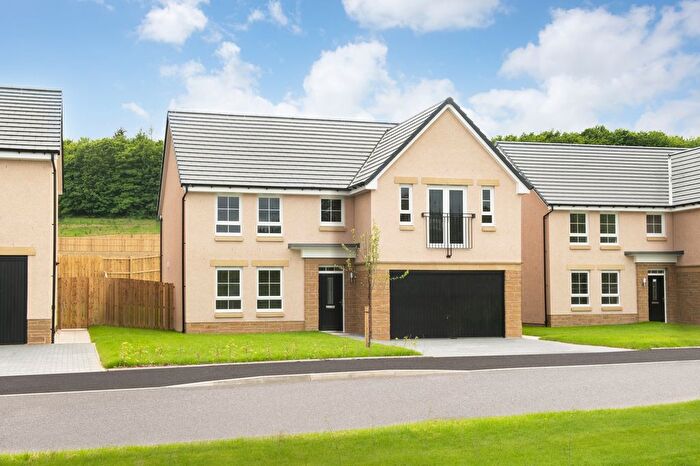
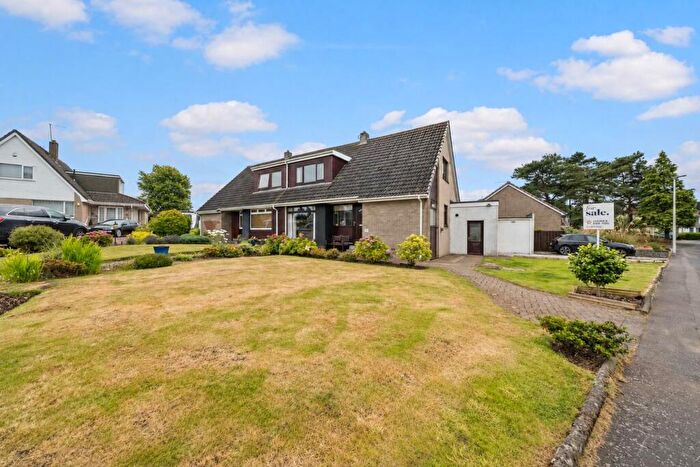
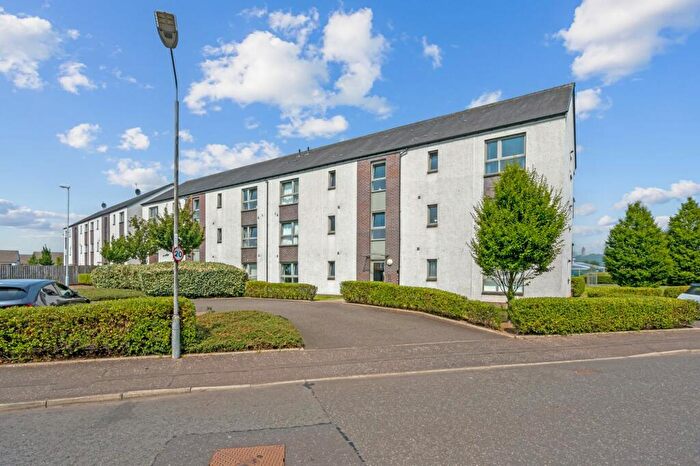
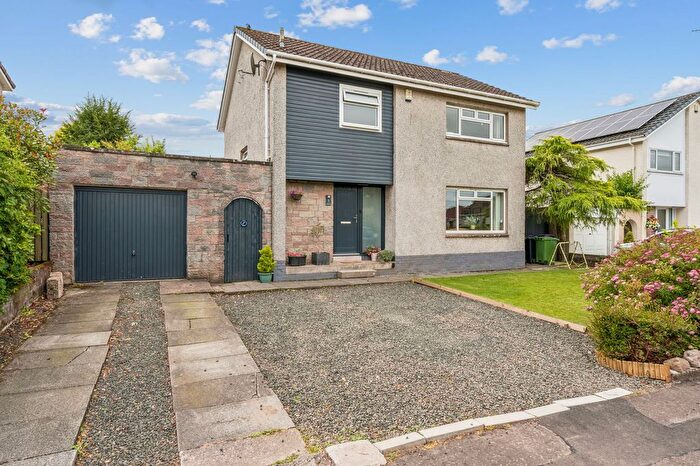
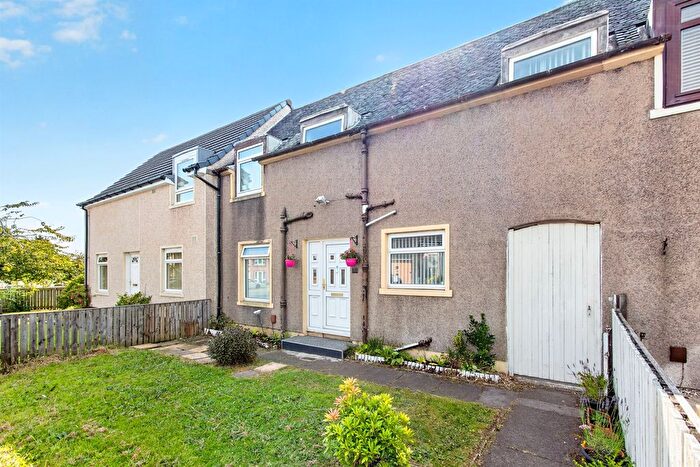
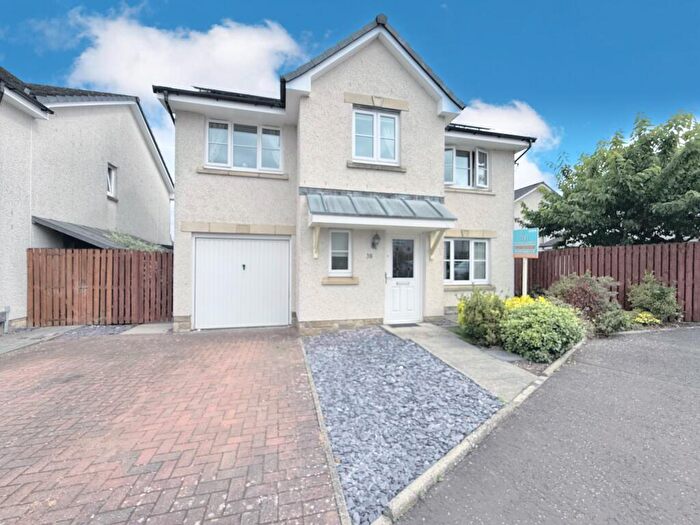
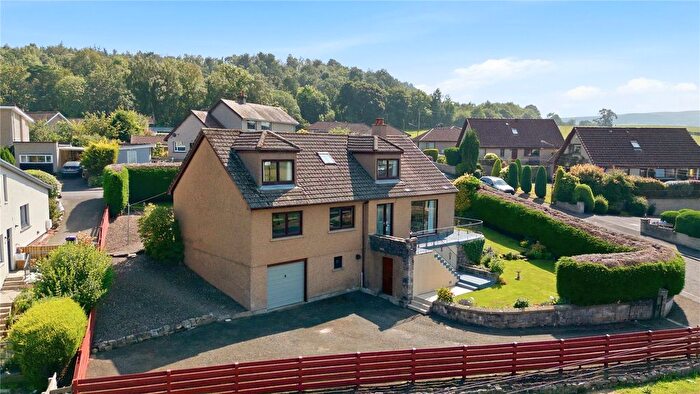
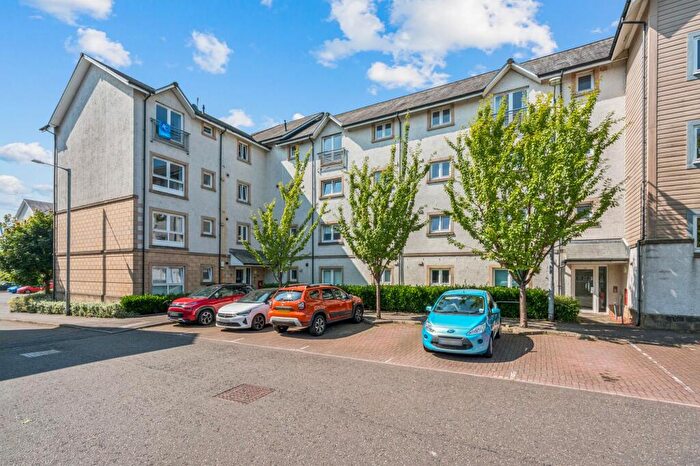
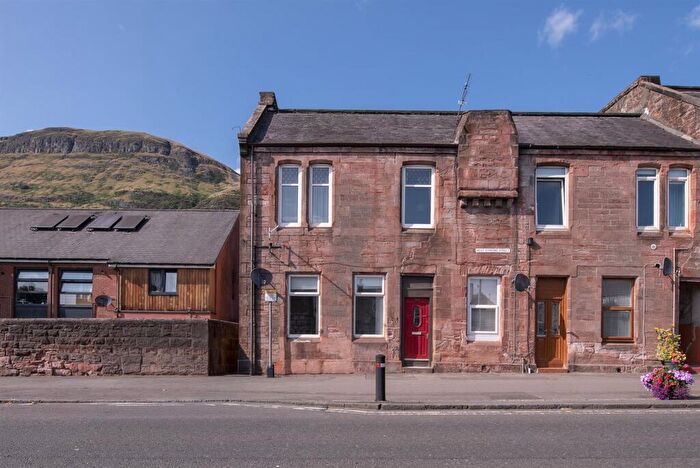
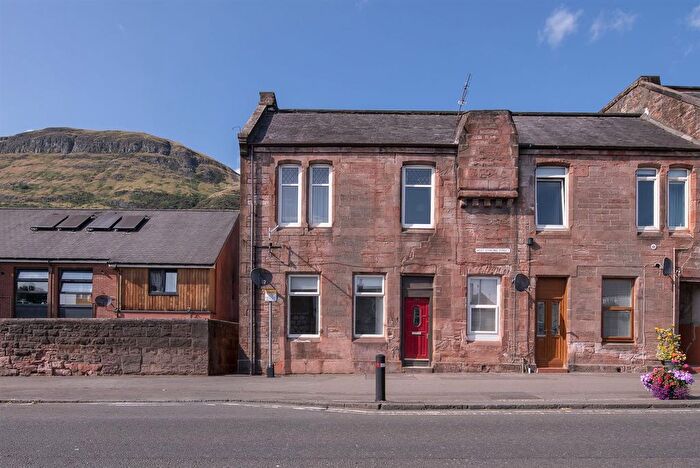
Properties for sale in Stirling

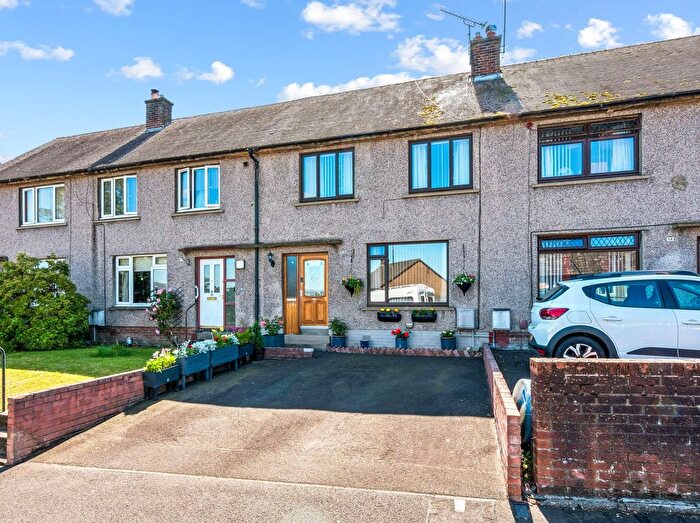
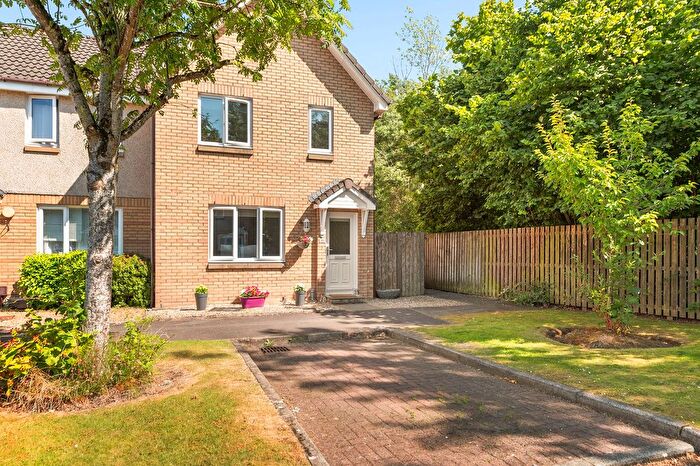
![]()
If you are looking to sell your house, let it out, or receive a property valuation, an expert can help you.
Click the button below to get started.


Neighbourhoods in Stirling
Navigate through our locations to find the location of your next house in Stirling, Stirling for sale or to rent.
Property price trends in Stirling
According to the latest Registers of Scotland data, the average home in Stirling sold for £218,114 in 2025. That figure comes from a substantial record of 27,373 sales logged over the past 24 years.
Prices have held fairly steady over the last three years. Compared with 2022, when the typical sale came in around £221,320, values are broadly unchanged.
Looking back five years, average prices are up about 7.5% since 2020, a gain of around £15,302 in cash terms.
Zoom out to the past decade for the fuller picture. Back in 2015, homes here averaged £167,983, so the typical sold price has climbed about 29.8% since then, roughly 2.6% a year. Stretch the view to fifteen years and that annual pace eases back to about 2%.
Frequently asked questions about Stirling
What is the average price for a property for sale in Stirling?
The average price for a property for sale in Stirling is £213,279. This amount is 10% lower than the average price in Stirling. There are more than 10,000 property listings for sale in Stirling.
What locations have the most expensive properties for sale in Stirling?
The locations with the most expensive properties for sale in Stirling are Dunblane and Bridge of Allan at an average of £316,556, Forth and Endrick at an average of £277,002 and Trossachs and Teith at an average of £271,102.
What locations have the most affordable properties for sale in Stirling?
The locations with the most affordable properties for sale in Stirling are Stirling East at an average of £166,783, Bannockburn at an average of £175,768 and Stirling North at an average of £198,033.
Which train stations are available in or near Stirling?
Some of the train stations available in or near Stirling are Stirling, Bridge Of Allan and Dunblane.
Property Price Paid in Stirling by Year
The average sold property price by year was:
| Year | Average Sold Price | Price Change |
Sold Properties
|
|---|---|---|---|
| 2025 | £218,114 | 2% |
520 Properties |
| 2024 | £213,098 | 2% |
535 Properties |
| 2023 | £209,442 | -6% |
630 Properties |
| 2022 | £221,320 | 4% |
1,180 Properties |
| 2021 | £212,513 | 5% |
1,218 Properties |
| 2020 | £202,812 | 8% |
969 Properties |
| 2019 | £186,448 | 1% |
1,148 Properties |
| 2018 | £183,909 | 4% |
1,213 Properties |
| 2017 | £176,735 | 4% |
1,226 Properties |
| 2016 | £170,480 | 1% |
1,230 Properties |
Transport in Stirling
Please see below transportation links in this area:
