
Houses for sale & to rent in Forth and Endrick, Stirling
House Prices in Forth and Endrick
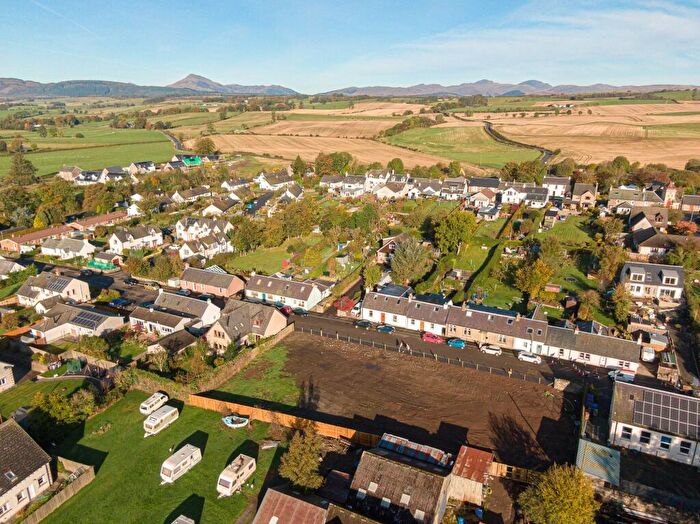
Properties in Forth and Endrick have an average house price of £277k and had 41 Property Transactions within the last 3 years¹.
Forth and Endrick is an area in Stirling, Stirling with 1,315 households², where the most expensive property was sold for £630k.
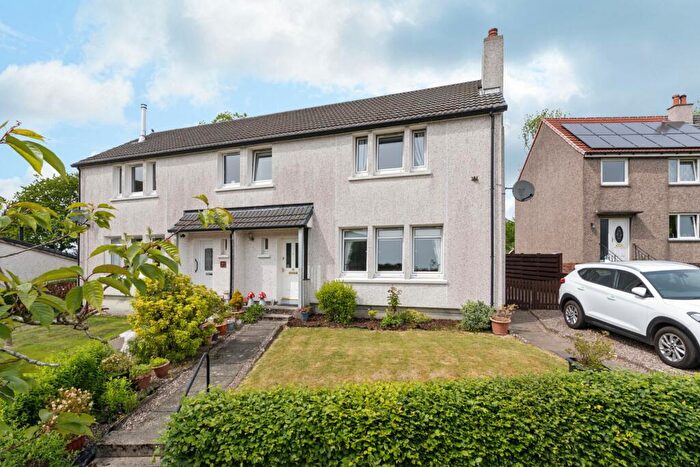
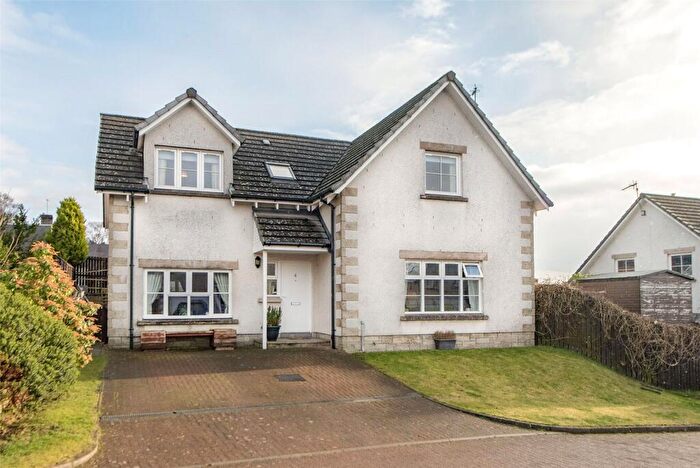
Properties for sale in Forth and Endrick
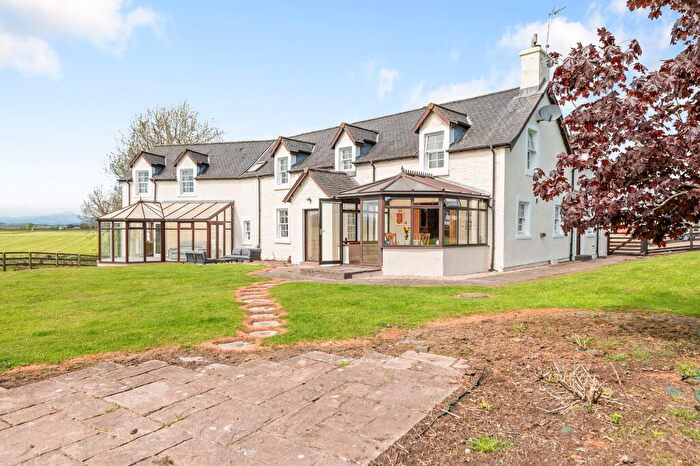
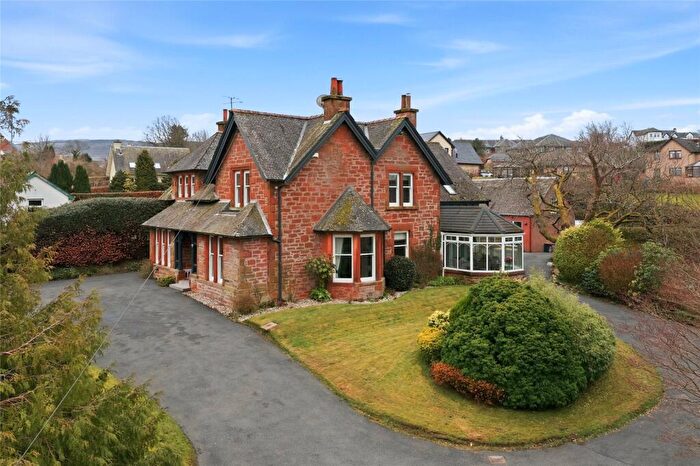
![]()
If you are looking to sell your house, let it out, or receive a property valuation, an expert can help you.
Click the button below to get started.


Roads and Postcodes in Forth and Endrick
Navigate through our locations to find the location of your next house in Forth and Endrick, Stirling for sale or to rent.
| Streets | Postcodes |
|---|---|
| Chalmerston Road | FK8 3AT |
| Baron Court | FK8 3NJ |
| Broom Park | FK8 3BY |
| Burngreen | FK8 3DQ |
| Burnside | FK8 3DB FK8 3EF |
| Burnside Terrace | FK8 3NQ |
| Cameron Crescent | FK8 3EH |
| Castlehill Loan | FK8 3DZ |
| Cauldhame | FK8 3JB |
| Charles Street | FK8 3DD |
| Culbowie Crescent | FK8 3NH |
| Culbowie Road | FK8 3LS FK8 3NY |
| Davidson Lea | FK8 3HH |
| Denovan Crescent | FK8 3HJ |
| Drummond Place | FK8 3BZ |
| Fintry Road | FK8 3DR FK8 3HL FK8 3HR FK8 3HW |
| Fisher Place | FK8 3ND |
| Fore Road | FK8 3DT |
| George Place | FK8 3BL |
| Glentirranmuir | FK8 3HU |
| Graham Street | FK8 3DU |
| Hays Hill | FK8 3EQ |
| Heights Road | FK8 3NS |
| Leckie Road | FK8 3BJ |
| Loftbrae Park | FK8 3DH |
| Main Street | FK8 3BP FK8 3BW FK8 3DN FK8 3LP FK8 3LR FK8 3LT FK8 3LU FK8 3LX |
| Manse Brae | FK8 3BQ |
| Mclaren's Park | FK8 3DG |
| Mcneill Crescent | FK8 3BX |
| Menteith Crescent | FK8 3EG |
| Millbrae | FK8 3BB |
| Montgomery Place | FK8 3NF |
| Moray Place | FK8 3BT |
| Mye Road | FK8 3LY |
| Oakwood | FK8 3DP |
| Old Vinery | FK8 3JD |
| Rennie's Loan | FK8 3DX |
| Scott Brae | FK8 3DL |
| Stark Street | FK8 3BU |
| Station Brae | FK8 3DY |
| Station Road | FK8 3DA FK8 3NB FK8 3NE |
| Stevenson Street | FK8 3BS |
| Taylor Place | FK8 3NA |
| The Acres | FK8 3ED |
| The Cross | FK8 3DS |
| The Glebe | FK8 3AX |
| The Meadows | FK8 3AS |
| The Old Nursery | FK8 3DJ |
| The Square | FK8 3BH |
| The Street | FK8 3HB |
| Wester Kepp | FK8 3HD |
| Wingate Place | FK8 3DW |
| FK8 3AF FK8 3AY FK8 3AZ FK8 3BA FK8 3BD FK8 3BG FK8 3BN FK8 3EA FK8 3EL FK8 3EN FK8 3ER FK8 3ES FK8 3ET FK8 3EW FK8 3EX FK8 3EY FK8 3EZ FK8 3HA FK8 3HN FK8 3HS FK8 3HT FK8 3HX FK8 3HY FK8 3HZ FK8 3JA FK8 3JH FK8 3JJ FK8 3JL FK8 3JN FK8 3JQ FK8 3JW FK8 3JX FK8 3LZ FK8 3NR FK8 3NT FK8 3NU FK8 3NX FK8 3NZ FK8 3PA FK8 3PB FK8 3PD FK8 3AU |
Transport near Forth and Endrick

- FAQ
- Price Paid By Year
Frequently asked questions about Forth and Endrick
What is the average price for a property for sale in Forth and Endrick?
The average price for a property for sale in Forth and Endrick is £277,002. This amount is 30% higher than the average price in Stirling. There are 194 property listings for sale in Forth and Endrick.
What streets have the most expensive properties for sale in Forth and Endrick?
The streets with the most expensive properties for sale in Forth and Endrick are Burnside at an average of £495,000, Denovan Crescent at an average of £425,000 and Castlehill Loan at an average of £380,000.
What streets have the most affordable properties for sale in Forth and Endrick?
The streets with the most affordable properties for sale in Forth and Endrick are Fisher Place at an average of £140,000, Station Road at an average of £174,250 and Stevenson Street at an average of £176,062.
Which train stations are available in or near Forth and Endrick?
Some of the train stations available in or near Forth and Endrick are Bridge Of Allan, Dunblane and Stirling.
Property Price Paid in Forth and Endrick by Year
The average sold property price by year was:
| Year | Average Sold Price | Price Change |
Sold Properties
|
|---|---|---|---|
| 2025 | £310,134 | 15% |
13 Properties |
| 2024 | £264,565 | 2% |
13 Properties |
| 2023 | £259,066 | -22% |
15 Properties |
| 2022 | £316,211 | -25% |
47 Properties |
| 2021 | £395,722 | 29% |
50 Properties |
| 2020 | £282,816 | 15% |
44 Properties |
| 2019 | £239,948 | -15% |
46 Properties |
| 2018 | £275,804 | 2% |
31 Properties |
| 2017 | £269,186 | 6% |
57 Properties |
| 2016 | £252,689 | 8% |
45 Properties |
| 2015 | £232,332 | 17% |
31 Properties |
| 2014 | £193,169 | -5% |
35 Properties |
| 2013 | £203,682 | -15% |
38 Properties |
| 2012 | £234,077 | 4% |
35 Properties |
| 2011 | £224,104 | 0,3% |
21 Properties |
| 2010 | £223,409 | -8% |
28 Properties |
| 2009 | £241,121 | 3% |
30 Properties |
| 2008 | £233,270 | -14% |
30 Properties |
| 2007 | £265,169 | 35% |
38 Properties |
| 2006 | £172,611 | -31% |
40 Properties |
| 2005 | £226,533 | 3% |
58 Properties |
| 2004 | £220,056 | 17% |
65 Properties |
| 2003 | £183,292 | 18% |
63 Properties |
| 2002 | £151,062 | 25% |
92 Properties |
| 2001 | £112,576 | - |
12 Properties |