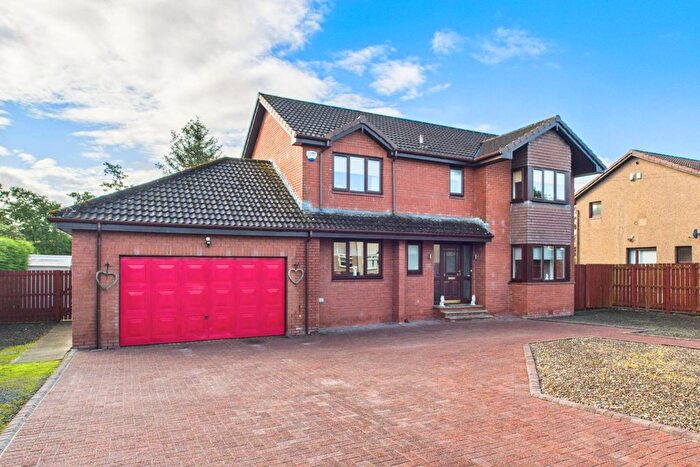
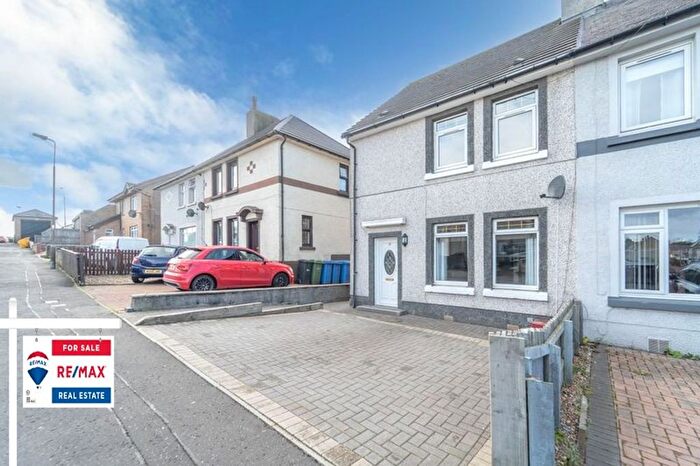
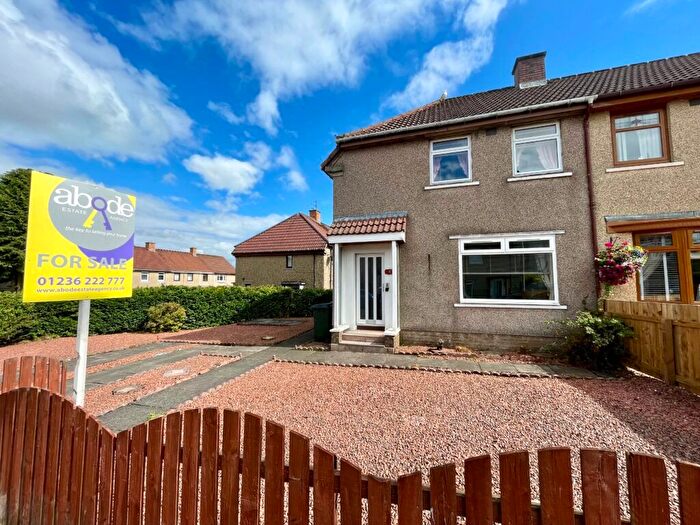
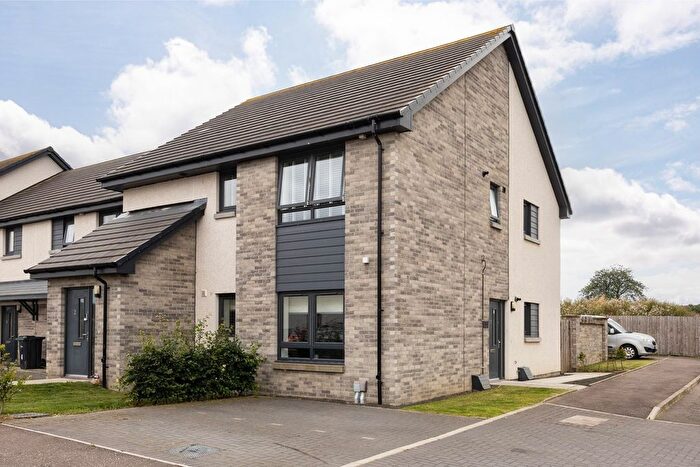
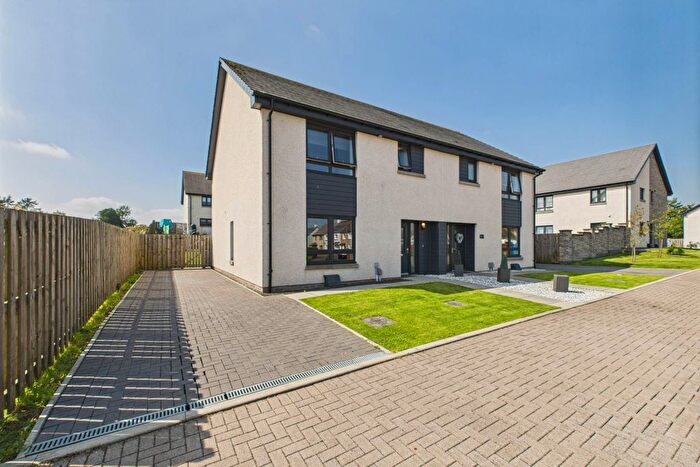
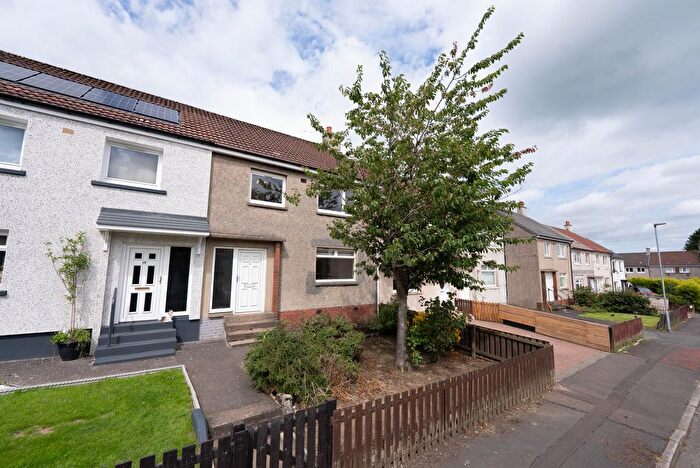
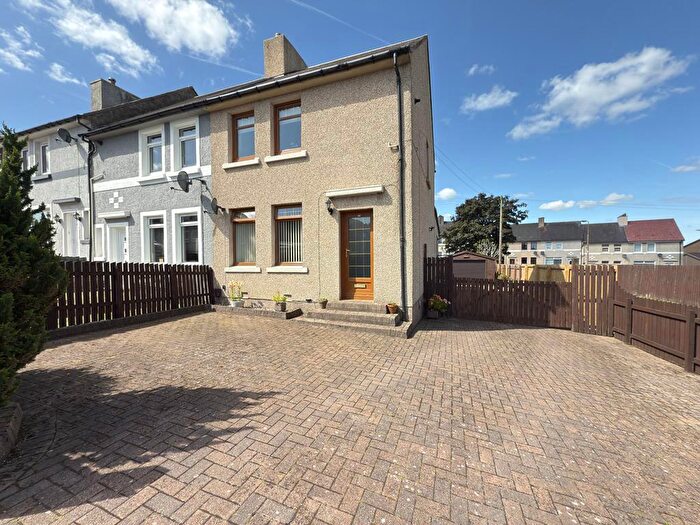
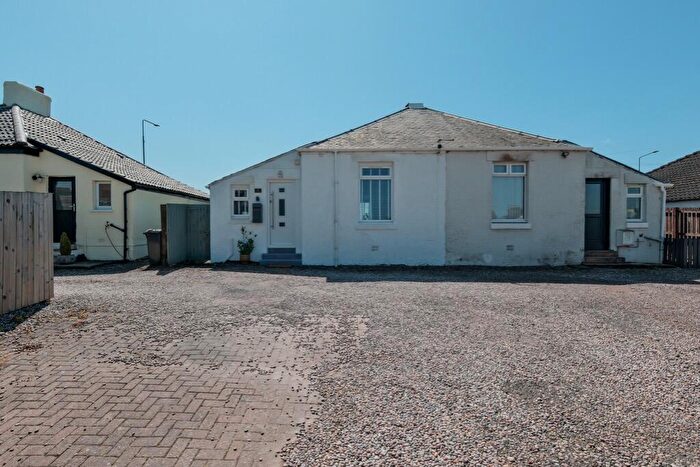
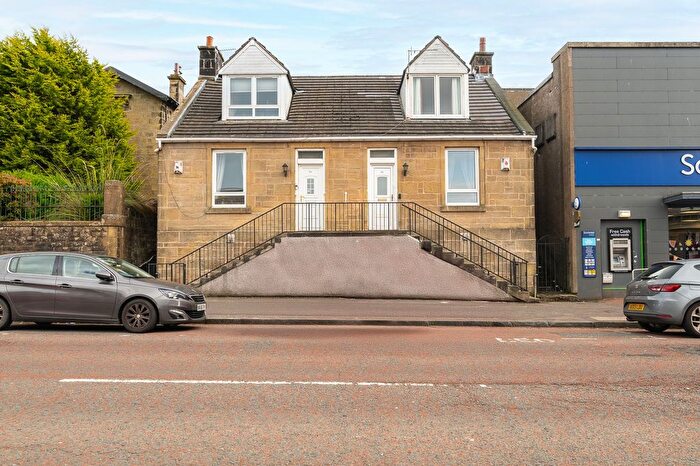
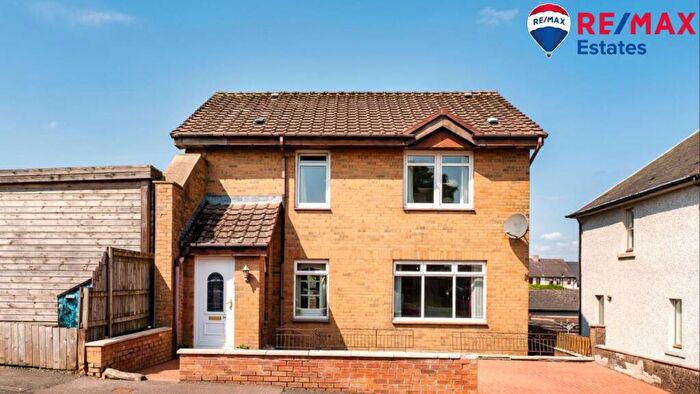
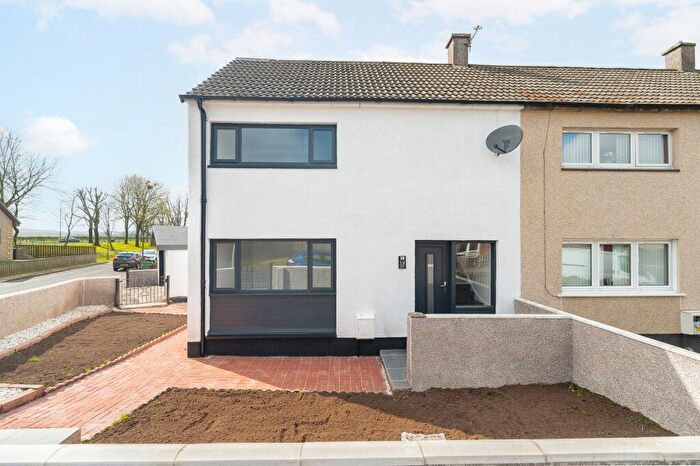
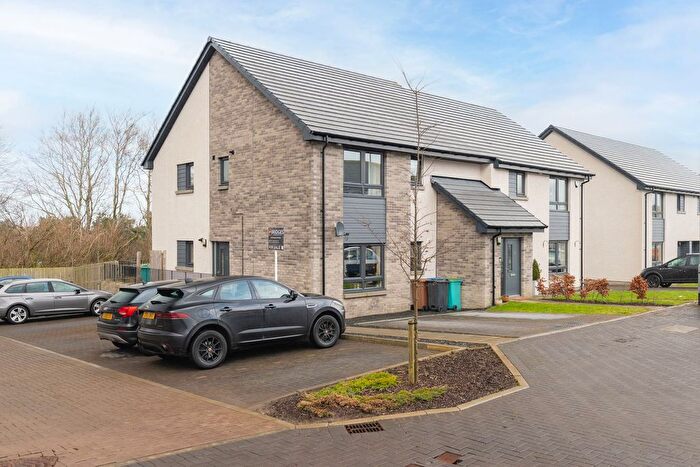
Houses for sale & to rent in Whitburn and Blackburn, Shotts
House Prices in Whitburn and Blackburn
Properties in Whitburn and Blackburn have an average house price of £174,921.00 and had 26 Property Transactions within the last 3 years¹.
Whitburn and Blackburn is an area in Shotts, West Lothian with 432 households², where the most expensive property was sold for £407,500.00.
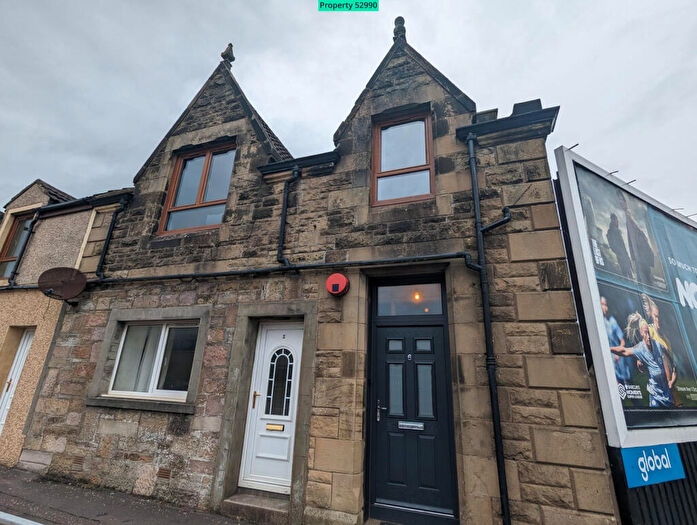
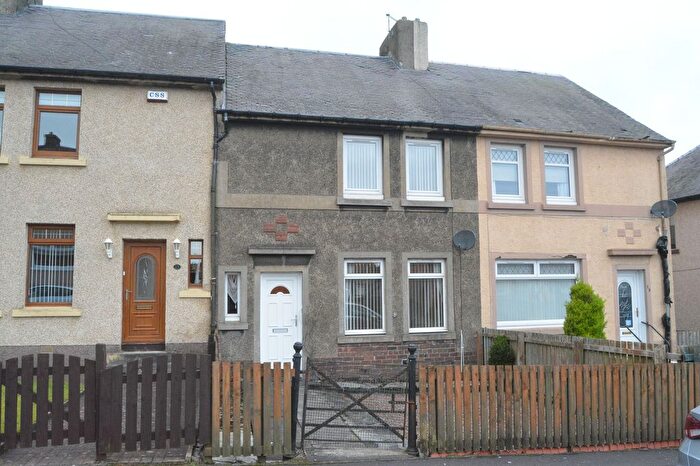
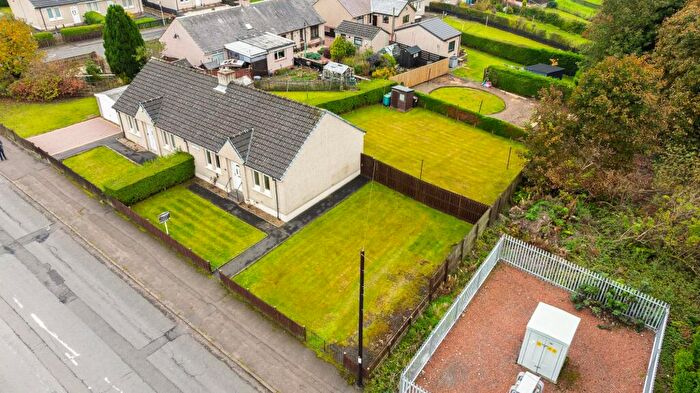
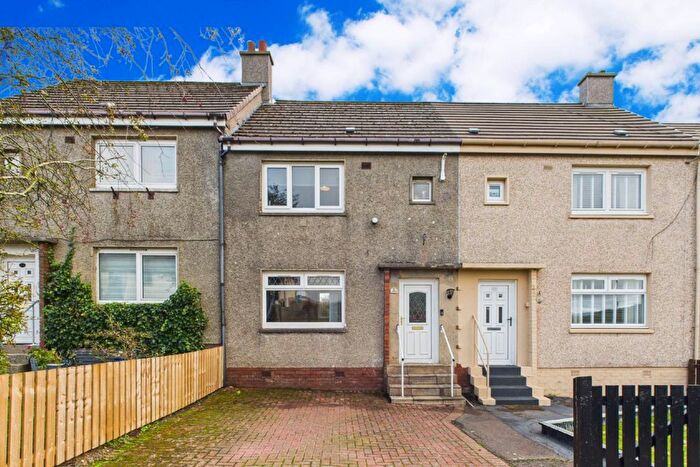
Properties for sale in Whitburn and Blackburn
Previously listed properties in Whitburn and Blackburn
Roads and Postcodes in Whitburn and Blackburn
Navigate through our locations to find the location of your next house in Whitburn and Blackburn, Shotts for sale or to rent.
| Streets | Postcodes |
|---|---|
| Baillie Avenue | ML7 5SY ML7 5SZ |
| Beechbank Cottages | ML7 5RL |
| Burnbrae Road | ML7 5QZ |
| Burns Crescent | ML7 5QY |
| Dyke Brow | ML7 5QR |
| Dyke Court | ML7 5RH |
| Dyke Road | ML7 5QT |
| Greenrigg Cottages | ML7 5QP |
| Harthill | ML7 5TA ML7 5TB |
| Park Road | ML7 5RB |
| Polkemmet Drive | ML7 5QS ML7 5RD ML7 5RE |
| Polkemmet Lane | ML7 5RQ |
| Polkemmet Road | ML7 5RF |
| Stanley Drive | ML7 5QU |
| Stanley Road | ML7 5QX ML7 5RA |
Transport near Whitburn and Blackburn
- FAQ
- Price Paid By Year
Frequently asked questions about Whitburn and Blackburn
What is the average price for a property for sale in Whitburn and Blackburn?
The average price for a property for sale in Whitburn and Blackburn is £174,921. There are 84 property listings for sale in Whitburn and Blackburn.
What streets have the most expensive properties for sale in Whitburn and Blackburn?
The streets with the most expensive properties for sale in Whitburn and Blackburn are Polkemmet Lane at an average of £250,000, Baillie Avenue at an average of £223,611 and Dyke Brow at an average of £170,000.
What streets have the most affordable properties for sale in Whitburn and Blackburn?
The streets with the most affordable properties for sale in Whitburn and Blackburn are Burnbrae Road at an average of £125,200, Greenrigg Cottages at an average of £127,000 and Park Road at an average of £130,000.
Which train stations are available in or near Whitburn and Blackburn?
Some of the train stations available in or near Whitburn and Blackburn are Blackridge, Armadale and Fauldhouse.
Property Price Paid in Whitburn and Blackburn by Year
The average sold property price by year was:
| Year | Average Sold Price | Price Change |
Sold Properties
|
|---|---|---|---|
| 2025 | £150,022 | -33% |
9 Properties |
| 2024 | £199,343 | 11% |
8 Properties |
| 2023 | £178,111 | 14% |
9 Properties |
| 2022 | £153,692 | 11% |
10 Properties |
| 2021 | £137,150 | 6% |
10 Properties |
| 2020 | £128,269 | -2% |
13 Properties |
| 2019 | £130,604 | 12% |
16 Properties |
| 2018 | £114,611 | -9% |
9 Properties |
| 2017 | £124,845 | 36% |
15 Properties |
| 2016 | £79,289 | -41% |
14 Properties |
| 2015 | £111,780 | 17% |
15 Properties |
| 2014 | £92,666 | 12% |
12 Properties |
| 2013 | £81,387 | -23% |
14 Properties |
| 2012 | £100,142 | 29% |
16 Properties |
| 2011 | £70,843 | -2% |
8 Properties |
| 2010 | £72,340 | 0,3% |
5 Properties |
| 2009 | £72,107 | -17% |
17 Properties |
| 2008 | £84,335 | -20% |
23 Properties |
| 2007 | £101,408 | 21% |
30 Properties |
| 2006 | £80,577 | 9% |
34 Properties |
| 2005 | £73,461 | -9% |
26 Properties |
| 2004 | £79,887 | 25% |
41 Properties |
| 2003 | £59,718 | 13% |
67 Properties |
| 2002 | £51,728 | 35% |
25 Properties |
| 2001 | £33,400 | - |
5 Properties |

