
Houses for sale & to rent in Whitburn and Blackburn, Bathgate
House Prices in Whitburn and Blackburn
Properties in Whitburn and Blackburn have an average house price of £168k and had 565 Property Transactions within the last 3 years¹.
Whitburn and Blackburn is an area in Bathgate, West Lothian with 8,468 households², where the most expensive property was sold for £650k.
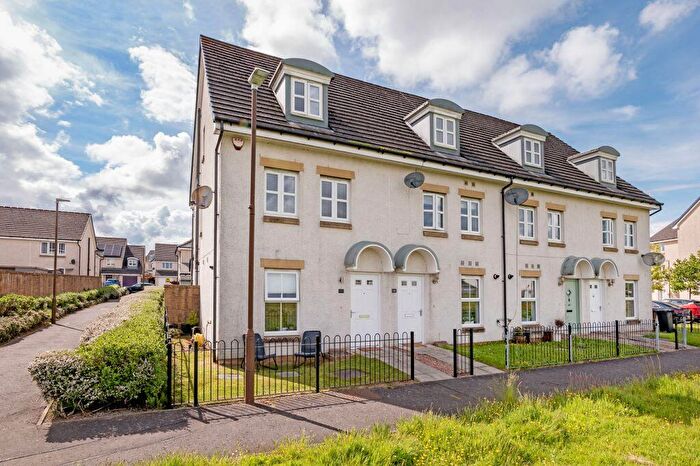
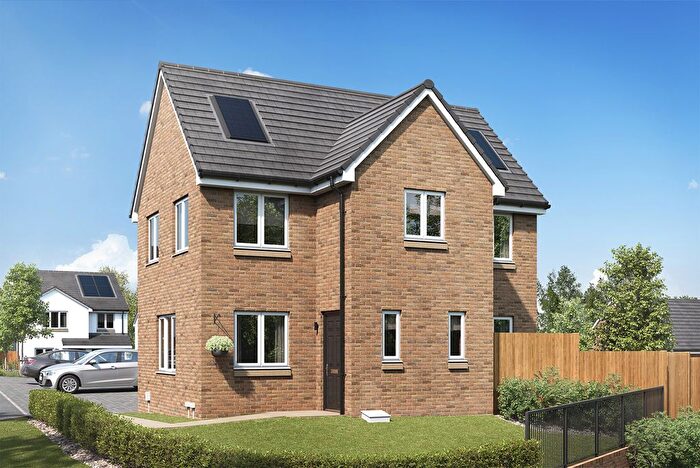
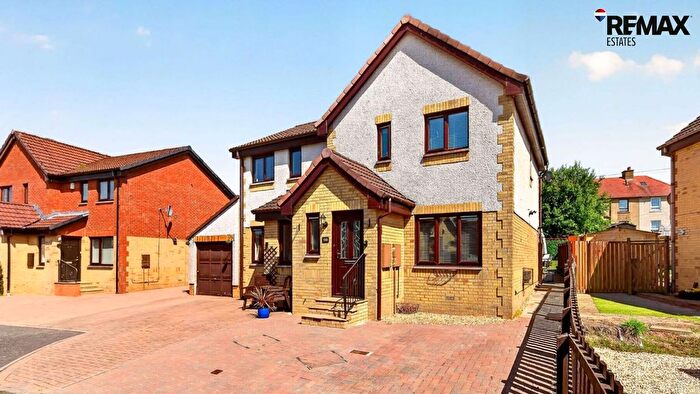
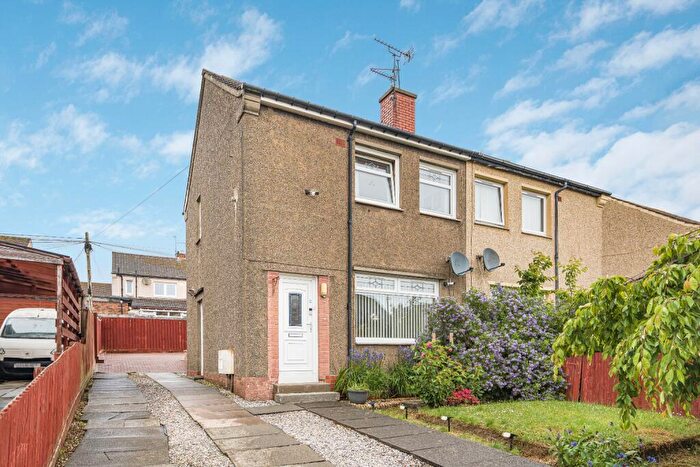
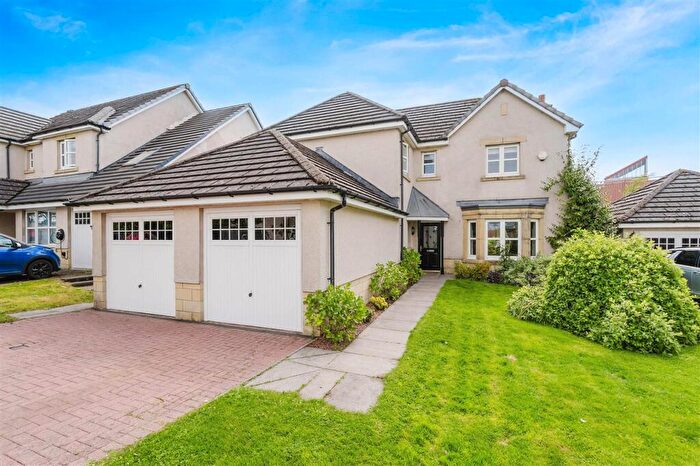
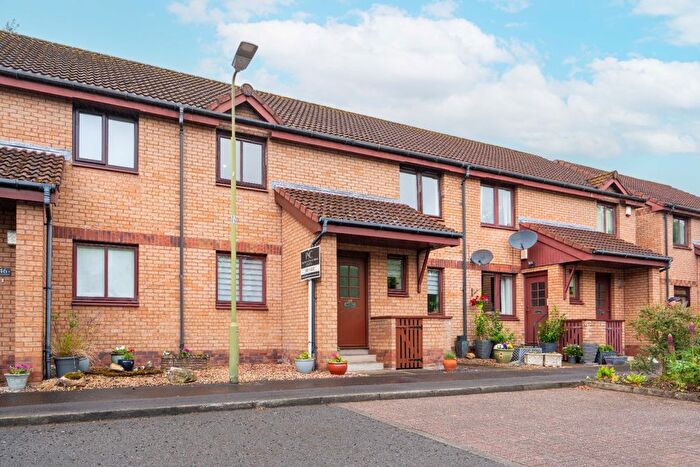
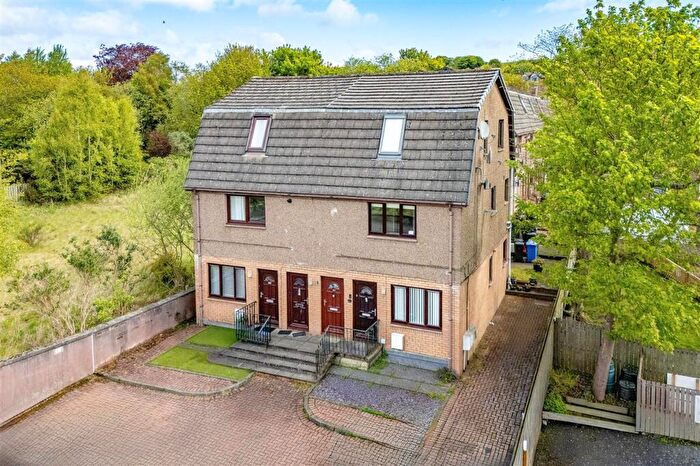
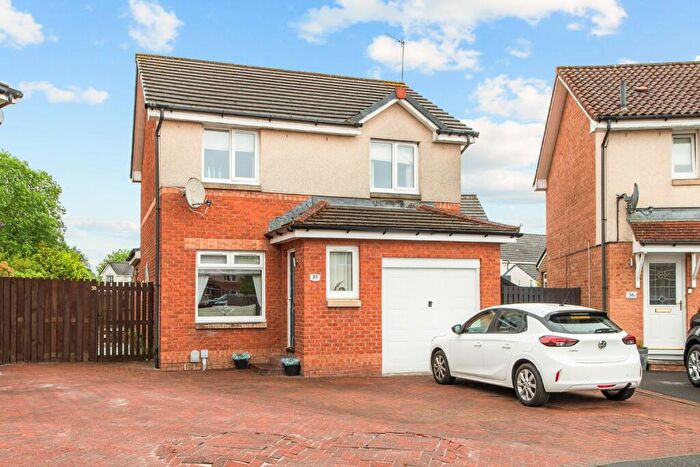
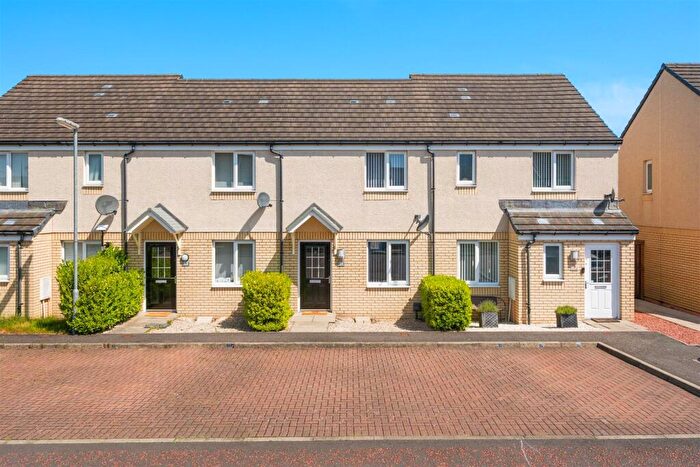
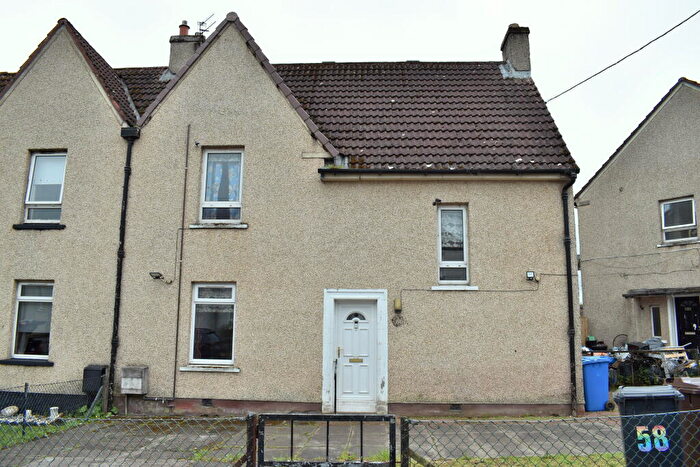
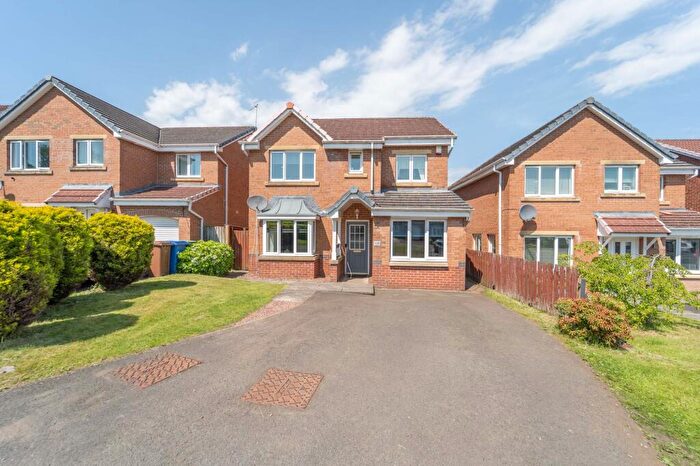
Properties for sale in Whitburn and Blackburn

![]()
If you are looking to sell your house, let it out, or receive a property valuation, an expert can help you.
Click the button below to get started.


Roads and Postcodes in Whitburn and Blackburn
Navigate through our locations to find the location of your next house in Whitburn and Blackburn, Bathgate for sale or to rent.
Transport near Whitburn and Blackburn

- FAQ
- Price Paid By Year
Frequently asked questions about Whitburn and Blackburn
What is the average price for a property for sale in Whitburn and Blackburn?
The average price for a property for sale in Whitburn and Blackburn is £168,012. This amount is 6% lower than the average price in Bathgate. There are 3,315 property listings for sale in Whitburn and Blackburn.
What streets have the most expensive properties for sale in Whitburn and Blackburn?
The streets with the most expensive properties for sale in Whitburn and Blackburn are Mains Place at an average of £572,500, Riverbank Court at an average of £460,000 and Heatherview at an average of £395,000.
What streets have the most affordable properties for sale in Whitburn and Blackburn?
The streets with the most affordable properties for sale in Whitburn and Blackburn are Mosside Drive at an average of £55,200, Wood Drive at an average of £69,250 and Townhead Gardens at an average of £69,435.
Which train stations are available in or near Whitburn and Blackburn?
Some of the train stations available in or near Whitburn and Blackburn are Armadale, Bathgate and Addiewell.
Property Price Paid in Whitburn and Blackburn by Year
The average sold property price by year was:
| Year | Average Sold Price | Price Change |
Sold Properties
|
|---|---|---|---|
| 2025 | £176,261 | 5% |
187 Properties |
| 2024 | £167,374 | 4% |
180 Properties |
| 2023 | £160,801 | -12% |
198 Properties |
| 2022 | £179,590 | 8% |
290 Properties |
| 2021 | £165,883 | 4% |
405 Properties |
| 2020 | £158,503 | 2% |
367 Properties |
| 2019 | £155,935 | 7% |
420 Properties |
| 2018 | £144,330 | 12% |
381 Properties |
| 2017 | £127,439 | 6% |
333 Properties |
| 2016 | £119,756 | -9% |
339 Properties |
| 2015 | £130,861 | 10% |
281 Properties |
| 2014 | £117,778 | 12% |
290 Properties |
| 2013 | £103,651 | -0,4% |
193 Properties |
| 2012 | £104,077 | 1% |
166 Properties |
| 2011 | £102,638 | -64% |
151 Properties |
| 2010 | £168,825 | 36% |
145 Properties |
| 2009 | £107,686 | -5% |
157 Properties |
| 2008 | £113,331 | 4% |
274 Properties |
| 2007 | £108,640 | 17% |
472 Properties |
| 2006 | £90,005 | 6% |
391 Properties |
| 2005 | £84,666 | 14% |
435 Properties |
| 2004 | £72,643 | 28% |
437 Properties |
| 2003 | £52,403 | 10% |
535 Properties |
| 2002 | £47,244 | -14% |
538 Properties |
| 2001 | £54,069 | - |
34 Properties |