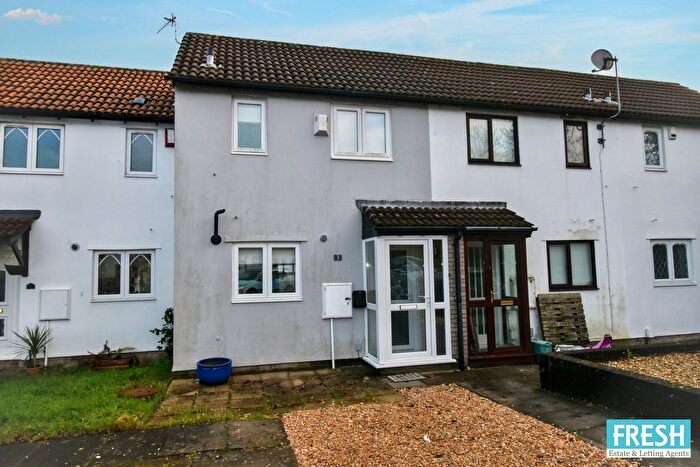
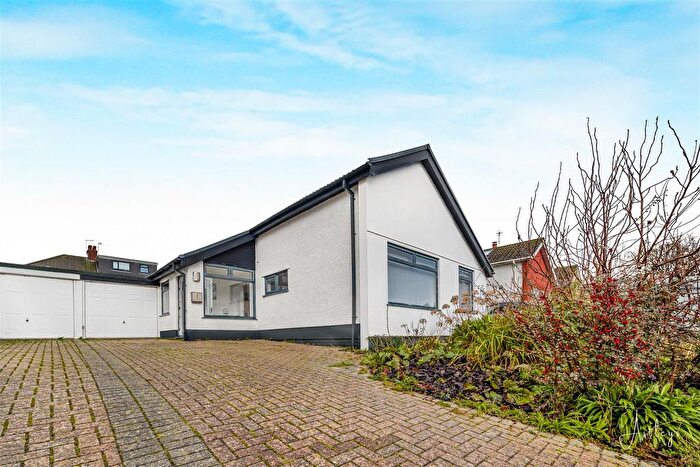
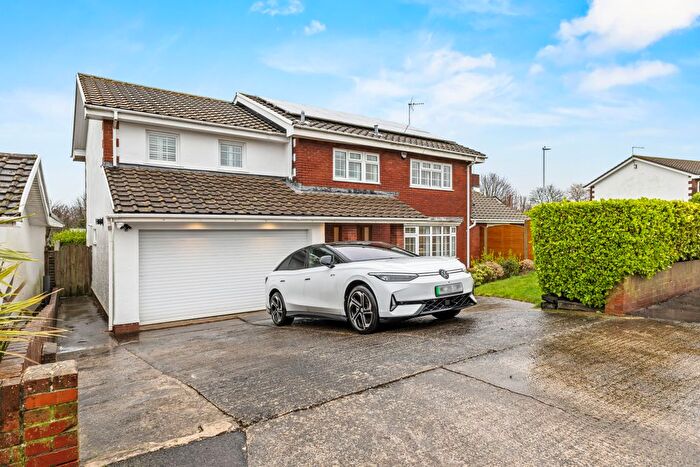
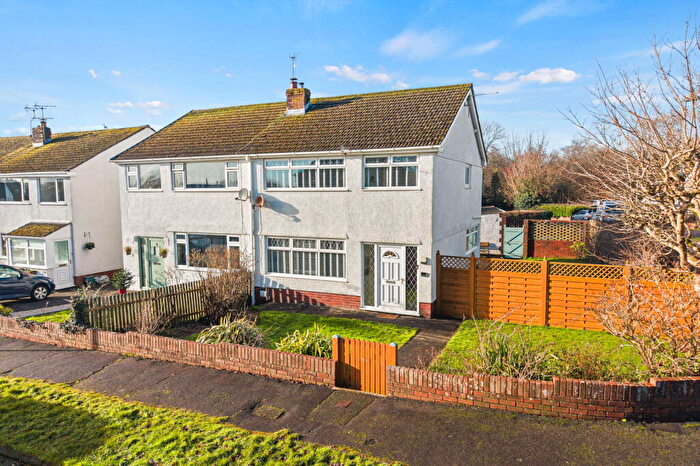
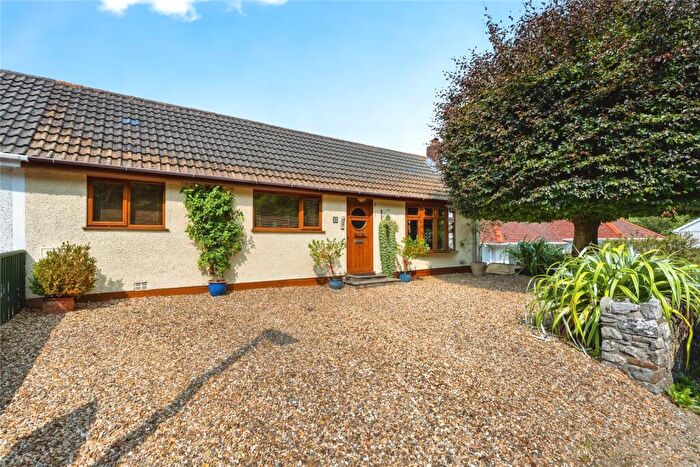
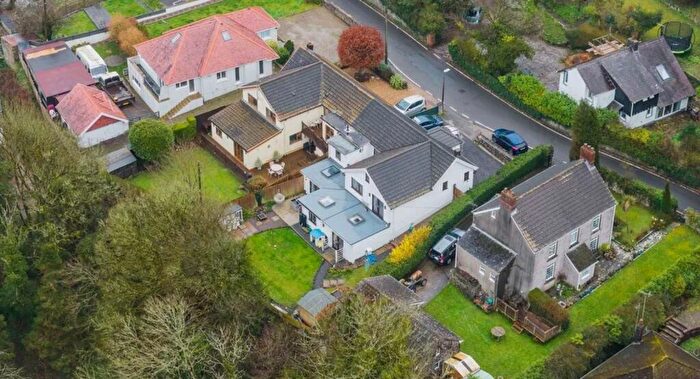
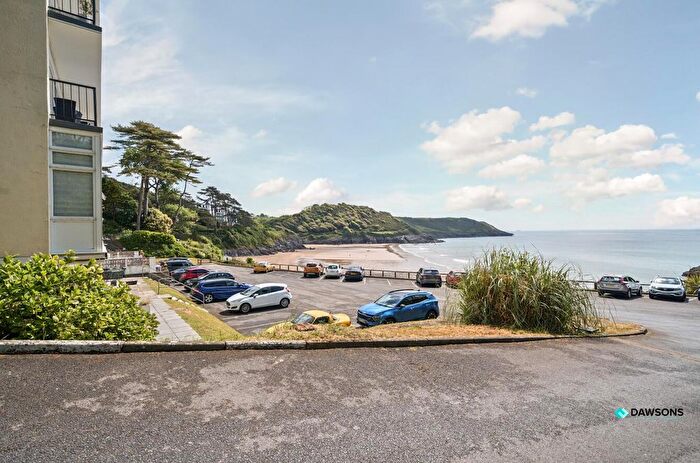
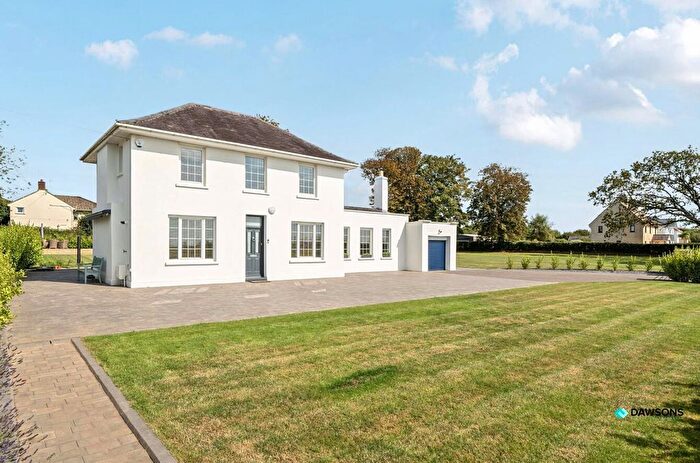
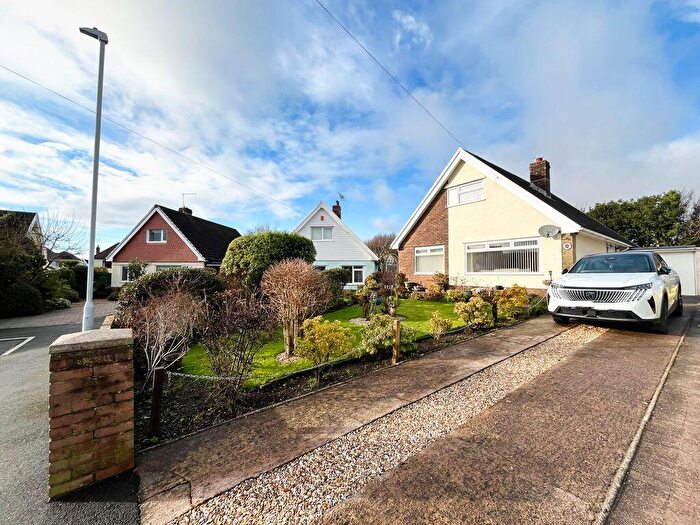
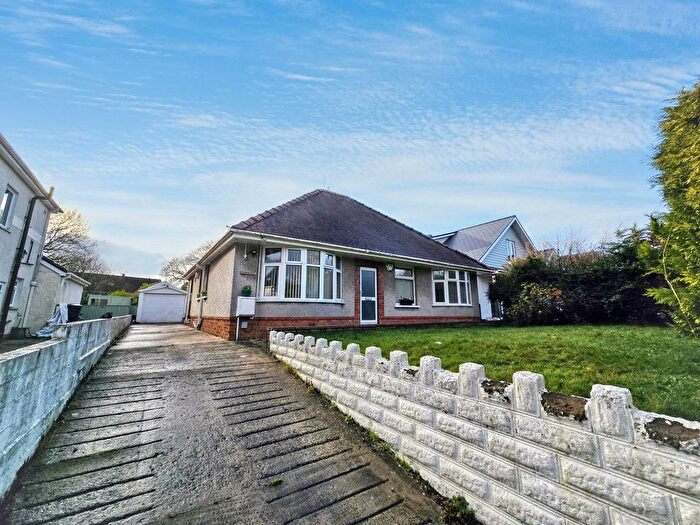
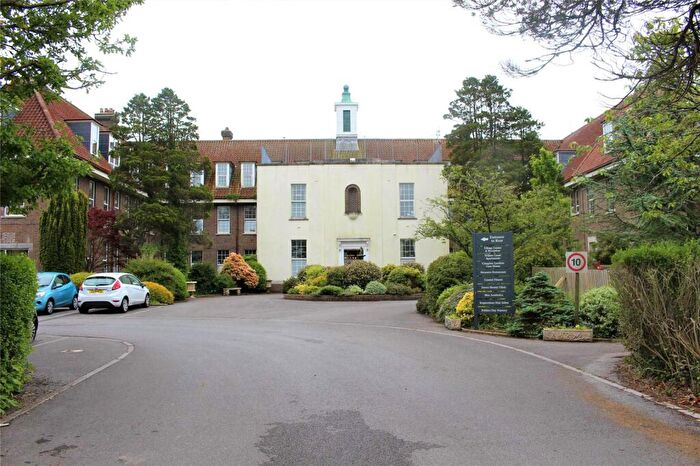
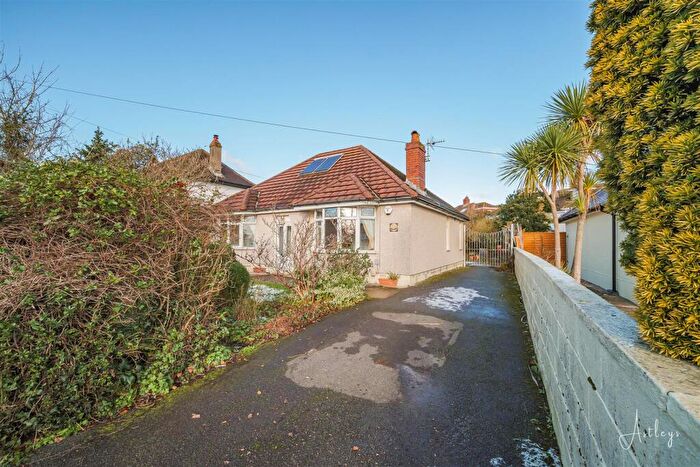
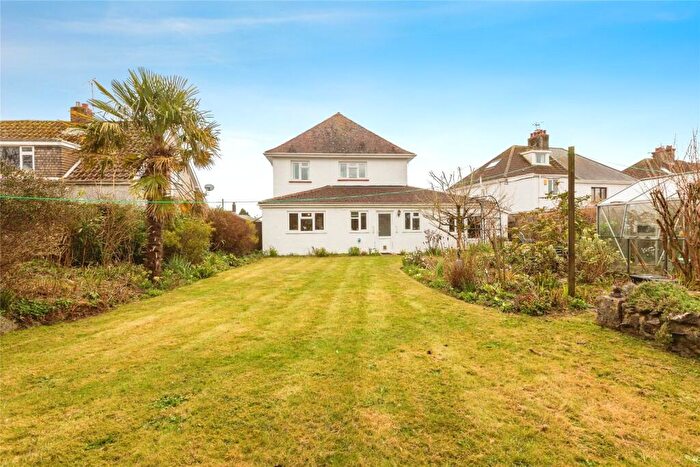
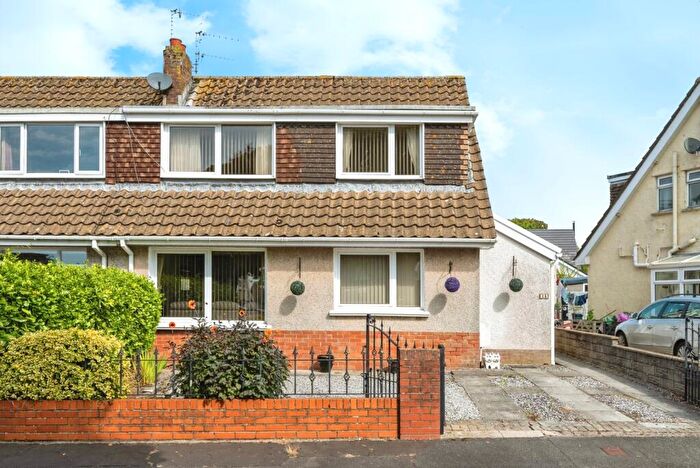
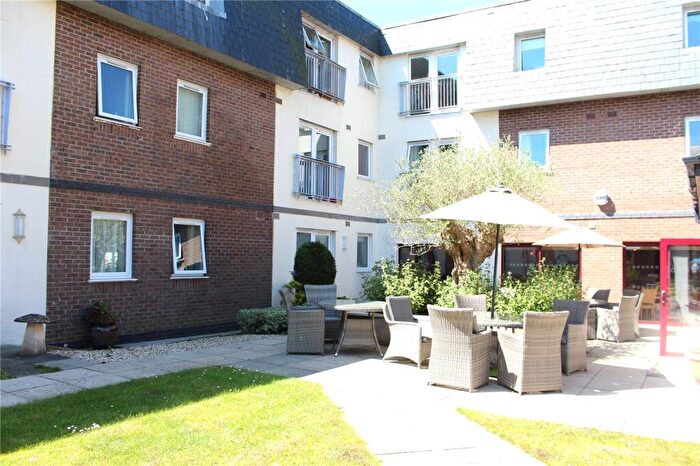
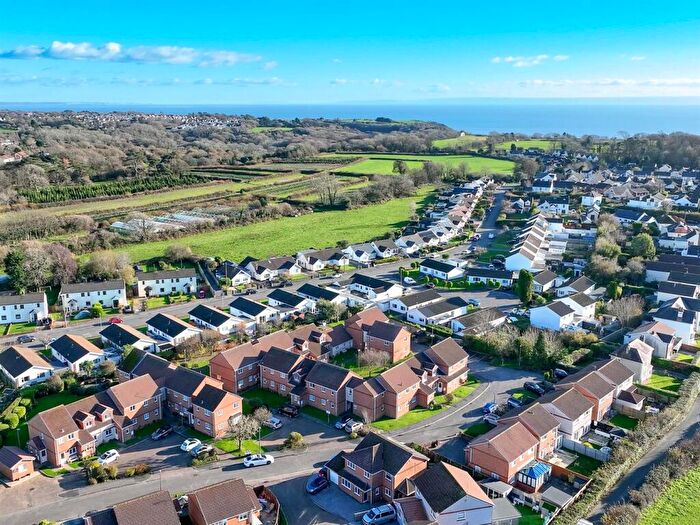
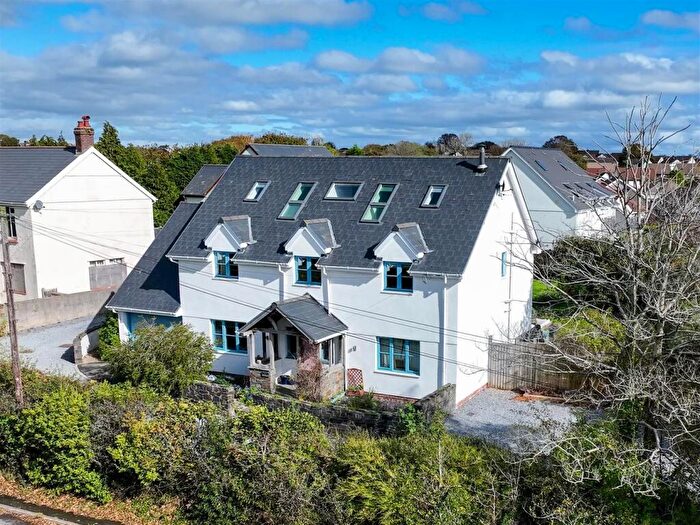
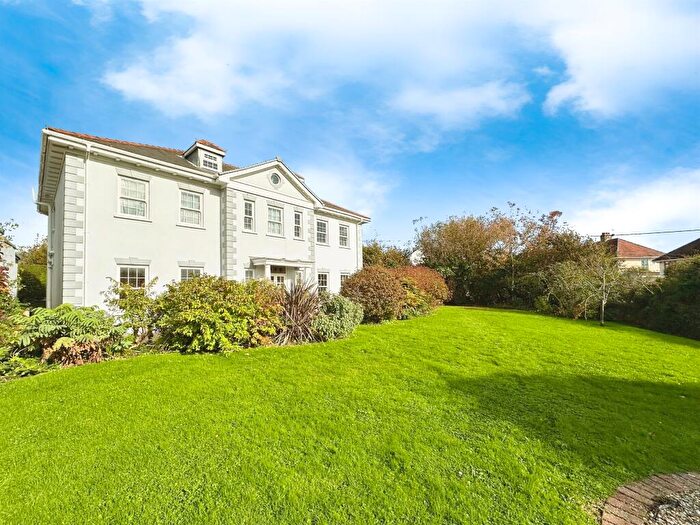
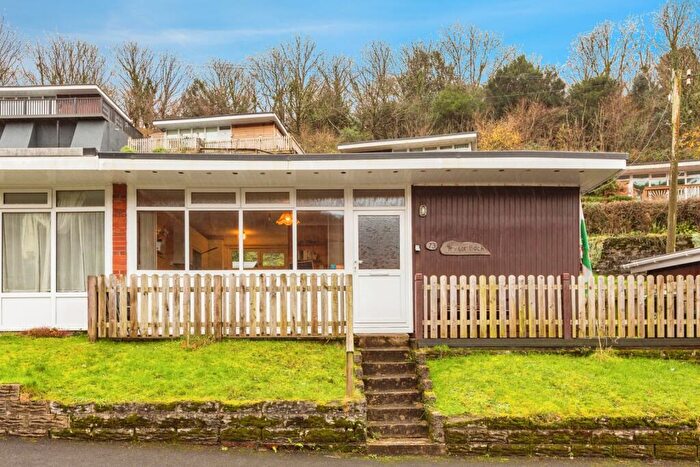
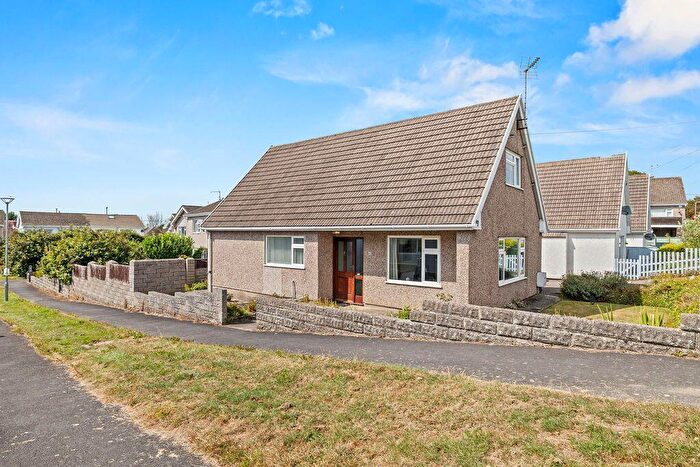
Houses for sale & to rent in Bishopston, Swansea
House Prices in Bishopston
Properties in Bishopston have an average house price of £364,224.00 and had 138 Property Transactions within the last 3 years¹.
Bishopston is an area in Swansea, Abertawe - Swansea with 1,484 households², where the most expensive property was sold for £1,150,000.00.
Properties for sale in Bishopston
Roads and Postcodes in Bishopston
Navigate through our locations to find the location of your next house in Bishopston, Swansea for sale or to rent.
| Streets | Postcodes |
|---|---|
| Bishopston Road | SA3 3EH SA3 3EJ SA3 3EN SA3 3EU SA3 3EW SA3 3EX |
| Brandy Cove Road | SA3 3HB |
| Broadmead Crescent | SA3 3BA |
| Caswell Bay | SA3 3BS SA3 3BU |
| Caswell Bay Road | SA3 3DD |
| Caswell Road | SA3 4RY |
| Church Lane | SA3 3JT |
| Clyne Common | SA3 3JB |
| Copley | SA3 3JH |
| Copley Close | SA3 3JL |
| Copley Lodge | SA3 3JJ |
| Douglas Court | SA3 3HG |
| Eastlands Park | SA3 3DG SA3 3DQ |
| Espalone | SA3 3AH |
| Gerretts Close | SA3 3HF |
| Hareslade | SA3 3DU SA3 3DX |
| Headland Close | SA3 3HE |
| Headland Road | SA3 3HD |
| Hilland Drive | SA3 3AJ |
| Holts Field | SA3 3AQ |
| Kilfield Road | SA3 3DL SA3 3DN |
| Lime Kiln Lane | SA3 3DH |
| Long Acre | SA3 3AX |
| Long Acre Court | SA3 3AY |
| Mansel Drive | SA3 3AL |
| Manselfield Road | SA3 3AG SA3 3AP SA3 3AR |
| Middle Croft Lane | SA3 3EL |
| Miles Lane | SA3 3AS |
| Northlands Park | SA3 3JW |
| Northway | SA3 3JN |
| Northway Court | SA3 3JZ |
| Ochre Wood | SA3 3DY |
| Oldway | SA3 3DE SA3 3DJ |
| Pennard Road | SA3 3JS |
| Portway | SA3 3JR |
| Providence Lane | SA3 3EZ |
| Pwlldu Lane | SA3 3HA |
| Pyle Court | SA3 3GA |
| Pyle Road | SA3 3HH SA3 3HJ |
| Redcliffe Apartments | SA3 3BT |
| Reigit Lane | SA3 3AN |
| Ridley Way | SA3 3HL |
| South Close | SA3 3ER |
| St Teilos Court | SA3 3ES |
| The Glebe | SA3 3JP |
| Tudor Court | SA3 3BB |
| Tudor Way | SA3 3AZ |
| Vensland | SA3 3ET |
| Wellfield | SA3 3EP |
| White Knight Gardens | SA3 3DR |
| Whitestone Avenue | SA3 3DA |
| Whitestone Road | SA3 3DB |
| Withy Park | SA3 3EY |
| Woodside Close | SA3 3DF |
| SA3 2AU SA3 3AT SA3 3DP SA3 3DW SA3 3AU SA3 3DS SA3 3DT SA3 3JD |
Transport near Bishopston
-
Gowerton Station
-
Swansea Station
-
Bynea Station
-
Llangennech Station
-
Llanelli Station
-
Llansamlet Station
-
Pontarddulais Station
- FAQ
- Price Paid By Year
- Property Type Price
Frequently asked questions about Bishopston
What is the average price for a property for sale in Bishopston?
The average price for a property for sale in Bishopston is £364,224. This amount is 67% higher than the average price in Swansea. There are 599 property listings for sale in Bishopston.
What streets have the most expensive properties for sale in Bishopston?
The streets with the most expensive properties for sale in Bishopston are Vensland at an average of £685,000, Wellfield at an average of £590,000 and Oldway at an average of £550,833.
What streets have the most affordable properties for sale in Bishopston?
The streets with the most affordable properties for sale in Bishopston are Clyne Common at an average of £108,323, St Teilos Court at an average of £202,250 and Redcliffe Apartments at an average of £240,625.
Which train stations are available in or near Bishopston?
Some of the train stations available in or near Bishopston are Gowerton, Swansea and Bynea.
Property Price Paid in Bishopston by Year
The average sold property price by year was:
| Year | Average Sold Price | Price Change |
Sold Properties
|
|---|---|---|---|
| 2025 | £360,603 | 0,2% |
30 Properties |
| 2024 | £359,744 | -3% |
51 Properties |
| 2023 | £370,138 | 7% |
57 Properties |
| 2022 | £344,042 | 1% |
63 Properties |
| 2021 | £340,077 | 9% |
64 Properties |
| 2020 | £310,304 | -0,1% |
69 Properties |
| 2019 | £310,686 | 11% |
69 Properties |
| 2018 | £277,291 | 14% |
63 Properties |
| 2017 | £237,530 | -9% |
66 Properties |
| 2016 | £258,088 | -12% |
76 Properties |
| 2015 | £287,838 | 21% |
79 Properties |
| 2014 | £228,285 | -14% |
73 Properties |
| 2013 | £260,434 | 6% |
61 Properties |
| 2012 | £244,851 | 21% |
50 Properties |
| 2011 | £192,504 | -28% |
62 Properties |
| 2010 | £246,401 | 16% |
56 Properties |
| 2009 | £205,803 | -10% |
44 Properties |
| 2008 | £227,018 | -15% |
33 Properties |
| 2007 | £261,342 | 3% |
75 Properties |
| 2006 | £252,950 | 8% |
60 Properties |
| 2005 | £231,762 | -2% |
34 Properties |
| 2004 | £237,505 | 19% |
39 Properties |
| 2003 | £193,344 | 24% |
47 Properties |
| 2002 | £147,268 | 16% |
81 Properties |
| 2001 | £123,713 | 6% |
57 Properties |
| 2000 | £116,262 | 17% |
69 Properties |
| 1999 | £96,147 | 7% |
58 Properties |
| 1998 | £89,341 | -2% |
65 Properties |
| 1997 | £91,004 | 12% |
85 Properties |
| 1996 | £79,858 | -0,2% |
54 Properties |
| 1995 | £79,980 | - |
44 Properties |
Property Price per Property Type in Bishopston
Here you can find historic sold price data in order to help with your property search.
The average Property Paid Price for specific property types in the last three years are:
| Property Type | Average Sold Price | Sold Properties |
|---|---|---|
| Semi Detached House | £366,014.00 | 31 Semi Detached Houses |
| Detached House | £482,190.00 | 70 Detached Houses |
| Flat | £135,962.00 | 35 Flats |
| Terraced House | £202,250.00 | 2 Terraced Houses |

