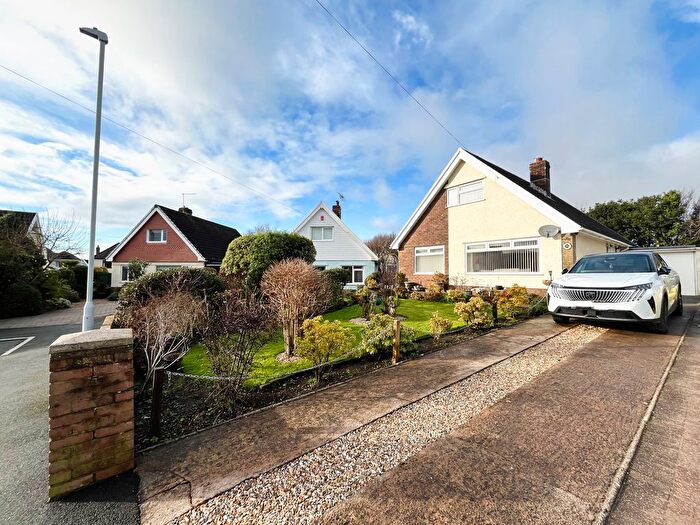
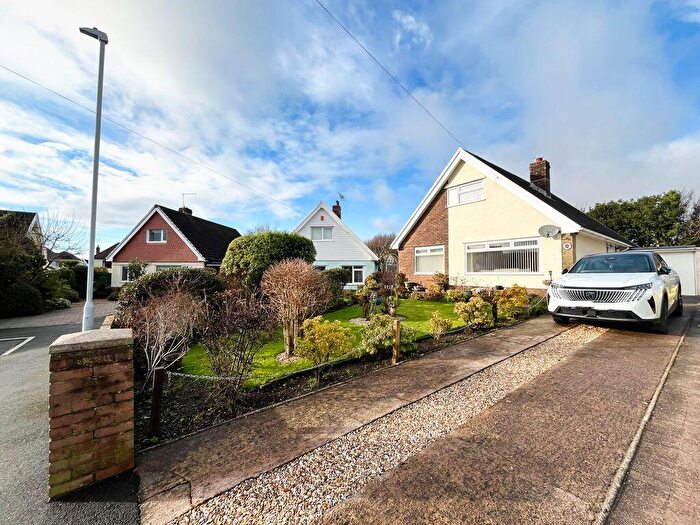
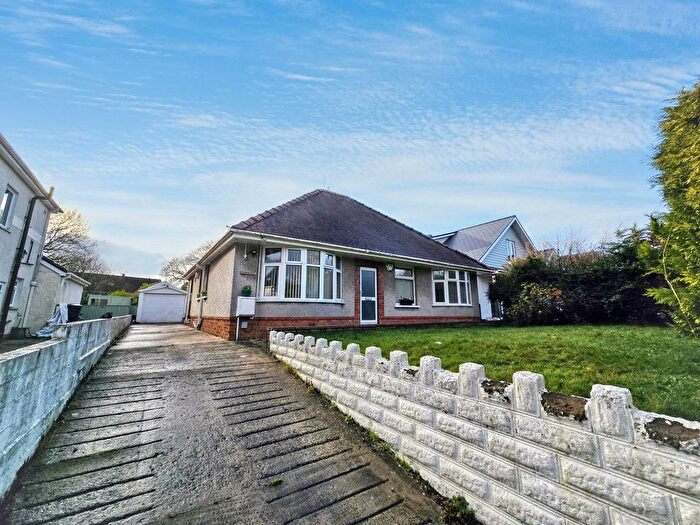
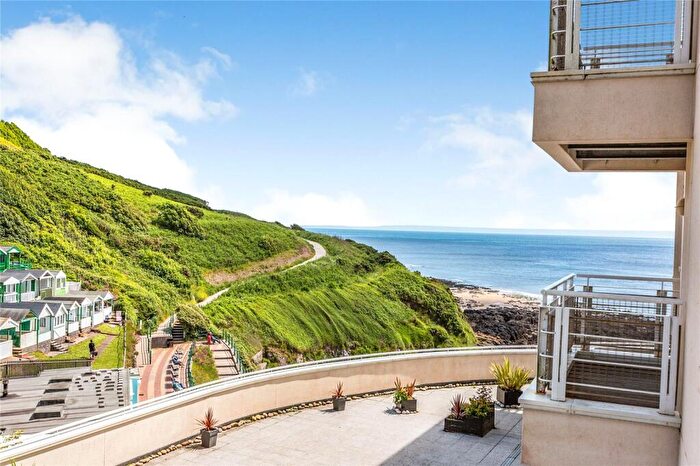
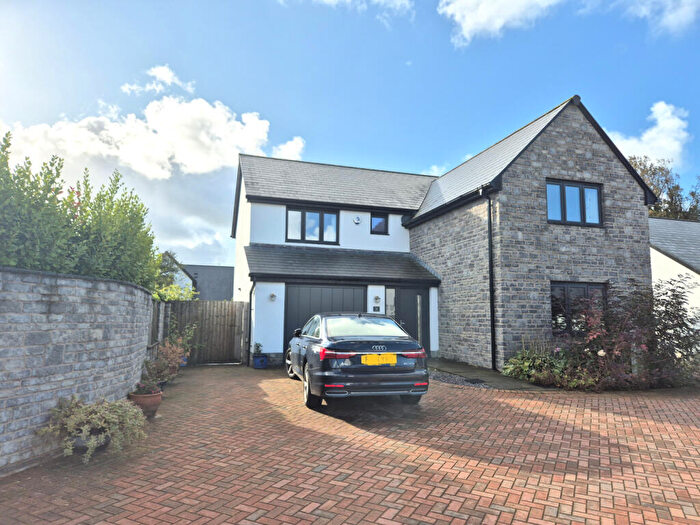
Houses for sale & to rent in Newton, Swansea
House Prices in Newton
Properties in Newton have an average house price of £468,467.00 and had 218 Property Transactions within the last 3 years¹.
Newton is an area in Swansea, Abertawe - Swansea with 1,491 households², where the most expensive property was sold for £2,470,000.00.
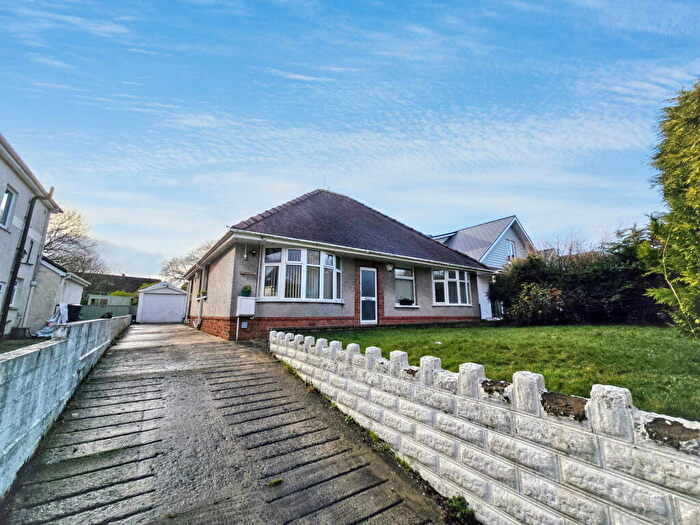
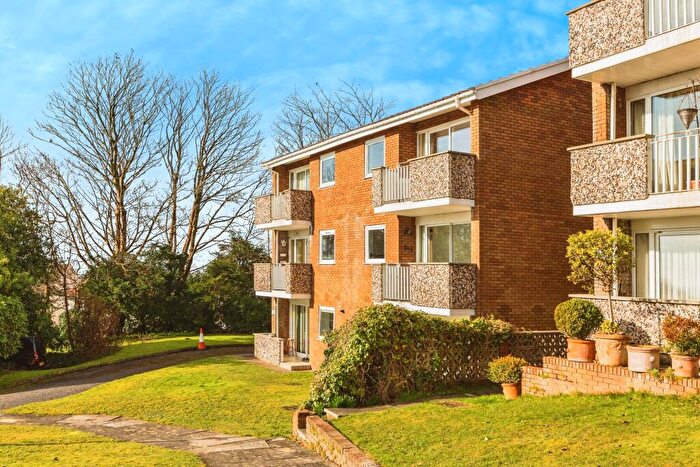
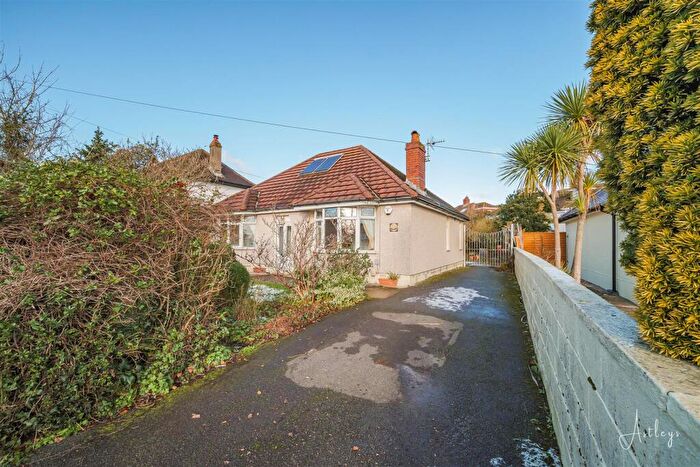
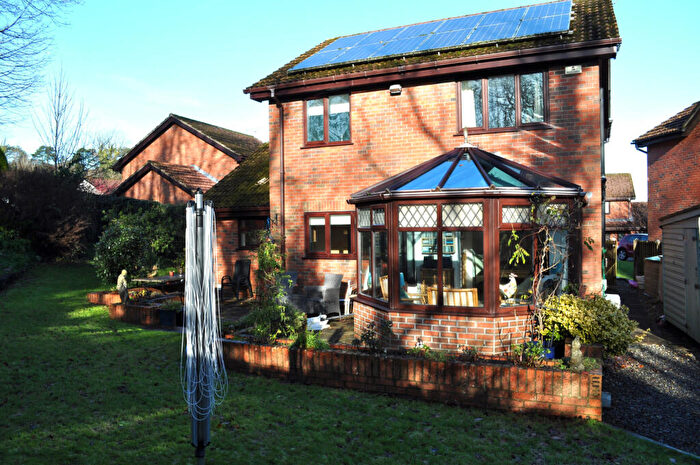
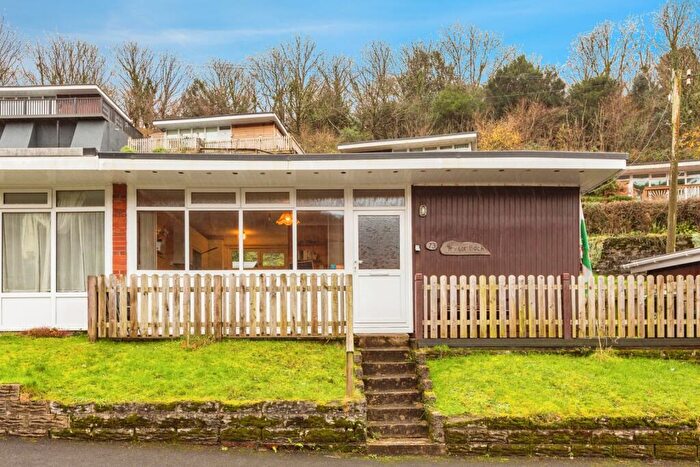
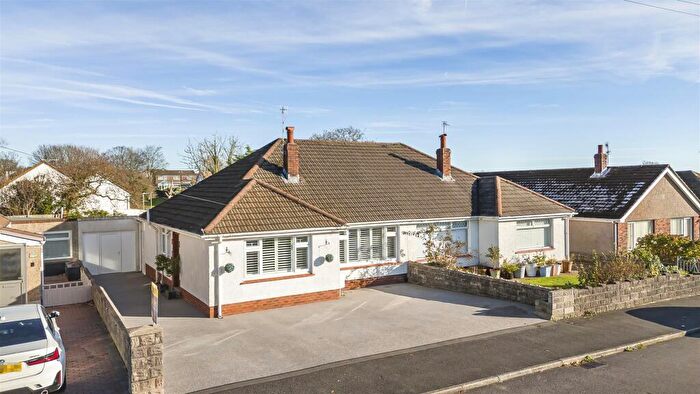
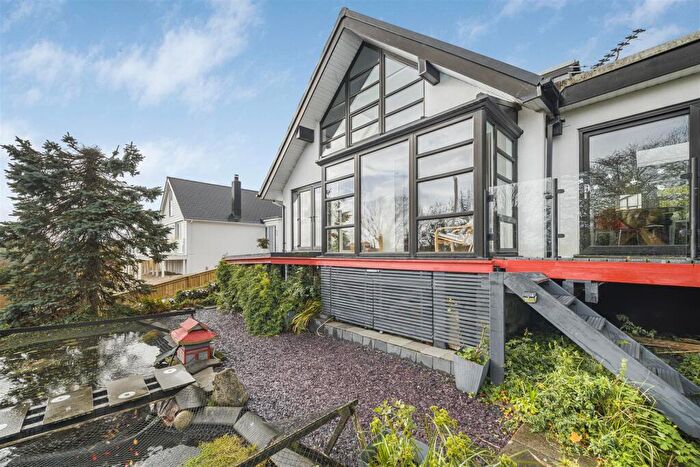
Properties for sale in Newton
Roads and Postcodes in Newton
Navigate through our locations to find the location of your next house in Newton, Swansea for sale or to rent.
| Streets | Postcodes |
|---|---|
| Bishops Wood Grove | SA3 4BP |
| Bramley Drive | SA3 4UP |
| Briarwood Gardens | SA3 4RG |
| Brooklyn Terrace | SA3 4SP |
| Bryncerdin Road | SA3 4UB |
| Brynfield Court | SA3 4TF |
| Brynfield Road | SA3 4SX SA3 4SQ |
| Caswell Avenue | SA3 4RU |
| Caswell Bay | SA3 3BN |
| Caswell Drive | SA3 4RJ SA3 4RN SA3 4RW |
| Caswell Road | SA3 4RA SA3 4RH SA3 4SD |
| Clifflands Close | SA3 4LT |
| Coltshill Drive | SA3 4SN |
| Crawshay Court | SA3 4QZ |
| Crestacre Close | SA3 4UR |
| Croftfield Crescent | SA3 4UL |
| Fairhaven Court | SA3 4QY |
| Groves Avenue | SA3 4QF SA3 4QX |
| Havergal Close | SA3 4RL |
| Highcliffe Court | SA3 4TQ |
| Highmead Close | SA3 4TZ |
| Highpool Close | SA3 4TU |
| Highpool Lane | SA3 4TT SA3 4TX |
| Hillgrove | SA3 4RE SA3 4RQ |
| Lady Housty Avenue | SA3 4TS |
| Land Associated With | SA3 4QR |
| Langland Bay Road | SA3 4QH SA3 4QP SA3 4QQ |
| Langland Court Road | SA3 4TB SA3 4AZ |
| Langland Grove | SA3 4SF |
| Langland Road | SA3 4QB |
| Linkside | SA3 4SZ |
| Llwyn Y Mor | SA3 4RD |
| Long Shepherds Drive | SA3 4RP |
| Mary Twill Lane | SA3 4RB |
| Melcorn Drive | SA3 4UN |
| Millands Close | SA3 4SE |
| Mixen Close | SA3 4US |
| Moorland Avenue | SA3 4UA |
| Murton Lane | SA3 3AA SA3 4TR |
| New Well Lane | SA3 4SR |
| Newton Court | SA3 4UX |
| Newton Road | SA3 4ST SA3 4SW SA3 4TG SA3 4UD |
| Newton Villas | SA3 4SS |
| Nottage Mews | SA3 4SJ |
| Nottage Road | SA3 4SU |
| Owensfield | SA3 4LA |
| Picket Mead Road | SA3 4SA |
| Rotherslade Road | SA3 4QA SA3 4QN SA3 4QW |
| Sherringham Drive | SA3 4UG |
| Slade Road | SA3 4UE SA3 4UF |
| Southward Lane | SA3 4QD SA3 4QE SA3 4QS |
| St Peters Road | SA3 4SB |
| Summercliff Chalets | SA3 3BP SA3 3BR |
| Summerland Lane | SA3 4RS SA3 4RX SA3 4UJ |
| The Mount | SA3 4QJ |
| The Orchard | SA3 4UQ |
| Westwinds | SA3 4TA |
| Whiteshell Drive | SA3 4SY |
| Whitestone Lane | SA3 4UH |
| Woodend Lane | SA3 4QG |
| Woodridge Court | SA3 4TH |
| Woolacott Mews | SA3 4RZ |
| Woollacott Drive | SA3 4RR |
| SA3 4RF SA3 4BS SA3 4RT |
Transport near Newton
-
Swansea Station
-
Gowerton Station
-
Bynea Station
-
Llansamlet Station
-
Llangennech Station
-
Baglan Station
-
Llanelli Station
-
Skewen Station
-
Briton Ferry Station
- FAQ
- Price Paid By Year
- Property Type Price
Frequently asked questions about Newton
What is the average price for a property for sale in Newton?
The average price for a property for sale in Newton is £468,467. This amount is 115% higher than the average price in Swansea. There are 774 property listings for sale in Newton.
What streets have the most expensive properties for sale in Newton?
The streets with the most expensive properties for sale in Newton are Langland Court Road at an average of £1,010,000, Murton Lane at an average of £977,500 and Newton Villas at an average of £865,000.
What streets have the most affordable properties for sale in Newton?
The streets with the most affordable properties for sale in Newton are Summercliff Chalets at an average of £140,899, Llwyn Y Mor at an average of £166,125 and Brynfield Court at an average of £185,000.
Which train stations are available in or near Newton?
Some of the train stations available in or near Newton are Swansea, Gowerton and Bynea.
Property Price Paid in Newton by Year
The average sold property price by year was:
| Year | Average Sold Price | Price Change |
Sold Properties
|
|---|---|---|---|
| 2025 | £451,410 | -13% |
34 Properties |
| 2024 | £508,165 | 10% |
62 Properties |
| 2023 | £459,810 | 2% |
50 Properties |
| 2022 | £448,349 | -1% |
72 Properties |
| 2021 | £451,095 | 8% |
107 Properties |
| 2020 | £413,444 | 18% |
61 Properties |
| 2019 | £337,032 | -12% |
70 Properties |
| 2018 | £376,060 | 5% |
60 Properties |
| 2017 | £358,073 | 7% |
76 Properties |
| 2016 | £332,503 | -5% |
65 Properties |
| 2015 | £347,919 | 0,1% |
63 Properties |
| 2014 | £347,600 | -15% |
67 Properties |
| 2013 | £401,061 | 19% |
66 Properties |
| 2012 | £324,722 | 7% |
64 Properties |
| 2011 | £303,419 | -25% |
56 Properties |
| 2010 | £379,724 | 24% |
60 Properties |
| 2009 | £287,360 | 2% |
53 Properties |
| 2008 | £280,482 | -10% |
56 Properties |
| 2007 | £308,865 | 8% |
87 Properties |
| 2006 | £285,138 | 2% |
82 Properties |
| 2005 | £278,029 | 9% |
89 Properties |
| 2004 | £252,677 | 27% |
50 Properties |
| 2003 | £185,605 | 25% |
85 Properties |
| 2002 | £139,916 | 4% |
95 Properties |
| 2001 | £134,505 | 14% |
89 Properties |
| 2000 | £115,717 | 14% |
85 Properties |
| 1999 | £98,953 | 3% |
79 Properties |
| 1998 | £96,307 | 4% |
87 Properties |
| 1997 | £92,065 | -1% |
75 Properties |
| 1996 | £92,610 | 2% |
61 Properties |
| 1995 | £91,069 | - |
53 Properties |
Property Price per Property Type in Newton
Here you can find historic sold price data in order to help with your property search.
The average Property Paid Price for specific property types in the last three years are:
| Property Type | Average Sold Price | Sold Properties |
|---|---|---|
| Semi Detached House | £399,081.00 | 43 Semi Detached Houses |
| Detached House | £674,282.00 | 91 Detached Houses |
| Terraced House | £313,827.00 | 29 Terraced Houses |
| Flat | £263,719.00 | 55 Flats |

