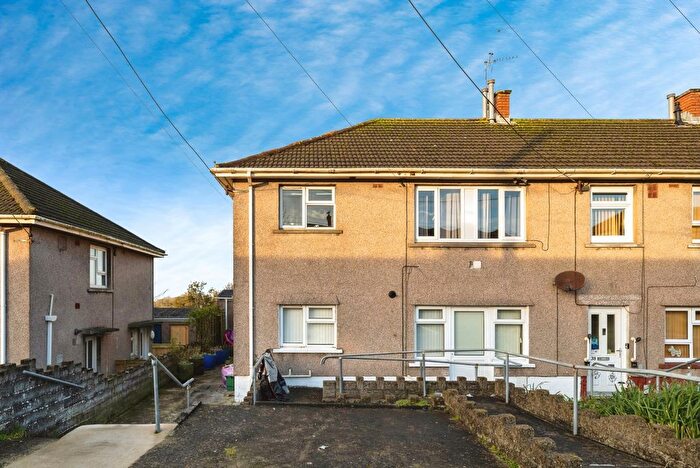
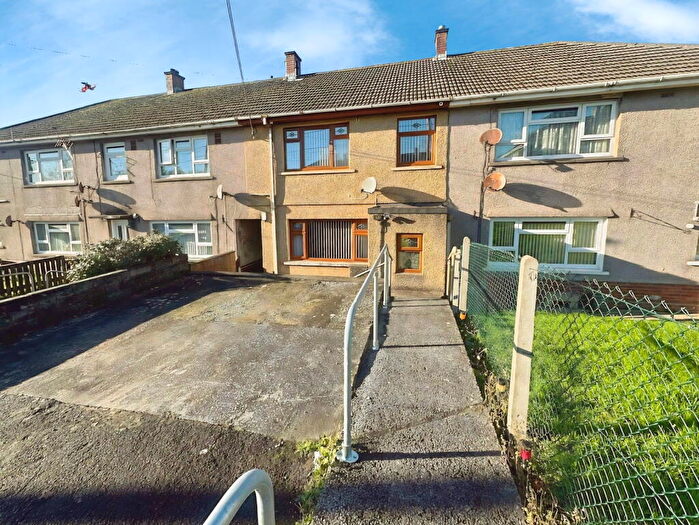
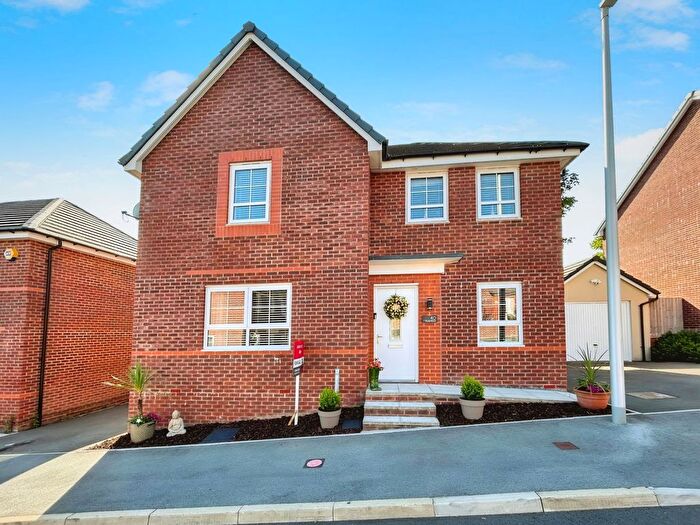
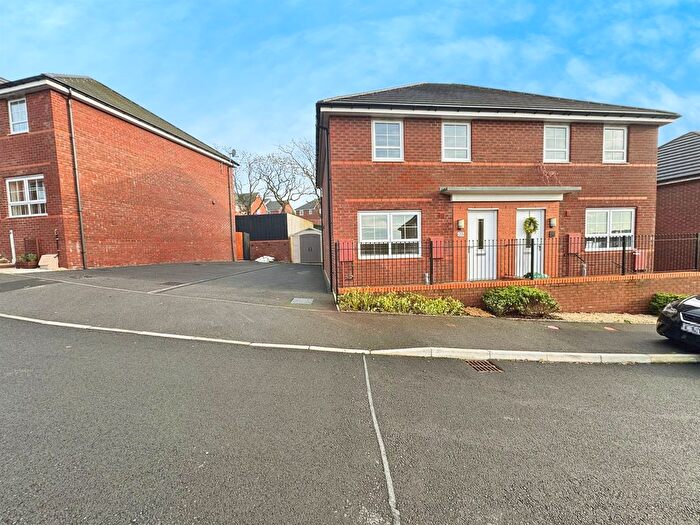
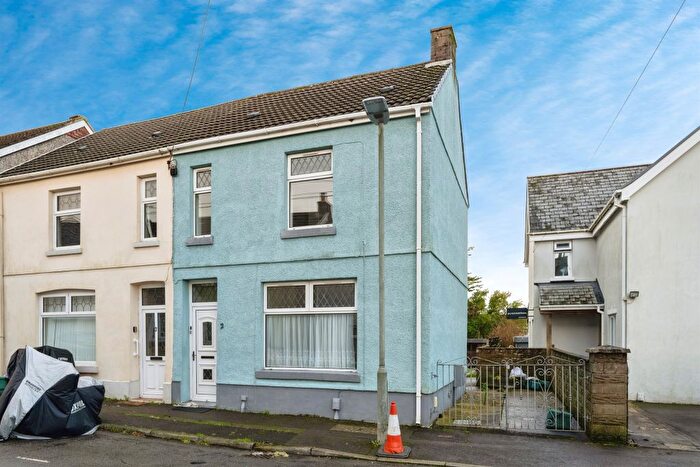
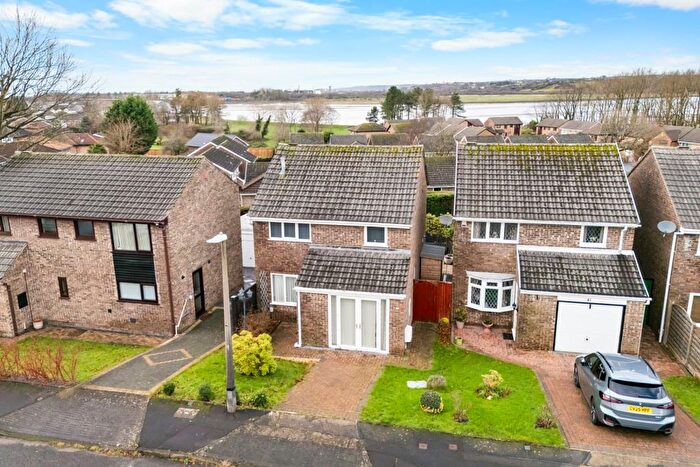
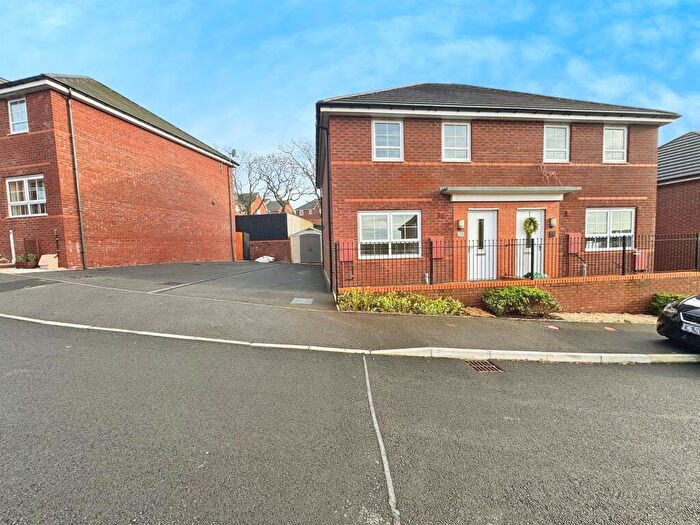
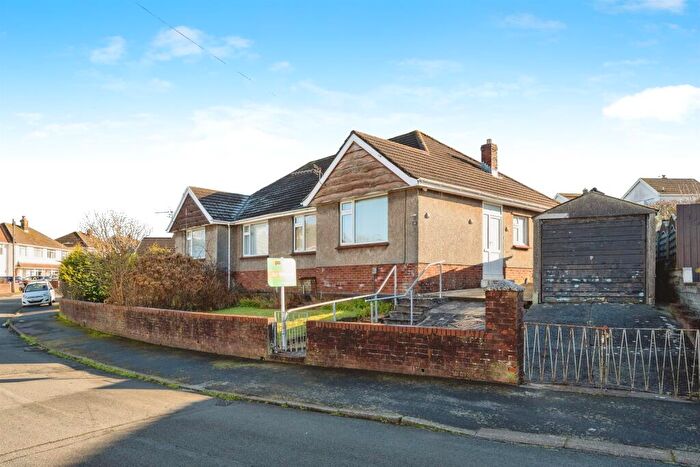
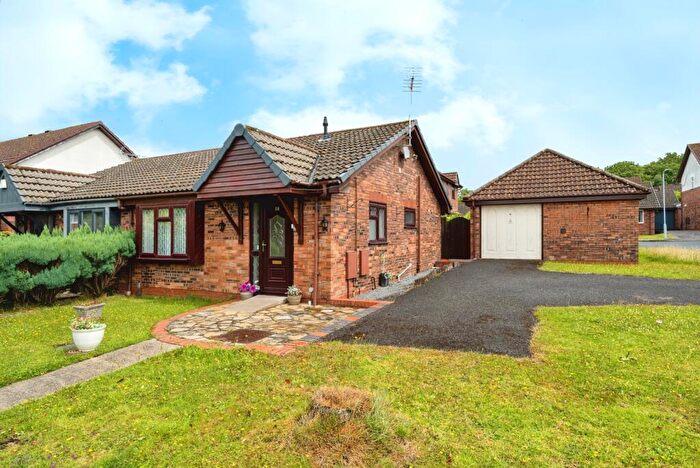
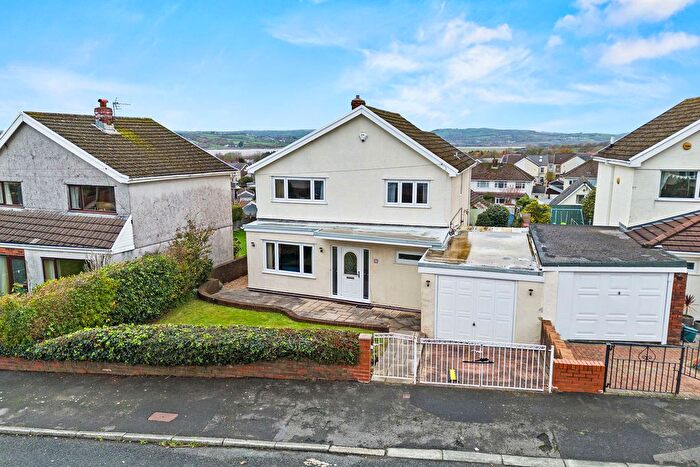
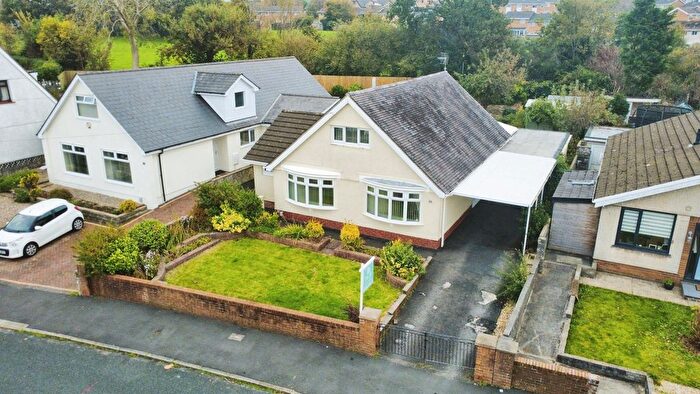
Houses for sale & to rent in Lower Loughor, Swansea
House Prices in Lower Loughor
Properties in Lower Loughor have an average house price of £196,693.00 and had 89 Property Transactions within the last 3 years¹.
Lower Loughor is an area in Swansea, Abertawe - Swansea with 1,018 households², where the most expensive property was sold for £500,000.00.
Properties for sale in Lower Loughor
Previously listed properties in Lower Loughor
Roads and Postcodes in Lower Loughor
Navigate through our locations to find the location of your next house in Lower Loughor, Swansea for sale or to rent.
| Streets | Postcodes |
|---|---|
| Beili Glas | SA4 6UE |
| Bryn Rhosog | SA4 6SH |
| Brynllwchwr Road | SA4 6SG SA4 6SQ |
| Brynvernel | SA4 6ST |
| Bwrw Road | SA4 6TX |
| Cae Castell | SA4 6UJ |
| Castle Court | SA4 6UN |
| Castle Grove | SA4 6TL |
| Castle Street | SA4 6TS SA4 6TU |
| Clare Court | SA4 6UH |
| Clos Rhandir | SA4 6UF |
| Culfor Road | SA4 6TY SA4 6TZ SA4 6UA |
| Dock Street | SA4 6TP |
| Ferndale Drive | SA4 6UR |
| Ferry Road | SA4 6TT |
| Glanymor Lane | SA4 6RW |
| Glanymor Park Drive | SA4 6UQ |
| Glebe Road | SA4 6SJ SA4 6SL |
| Gwydr Place | SA4 6TW |
| Gwydr Villas | SA4 6TN |
| Heol Ffynnon | SA4 6SU |
| Heol Maes Y Cerrig | SA4 6SN SA4 6SW |
| Heol Pen Y Beili | SA4 6SP |
| Heol Y Llan | SA4 6UG |
| Heol Y Wern | SA4 6JE |
| Landor Drive | SA4 6GL |
| Leucarum Court | SA4 6AB |
| Llys-y-coed | SA4 6XR |
| Park View | SA4 6UP |
| Station Road | SA4 6TR |
| Taliesin Place | SA4 6GJ |
| The Croft | SA4 6TB |
| Ty Myrtwydd | SA4 6TG |
| Vaughan Place | SA4 6GG |
Transport near Lower Loughor
- FAQ
- Price Paid By Year
- Property Type Price
Frequently asked questions about Lower Loughor
What is the average price for a property for sale in Lower Loughor?
The average price for a property for sale in Lower Loughor is £196,693. This amount is 10% lower than the average price in Swansea. There are 378 property listings for sale in Lower Loughor.
What streets have the most expensive properties for sale in Lower Loughor?
The streets with the most expensive properties for sale in Lower Loughor are Castle Grove at an average of £500,000, The Croft at an average of £367,500 and Clare Court at an average of £295,000.
What streets have the most affordable properties for sale in Lower Loughor?
The streets with the most affordable properties for sale in Lower Loughor are Bryn Rhosog at an average of £75,250, Beili Glas at an average of £82,500 and Heol Y Llan at an average of £130,000.
Which train stations are available in or near Lower Loughor?
Some of the train stations available in or near Lower Loughor are Bynea, Gowerton and Llangennech.
Property Price Paid in Lower Loughor by Year
The average sold property price by year was:
| Year | Average Sold Price | Price Change |
Sold Properties
|
|---|---|---|---|
| 2025 | £238,764 | 24% |
17 Properties |
| 2024 | £180,822 | 3% |
22 Properties |
| 2023 | £175,059 | -17% |
26 Properties |
| 2022 | £204,876 | 11% |
24 Properties |
| 2021 | £181,417 | 15% |
35 Properties |
| 2020 | £154,891 | 14% |
32 Properties |
| 2019 | £132,998 | -1% |
28 Properties |
| 2018 | £133,689 | -20% |
29 Properties |
| 2017 | £160,559 | 15% |
32 Properties |
| 2016 | £136,118 | -2% |
42 Properties |
| 2015 | £138,685 | 9% |
35 Properties |
| 2014 | £126,118 | - |
29 Properties |
| 2013 | £126,173 | -9% |
23 Properties |
| 2012 | £137,974 | 15% |
20 Properties |
| 2011 | £116,599 | 1% |
15 Properties |
| 2010 | £115,339 | -12% |
25 Properties |
| 2009 | £129,272 | 4% |
35 Properties |
| 2008 | £124,185 | -10% |
30 Properties |
| 2007 | £136,895 | -4% |
36 Properties |
| 2006 | £142,124 | 9% |
45 Properties |
| 2005 | £129,667 | 15% |
43 Properties |
| 2004 | £110,038 | 18% |
36 Properties |
| 2003 | £89,819 | 6% |
53 Properties |
| 2002 | £84,186 | 13% |
88 Properties |
| 2001 | £73,518 | 24% |
64 Properties |
| 2000 | £55,908 | 2% |
22 Properties |
| 1999 | £54,804 | -3% |
22 Properties |
| 1998 | £56,711 | 21% |
22 Properties |
| 1997 | £45,000 | 1% |
23 Properties |
| 1996 | £44,355 | -1% |
31 Properties |
| 1995 | £44,640 | - |
24 Properties |
Property Price per Property Type in Lower Loughor
Here you can find historic sold price data in order to help with your property search.
The average Property Paid Price for specific property types in the last three years are:
| Property Type | Average Sold Price | Sold Properties |
|---|---|---|
| Semi Detached House | £176,210.00 | 39 Semi Detached Houses |
| Detached House | £275,960.00 | 26 Detached Houses |
| Terraced House | £156,550.00 | 20 Terraced Houses |
| Flat | £81,875.00 | 4 Flats |

