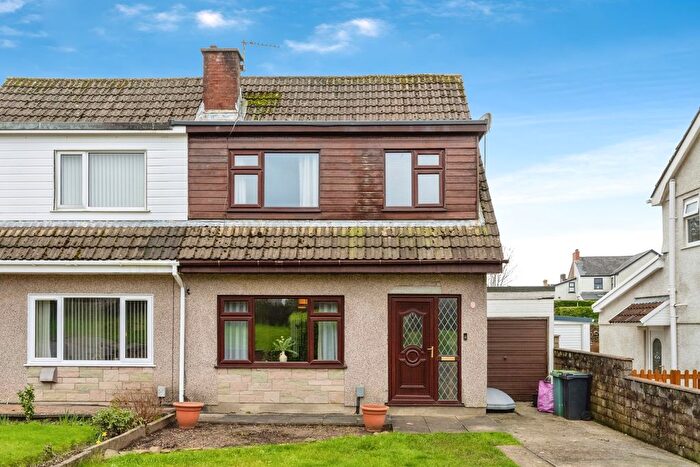
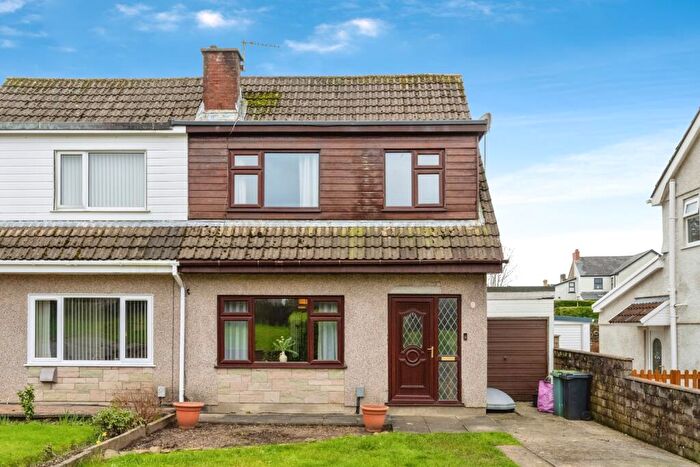
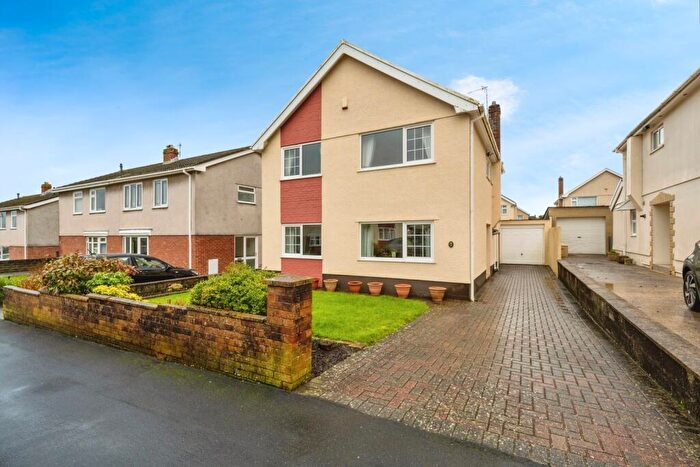
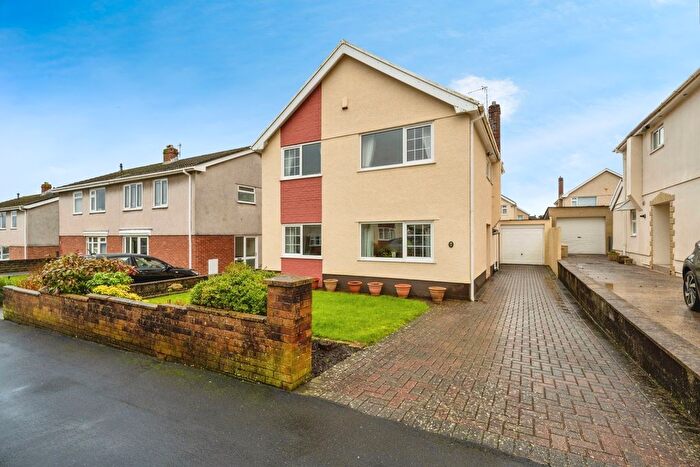
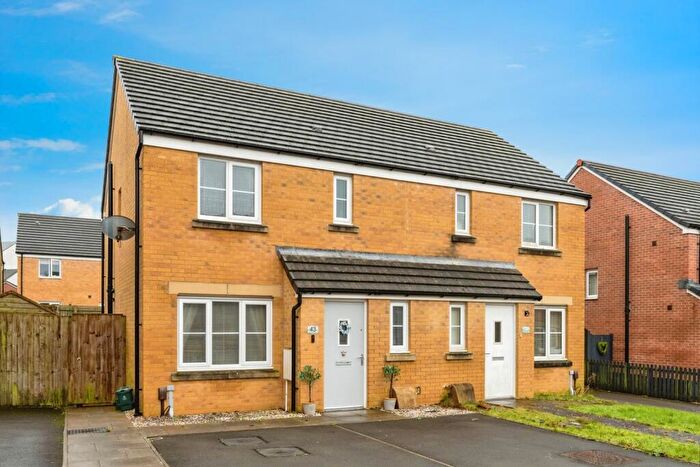
Houses for sale & to rent in Upper Loughor, Swansea
House Prices in Upper Loughor
Properties in Upper Loughor have an average house price of £201,284.00 and had 123 Property Transactions within the last 3 years¹.
Upper Loughor is an area in Swansea, Abertawe - Swansea with 1,125 households², where the most expensive property was sold for £640,000.00.
Properties for sale in Upper Loughor
Roads and Postcodes in Upper Loughor
Navigate through our locations to find the location of your next house in Upper Loughor, Swansea for sale or to rent.
| Streets | Postcodes |
|---|---|
| Banfield Terrace | SA4 6TF |
| Belgrave Road | SA4 6RF |
| Borough Road | SA4 6RP SA4 6RT SA4 6RY SA4 6RZ |
| Broadoak Court | SA4 6SB |
| Bryn Road | SA4 6PG SA4 6PR SA4 4PQ |
| Brynymor Road | SA4 6TD |
| Bwlch Road | SA4 6TA |
| Corporation Road | SA4 6SD |
| Culfor Road | SA4 6UB |
| Danybryn Road | SA4 4PB |
| Glanymor Road | SA4 6SA |
| Glanymorfa | SA4 6TQ |
| Glebe Road | SA4 6QD SA4 6QS SA4 6SR |
| Greenfield Place | SA4 6QH |
| Gwynfe Road | SA4 6TE SA4 6TH |
| Heol Cae Copyn | SA4 6SF |
| Heol Cae Globe | SA4 6QJ |
| Heol Cae Tynewydd | SA4 6PW SA4 6QB |
| Heol Maes Y Bryn | SA4 6PL |
| Heol Pen Y Scallen | SA4 6SE |
| Heol Pentre Bach | SA4 4AU |
| Jubilee Lane | SA4 6QR |
| Kilby Court | SA4 6RQ |
| Maes Yr Haf Place | SA4 6PP |
| Maytree Close | SA4 6RR |
| North Road | SA4 6QE SA4 6QF |
| Oakleigh Road | SA4 6RS |
| Pengry Road | SA4 6PH SA4 6PN |
| Penlan Road | SA4 6QG |
| Penuel Close | SA4 6PU |
| Penycae Lane | SA4 6RX |
| Rectory Close | SA4 6JU |
| Richmond Park | SA4 6QZ |
| Richmond Road | SA4 6QQ |
| Soar Close | SA4 6PJ |
| St Davids Close | SA4 6JX |
| Tircoed Cottages | SA4 6RG |
| Versil Terrace | SA4 6QL |
| Waun Close | SA4 6QW |
| Waun Road | SA4 6QN SA4 6QP SA4 6UD |
| Westland Close | SA4 6JS SA4 6JT |
| Whitley Road | SA4 6SS |
| Woodlands Road | SA4 6PS |
| SA4 6AG |
Transport near Upper Loughor
- FAQ
- Price Paid By Year
- Property Type Price
Frequently asked questions about Upper Loughor
What is the average price for a property for sale in Upper Loughor?
The average price for a property for sale in Upper Loughor is £201,284. This amount is 8% lower than the average price in Swansea. There are 871 property listings for sale in Upper Loughor.
What streets have the most expensive properties for sale in Upper Loughor?
The streets with the most expensive properties for sale in Upper Loughor are Gwynfe Road at an average of £415,000, Heol Cae Copyn at an average of £304,166 and Whitley Road at an average of £287,500.
What streets have the most affordable properties for sale in Upper Loughor?
The streets with the most affordable properties for sale in Upper Loughor are Tircoed Cottages at an average of £59,500, Westland Close at an average of £110,000 and Heol Cae Tynewydd at an average of £119,642.
Which train stations are available in or near Upper Loughor?
Some of the train stations available in or near Upper Loughor are Gowerton, Bynea and Llangennech.
Property Price Paid in Upper Loughor by Year
The average sold property price by year was:
| Year | Average Sold Price | Price Change |
Sold Properties
|
|---|---|---|---|
| 2025 | £196,127 | 1% |
35 Properties |
| 2024 | £194,208 | -10% |
45 Properties |
| 2023 | £212,887 | 1% |
43 Properties |
| 2022 | £210,326 | 4% |
36 Properties |
| 2021 | £202,251 | 4% |
80 Properties |
| 2020 | £193,836 | 23% |
53 Properties |
| 2019 | £148,800 | -13% |
50 Properties |
| 2018 | £168,620 | 22% |
73 Properties |
| 2017 | £131,985 | 4% |
39 Properties |
| 2016 | £127,284 | 8% |
49 Properties |
| 2015 | £117,044 | 0,2% |
37 Properties |
| 2014 | £116,807 | 9% |
41 Properties |
| 2013 | £106,211 | -12% |
46 Properties |
| 2012 | £118,830 | -2% |
42 Properties |
| 2011 | £121,005 | -20% |
39 Properties |
| 2010 | £144,624 | 24% |
20 Properties |
| 2009 | £109,330 | -26% |
18 Properties |
| 2008 | £137,391 | 6% |
29 Properties |
| 2007 | £129,349 | -2% |
58 Properties |
| 2006 | £131,668 | 8% |
63 Properties |
| 2005 | £120,952 | 17% |
40 Properties |
| 2004 | £100,228 | 22% |
32 Properties |
| 2003 | £77,741 | 22% |
60 Properties |
| 2002 | £61,007 | 16% |
49 Properties |
| 2001 | £51,446 | 5% |
56 Properties |
| 2000 | £48,850 | 3% |
49 Properties |
| 1999 | £47,578 | -18% |
56 Properties |
| 1998 | £56,098 | 20% |
34 Properties |
| 1997 | £45,018 | 6% |
35 Properties |
| 1996 | £42,471 | 1% |
49 Properties |
| 1995 | £42,074 | - |
37 Properties |
Property Price per Property Type in Upper Loughor
Here you can find historic sold price data in order to help with your property search.
The average Property Paid Price for specific property types in the last three years are:
| Property Type | Average Sold Price | Sold Properties |
|---|---|---|
| Semi Detached House | £190,978.00 | 67 Semi Detached Houses |
| Detached House | £299,888.00 | 27 Detached Houses |
| Terraced House | £140,645.00 | 24 Terraced Houses |
| Flat | £98,000.00 | 5 Flats |

