
Houses for sale & to rent in Grangetown, Cardiff
House Prices in Grangetown
Properties in Grangetown have an average house price of £209k and had 796 Property Transactions within the last 3 years¹.
Grangetown is an area in Cardiff, Caerdydd - Cardiff with 8,249 households², where the most expensive property was sold for £825k.
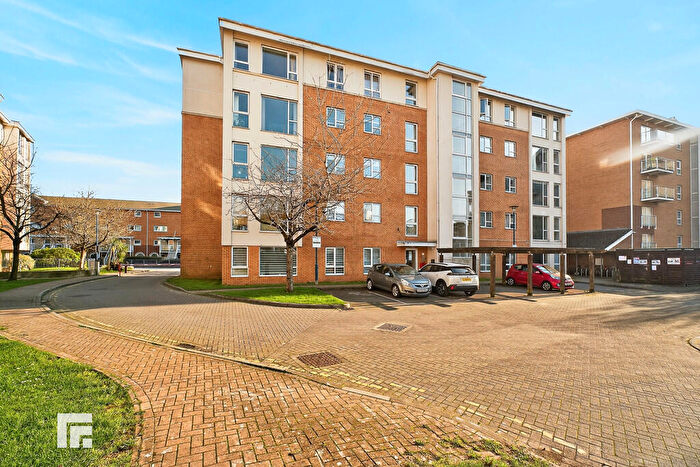
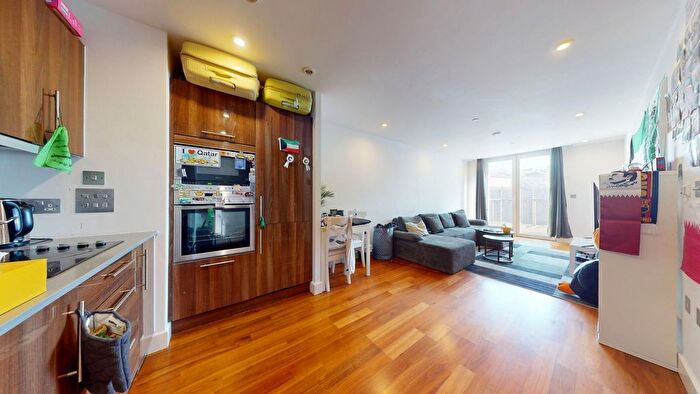
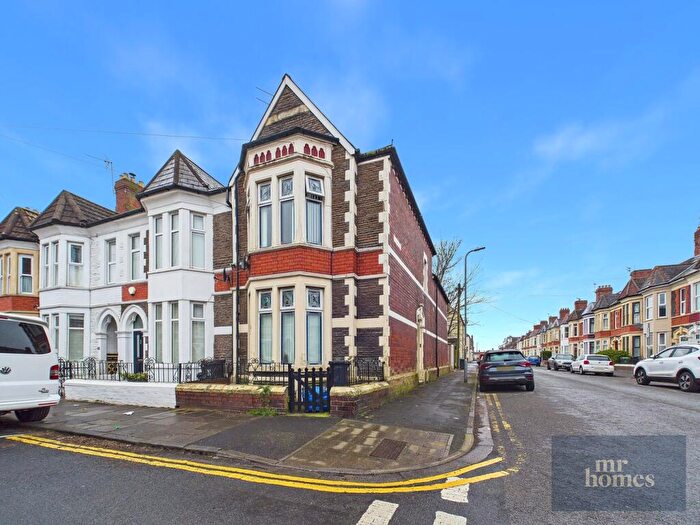
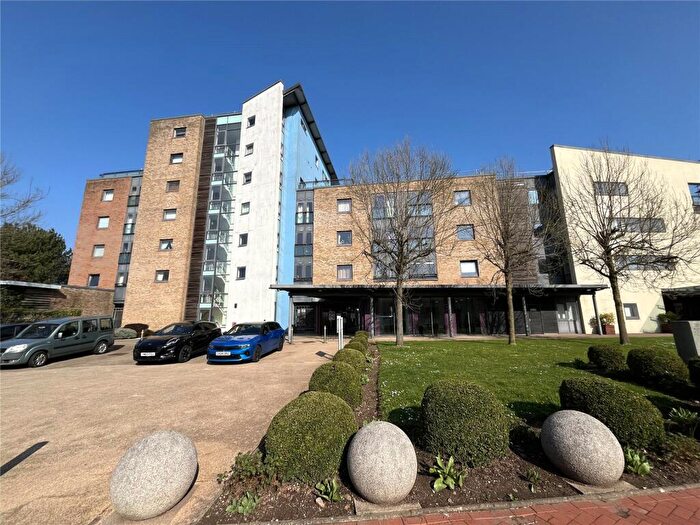
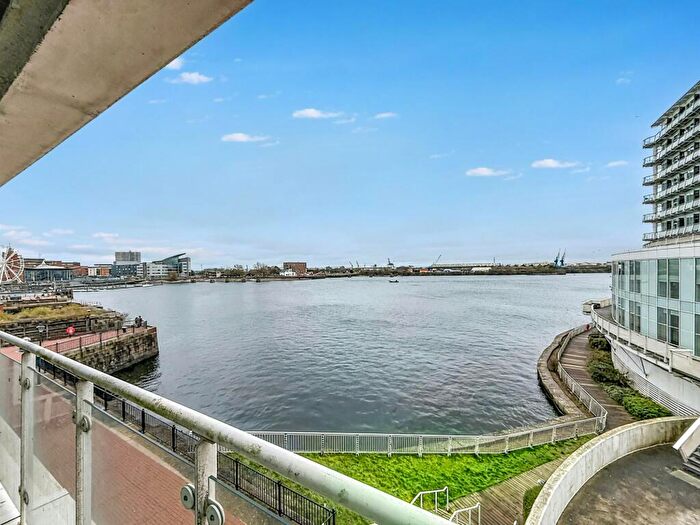
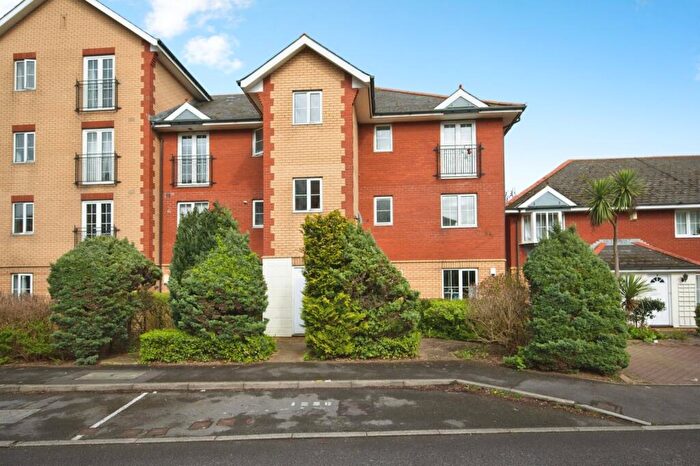
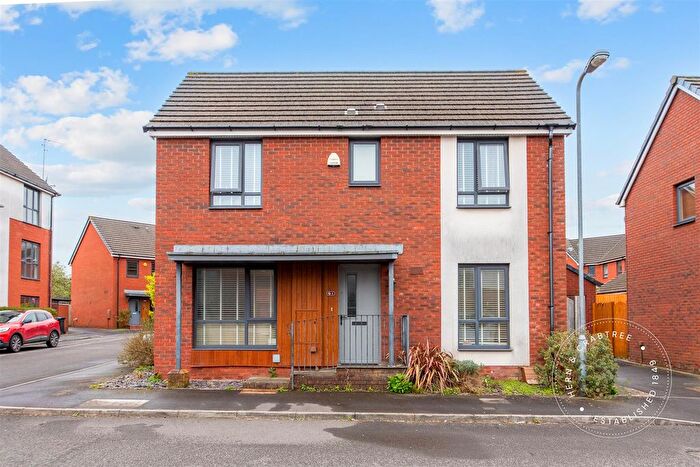
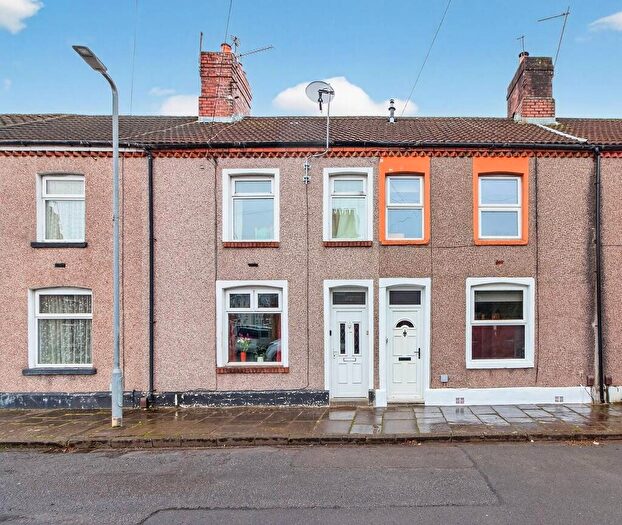
Properties for sale in Grangetown
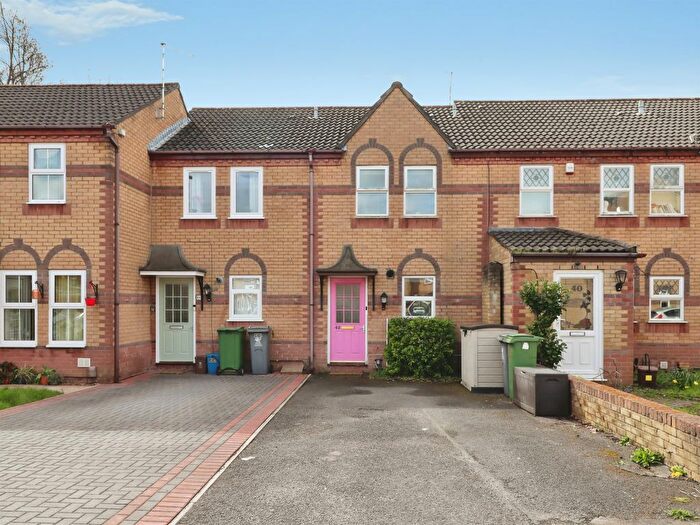
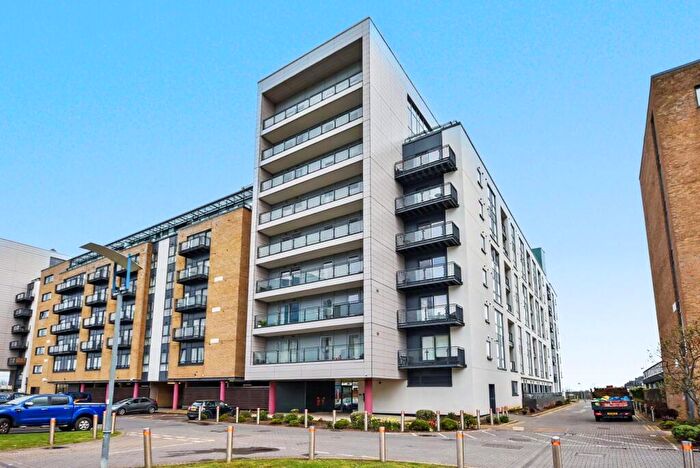
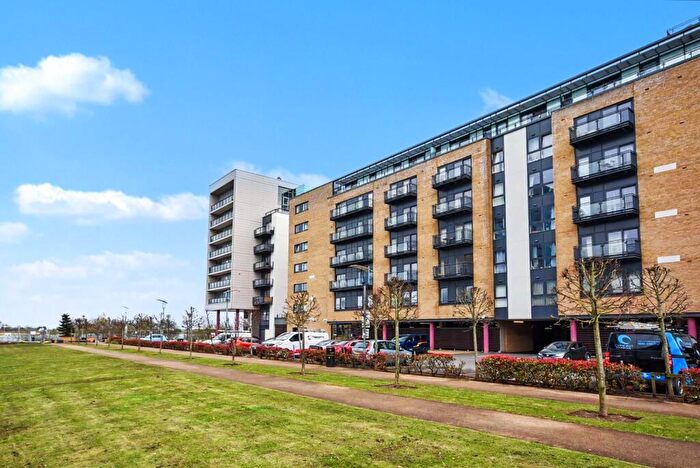
![]()
If you are looking to sell your house, let it out, or receive a property valuation, an expert can help you.
Click the button below to get started.

Roads and Postcodes in Grangetown
Navigate through our locations to find the location of your next house in Grangetown, Cardiff for sale or to rent.
Transport near Grangetown
-
 Grangetown (South Glamorgan) Station
 -
Cardiff Central Station
-
Ninian Park Station
-
Cardiff Bay Station
-
Cogan Station
-
Cardiff Queen Street Station
-
Cathays Station
-
Dingle Road Station
-
Eastbrook Station
-
Penarth Station
- FAQ
- Price Paid By Year
- Property Type Price
Frequently asked questions about Grangetown
What is the average price for a property for sale in Grangetown?
The average price for a property for sale in Grangetown is £209,273. This amount is 28% lower than the average price in Cardiff. There are 6,749 property listings for sale in Grangetown.
What streets have the most expensive properties for sale in Grangetown?
The streets with the most expensive properties for sale in Grangetown are Dan Donovan Way at an average of £589,000, Francis Street at an average of £470,000 and Taffs Mead Embankment at an average of £393,497.
What streets have the most affordable properties for sale in Grangetown?
The streets with the most affordable properties for sale in Grangetown are Cory Place at an average of £135,142, Harrison Way at an average of £136,342 and Sevenoaks Street at an average of £136,665.
Which train stations are available in or near Grangetown?
Some of the train stations available in or near Grangetown are Grangetown (South Glamorgan), Cardiff Central and Ninian Park.
Property Price Paid in Grangetown by Year
The average sold property price by year was:
| Year | Average Sold Price | Price Change |
Sold Properties
|
|---|---|---|---|
| 2026 | £206,867 | -3% |
5 Properties |
| 2025 | £212,462 | 3% |
282 Properties |
| 2024 | £205,953 | -2% |
255 Properties |
| 2023 | £209,113 | 2% |
254 Properties |
| 2022 | £205,933 | 3% |
299 Properties |
| 2021 | £199,457 | -0,4% |
317 Properties |
| 2020 | £200,174 | 9% |
290 Properties |
| 2019 | £182,352 | 1% |
386 Properties |
| 2018 | £180,301 | 1% |
417 Properties |
| 2017 | £179,007 | 5% |
397 Properties |
| 2016 | £170,269 | 9% |
514 Properties |
| 2015 | £154,783 | 5% |
499 Properties |
| 2014 | £147,482 | 6% |
436 Properties |
| 2013 | £138,154 | 6% |
274 Properties |
| 2012 | £130,493 | -3% |
225 Properties |
| 2011 | £134,161 | 3% |
239 Properties |
| 2010 | £130,026 | -3% |
240 Properties |
| 2009 | £134,029 | -22% |
363 Properties |
| 2008 | £163,911 | -0,4% |
402 Properties |
| 2007 | £164,493 | 6% |
663 Properties |
| 2006 | £155,014 | 6% |
638 Properties |
| 2005 | £146,113 | 8% |
528 Properties |
| 2004 | £135,145 | 16% |
633 Properties |
| 2003 | £113,992 | 19% |
541 Properties |
| 2002 | £92,683 | 22% |
526 Properties |
| 2001 | £71,889 | 9% |
428 Properties |
| 2000 | £65,464 | 13% |
410 Properties |
| 1999 | £57,002 | 13% |
340 Properties |
| 1998 | £49,437 | 9% |
313 Properties |
| 1997 | £44,844 | 3% |
323 Properties |
| 1996 | £43,442 | 5% |
294 Properties |
| 1995 | £41,315 | - |
267 Properties |
Property Price per Property Type in Grangetown
Here you can find historic sold price data in order to help with your property search.
The average Property Paid Price for specific property types in the last three years are:
| Property Type | Average Sold Price | Sold Properties |
|---|---|---|
| Semi Detached House | £272,150.00 | 55 Semi Detached Houses |
| Detached House | £353,944.00 | 9 Detached Houses |
| Terraced House | £239,684.00 | 376 Terraced Houses |
| Flat | £163,782.00 | 356 Flats |