
Houses for sale in Blackwood, Caerffili - Caerphilly
House Prices in Blackwood
Properties in Blackwood have an average house price of £202k and had 1,053 Property Transactions within the last 3 years.¹
Blackwood is an area in Caerffili - Caerphilly with 14,135 households², where the most expensive property was sold for £850k.
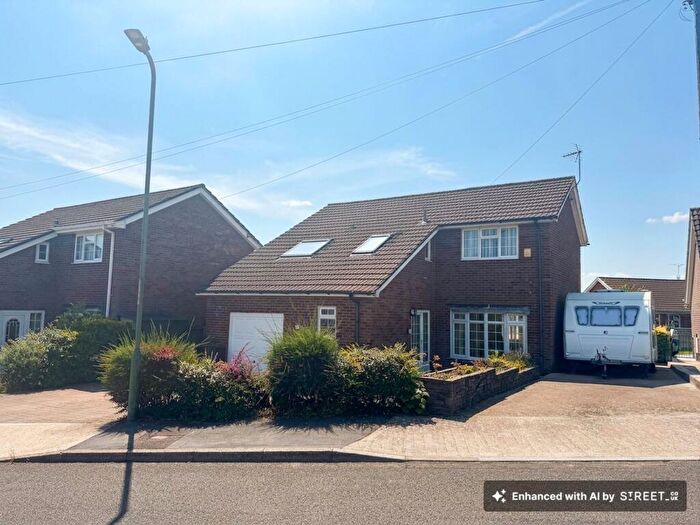
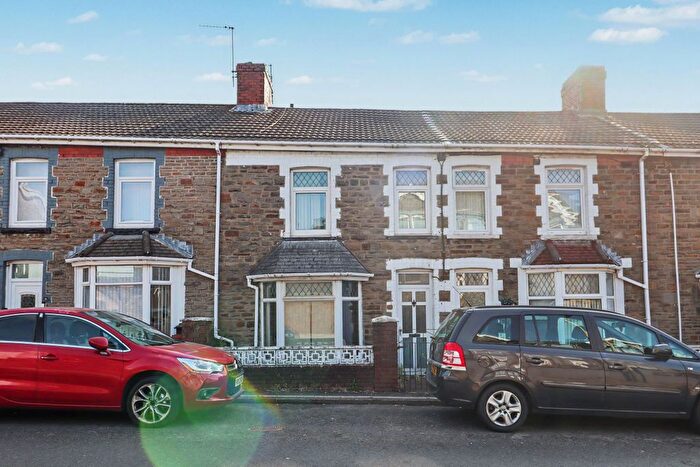
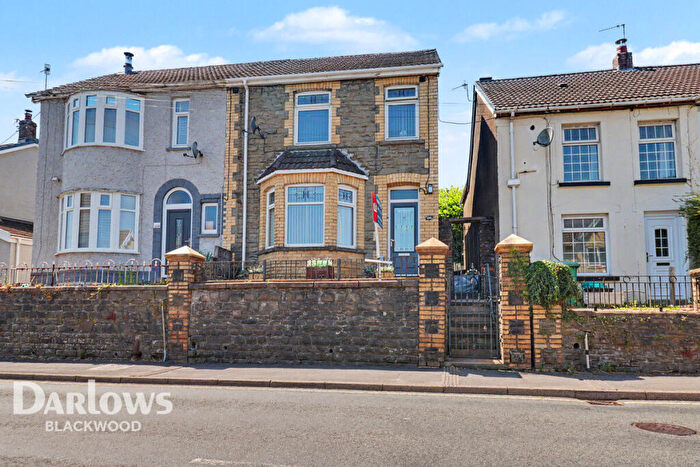
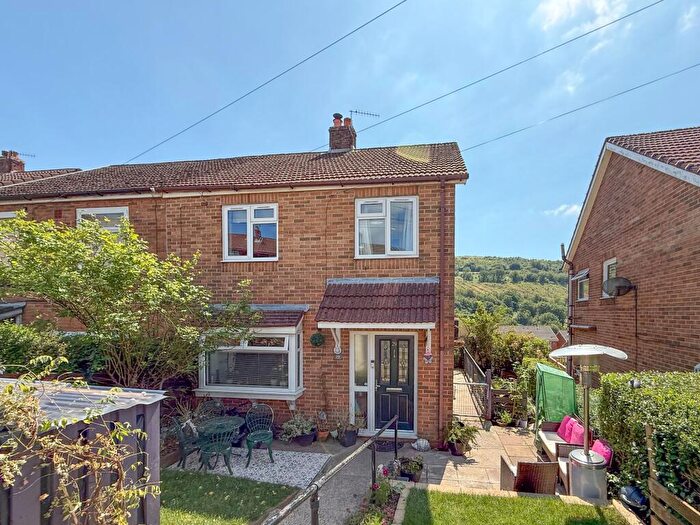
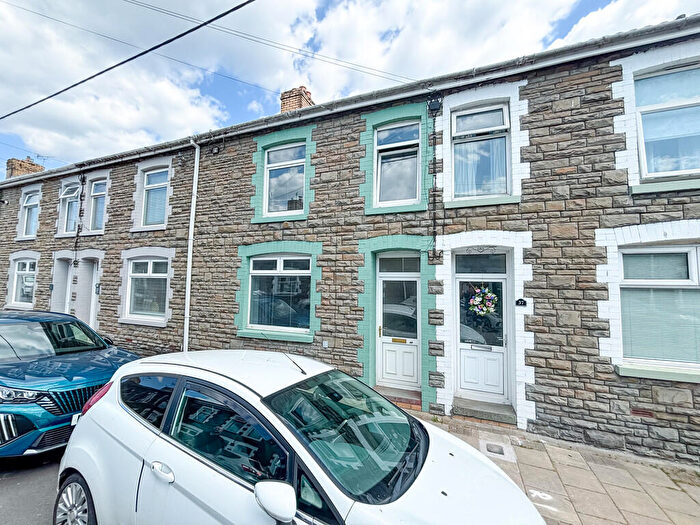
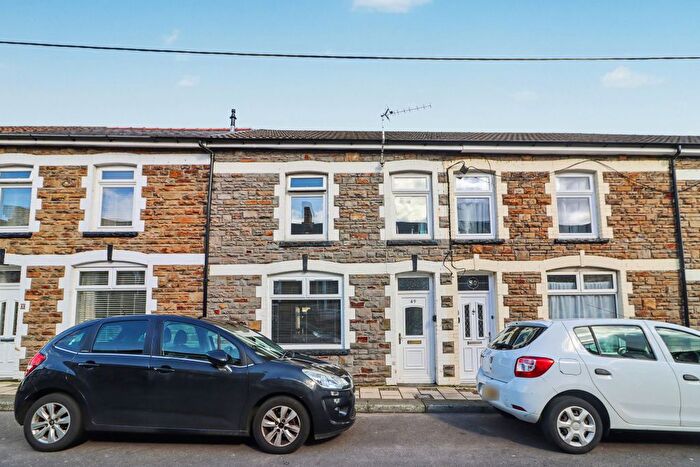
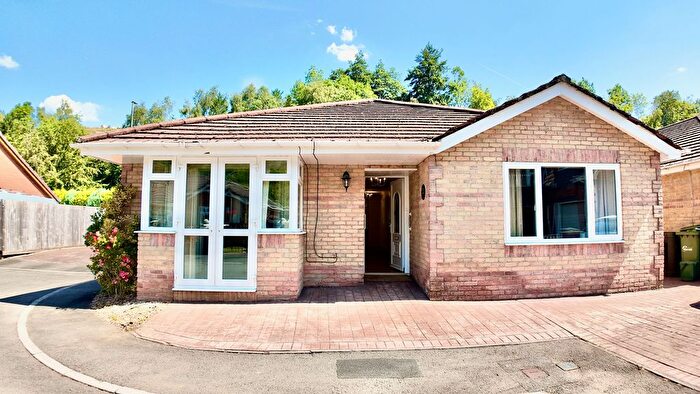
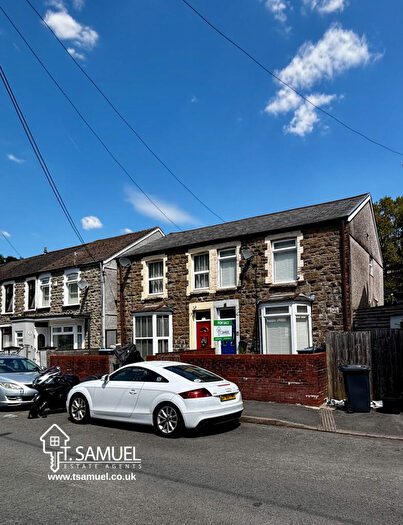
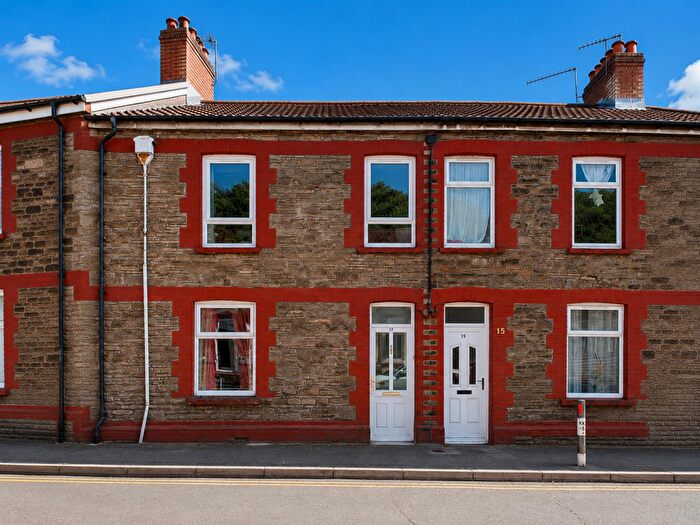
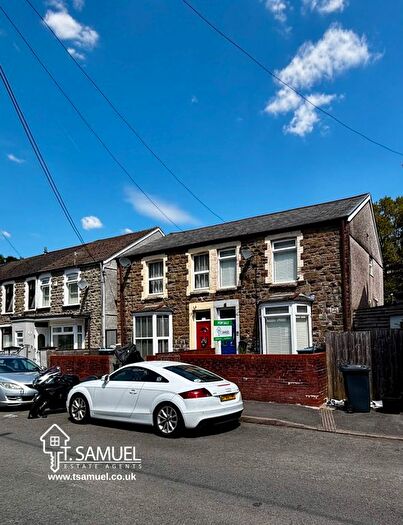
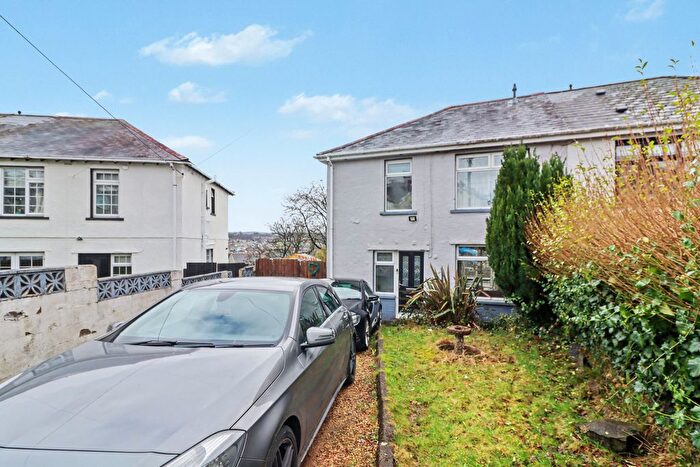
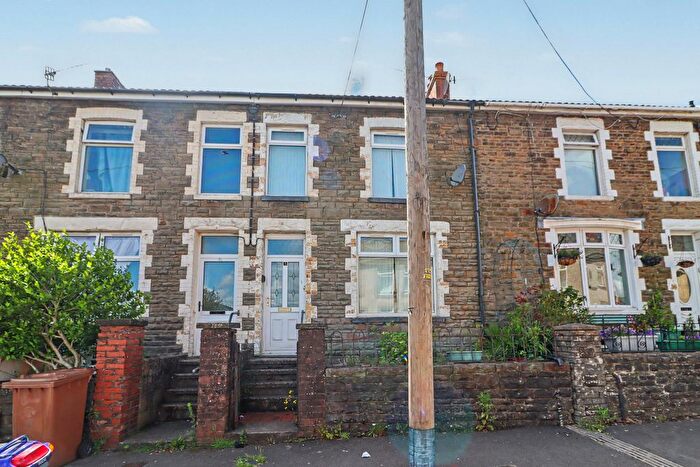
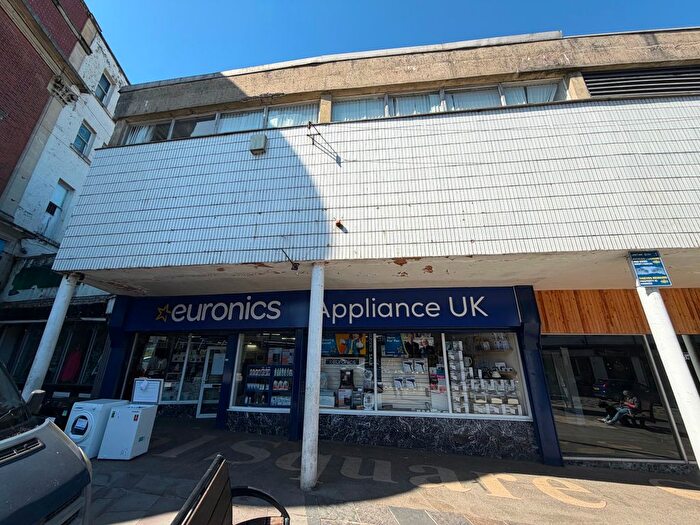
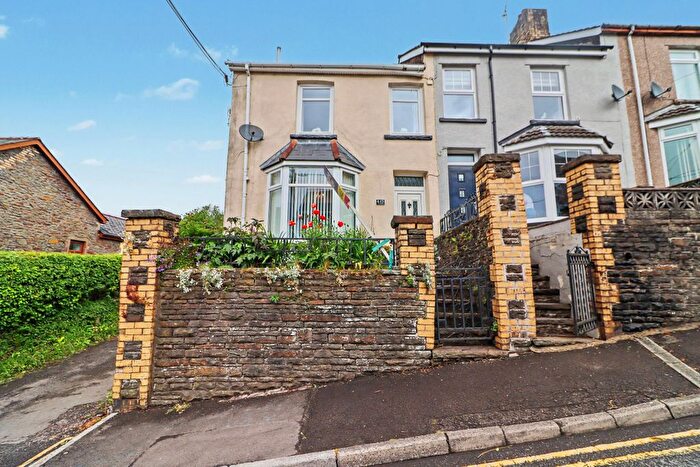
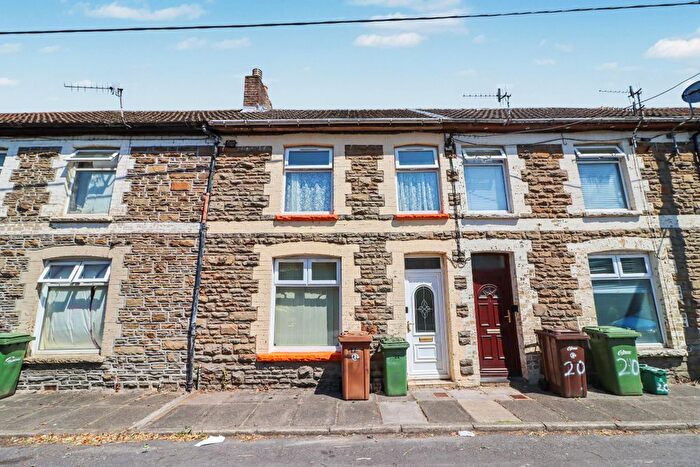
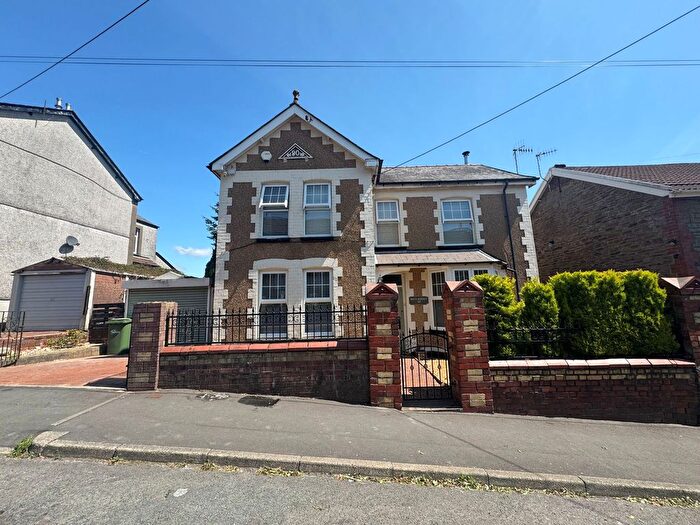
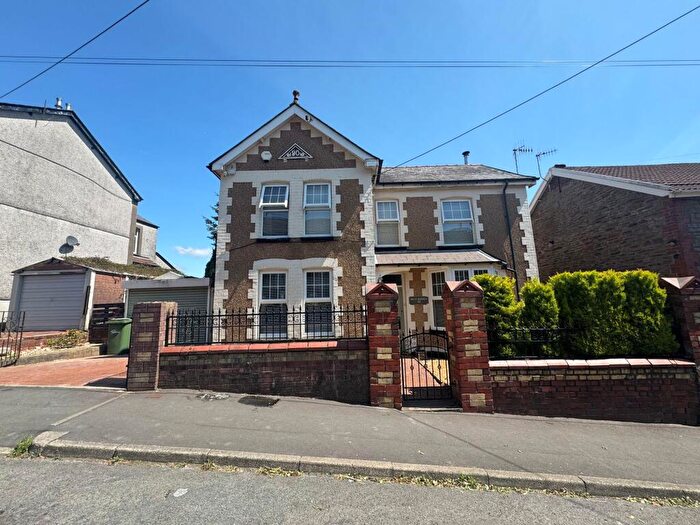
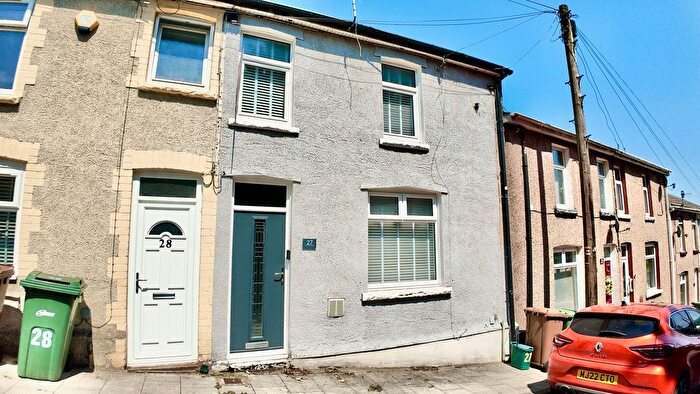
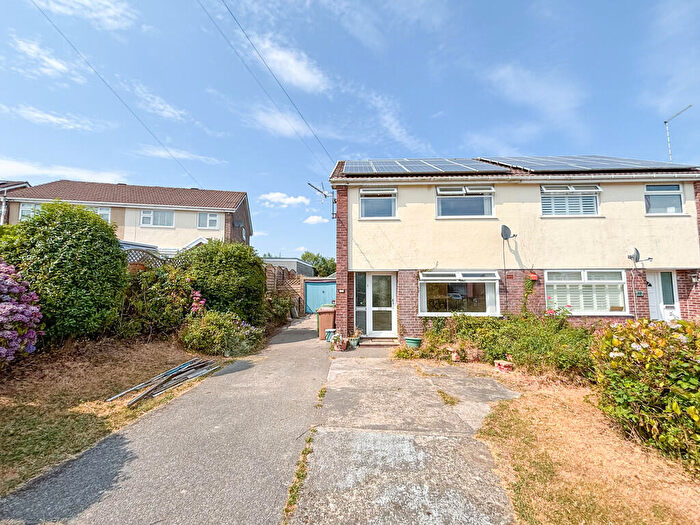
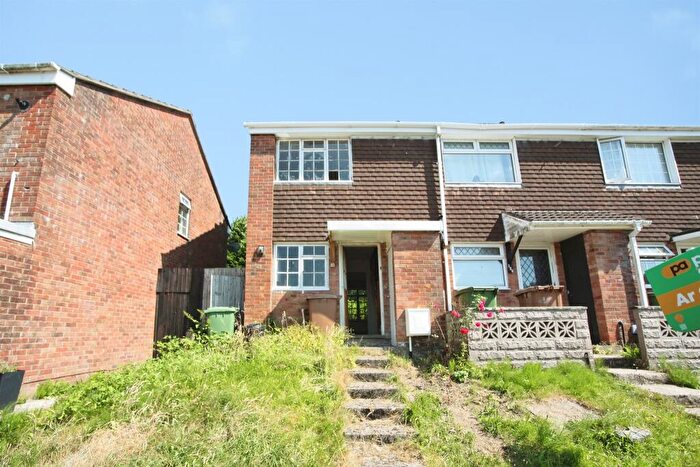
Properties for sale in Blackwood

![]()
If you are looking to sell your house, let it out, or receive a property valuation, an expert can help you.
Click the button below to get started.


Neighbourhoods in Blackwood
Navigate through our locations to find the location of your next house in Blackwood, Caerffili - Caerphilly for sale or to rent.
Property price trends in Blackwood
According to the latest Land Registry data, the average home in Blackwood sold for £258,567 in 2026. That figure comes from a substantial record of 13,734 sales logged over the past 31 years.
Prices have continued to climb over the last three years. Compared with 2023, when the typical sale came in around £187,215, that's a rise of roughly 38.1%.
Looking back five years, average prices are up about 41.5% since 2021, a gain of around £75,800 in cash terms.
Zoom out to the past decade for the fuller picture. Back in 2016, homes here averaged £131,128, so the typical sold price has climbed about 97.2% since then, roughly 7% a year. Stretch the view to fifteen years and that annual pace eases back to about 4.6%.
Frequently asked questions about Blackwood
What is the average price for a property for sale in Blackwood?
The average price for a property for sale in Blackwood is £201,648. This amount is 3% higher than the average price in Caerffili - Caerphilly. There are 7,311 property listings for sale in Blackwood.
What locations have the most expensive properties for sale in Blackwood?
The locations with the most expensive properties for sale in Blackwood are Ynysddu at an average of £354,749, Penmaen at an average of £222,899 and Pontllanfraith at an average of £202,914.
What locations have the most affordable properties for sale in Blackwood?
The locations with the most affordable properties for sale in Blackwood are St. Cattwg at an average of £163,190, Cefn Fforest at an average of £173,516 and Argoed at an average of £179,313.
Which train stations are available in or near Blackwood?
Some of the train stations available in or near Blackwood are Pengam, Gilfach Fargoed and Hengoed.
Property Price Paid in Blackwood by Year
The average sold property price by year was:
| Year | Average Sold Price | Price Change |
Sold Properties
|
|---|---|---|---|
| 2026 | £258,567 | 17% |
14 Properties |
| 2025 | £213,479 | 6% |
349 Properties |
| 2024 | £200,254 | 7% |
386 Properties |
| 2023 | £187,215 | -9% |
304 Properties |
| 2022 | £203,937 | 10% |
485 Properties |
| 2021 | £182,767 | 6% |
558 Properties |
| 2020 | £171,986 | 11% |
405 Properties |
| 2019 | £152,350 | 8% |
533 Properties |
| 2018 | £139,729 | 1% |
425 Properties |
| 2017 | £138,811 | 6% |
453 Properties |
Property Price per Property Type in Blackwood
Here you can find historic sold price data in order to help with your property search.
The average Property Paid Price for specific property types in the last three years are:
| Property Type | Average Sold Price | Sold Properties |
|---|---|---|
| Semi Detached House | £188,753.00 | 471 Semi Detached Houses |
| Detached House | £325,406.00 | 208 Detached Houses |
| Terraced House | £149,873.00 | 358 Terraced Houses |
| Flat | £130,843.00 | 16 Flats |
Transport in Blackwood
Please see below transportation links in this area:
