
Houses for sale & to rent in Colwyn Bay, Conwy - Conwy
House Prices in Colwyn Bay
Properties in Colwyn Bay have an average house price of £230k and had 1,713 Property Transactions within the last 3 years.¹
Colwyn Bay is an area in Conwy - Conwy with 15,181 households², where the most expensive property was sold for £1.25M.
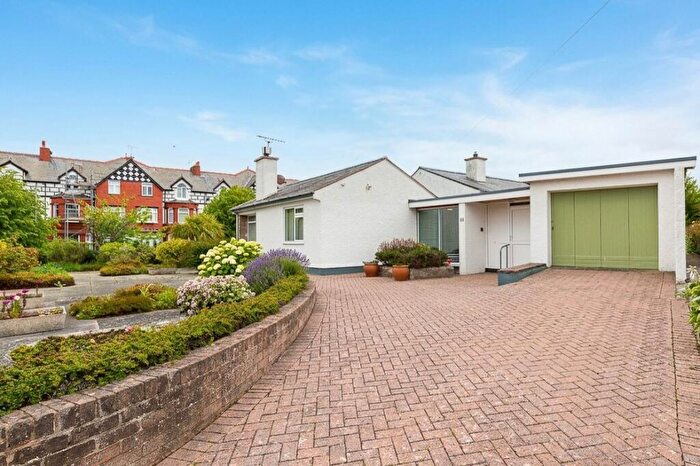
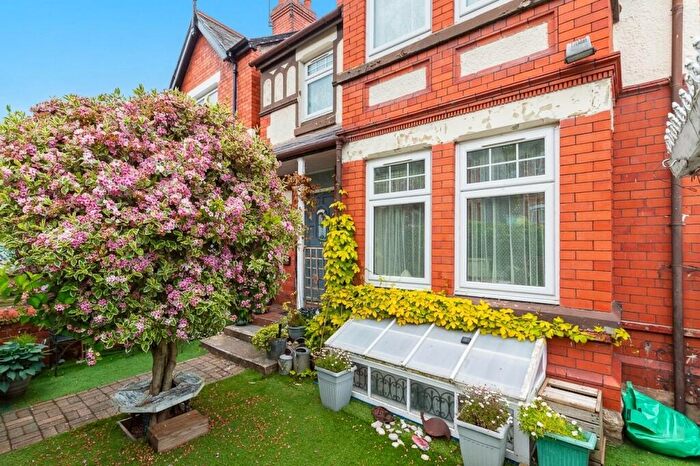
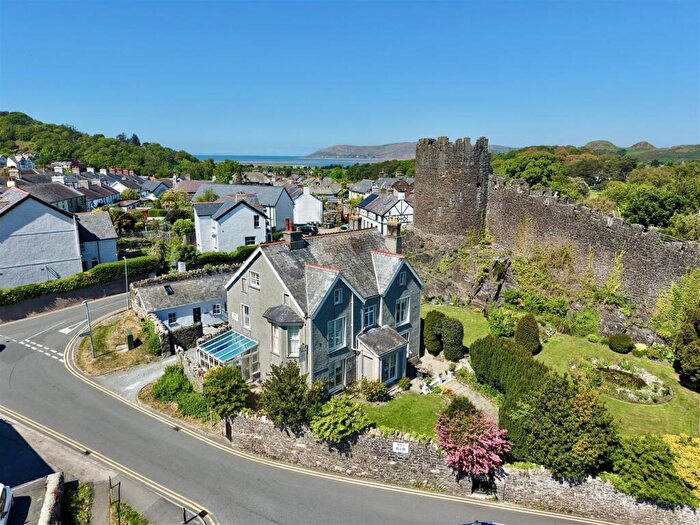
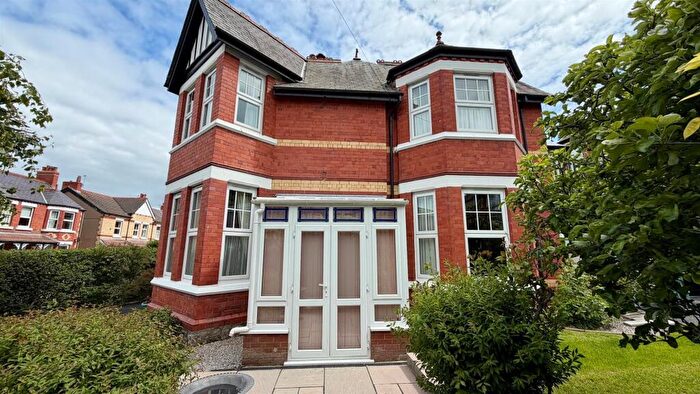
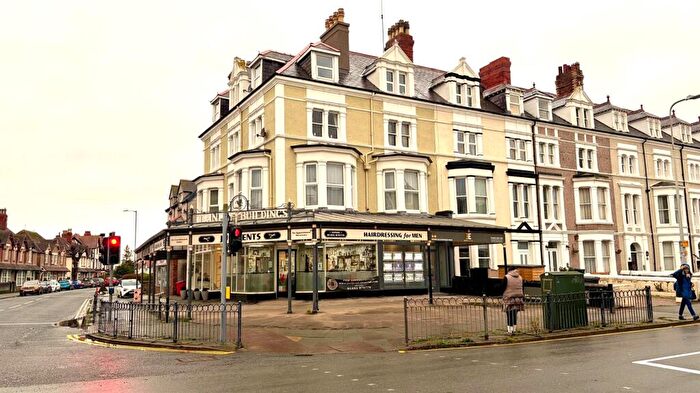
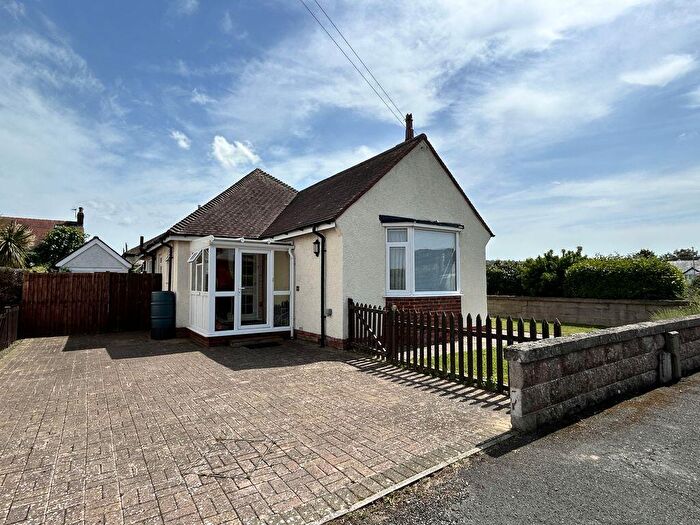
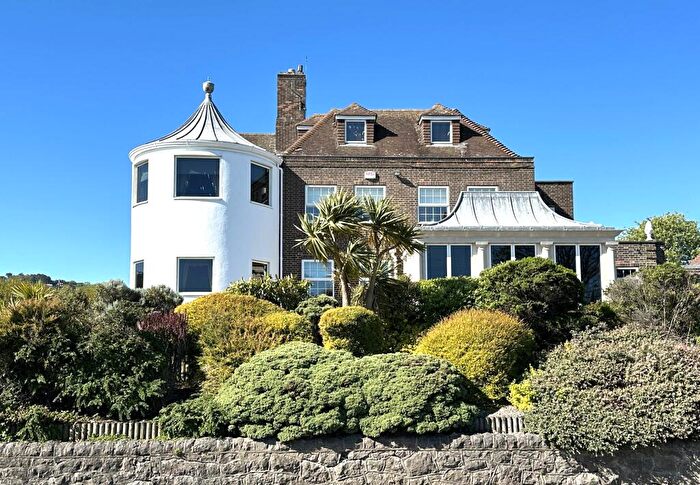
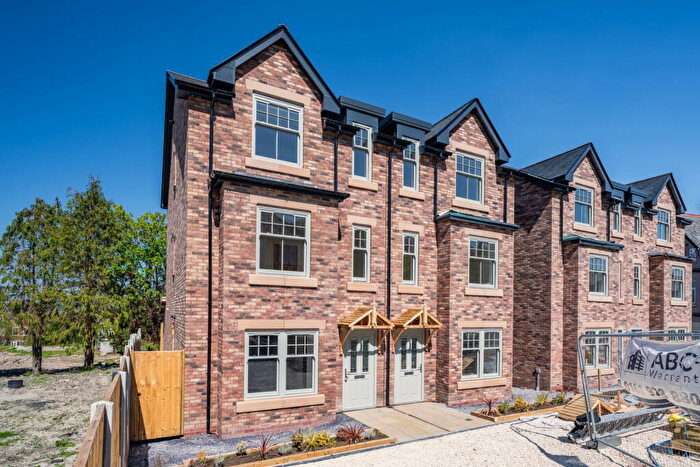
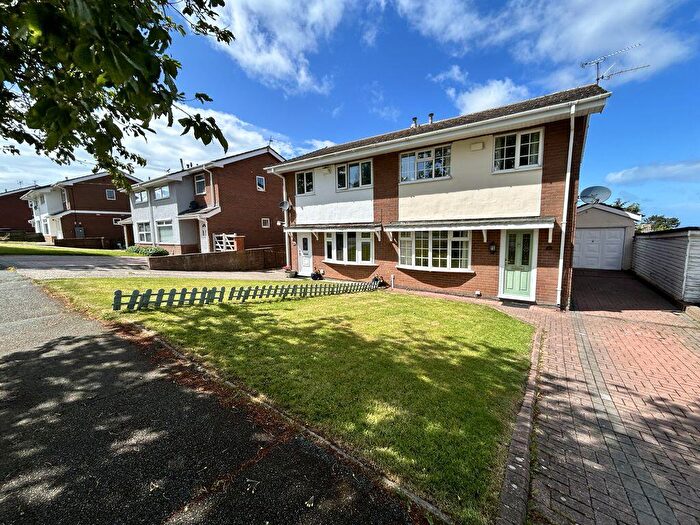
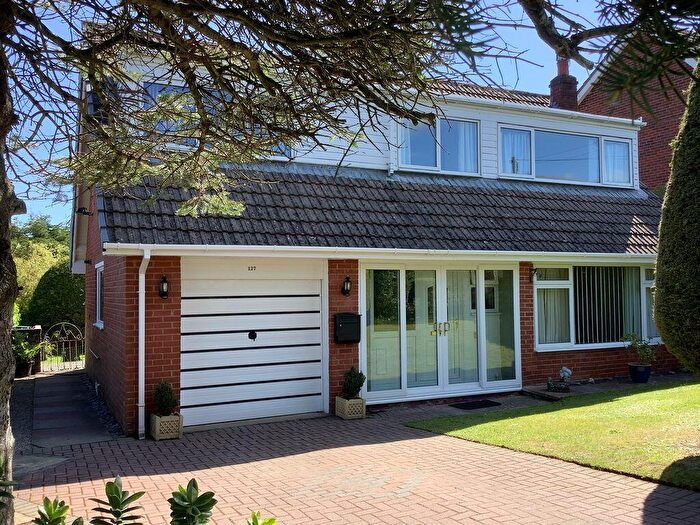
Properties for sale in Colwyn Bay
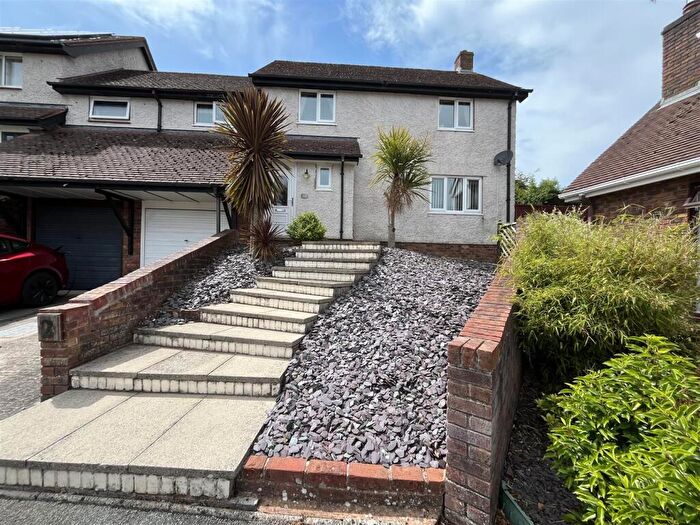
![]()
If you are looking to sell your house, let it out, or receive a property valuation, an expert can help you.
Click the button below to get started.
Neighbourhoods in Colwyn Bay
Navigate through our locations to find the location of your next house in Colwyn Bay, Conwy - Conwy for sale or to rent.
Transport in Colwyn Bay
Please see below transportation links in this area:
-
 Colwyn Bay Station
 -
Glan Conwy Station
-
Llandudno Junction Station
-
Conwy Station
-
Deganwy Station
-
Llandudno Station
- FAQ
- Price Paid By Year
- Property Type Price
Frequently asked questions about Colwyn Bay
What is the average price for a property for sale in Colwyn Bay?
The average price for a property for sale in Colwyn Bay is £230,017. This amount is 2% lower than the average price in Conwy - Conwy. There are 5,875 property listings for sale in Colwyn Bay.
What locations have the most expensive properties for sale in Colwyn Bay?
The locations with the most expensive properties for sale in Colwyn Bay are Eglwysbach at an average of £343,642, Llansanffraid at an average of £267,606 and Rhiw at an average of £255,205.
What locations have the most affordable properties for sale in Colwyn Bay?
The locations with the most affordable properties for sale in Colwyn Bay are Mochdre at an average of £176,631, Glyn at an average of £177,369 and Llysfaen at an average of £187,069.
Which train stations are available in or near Colwyn Bay?
Some of the train stations available in or near Colwyn Bay are Colwyn Bay, Glan Conwy and Llandudno Junction.
Property Price Paid in Colwyn Bay by Year
The average sold property price by year was:
| Year | Average Sold Price | Price Change |
Sold Properties
|
|---|---|---|---|
| 2026 | £212,968 | -12% |
31 Properties |
| 2025 | £238,469 | 2% |
543 Properties |
| 2024 | £232,707 | 5% |
579 Properties |
| 2023 | £219,985 | 0,4% |
560 Properties |
| 2022 | £219,106 | -5% |
677 Properties |
| 2021 | £229,725 | 11% |
739 Properties |
| 2020 | £203,728 | 9% |
472 Properties |
| 2019 | £185,235 | 3% |
689 Properties |
| 2018 | £179,421 | 1% |
741 Properties |
| 2017 | £177,840 | 4% |
789 Properties |
| 2016 | £171,195 | 4% |
621 Properties |
| 2015 | £164,559 | 2% |
592 Properties |
| 2014 | £160,962 | 0,4% |
567 Properties |
| 2013 | £160,341 | 1% |
444 Properties |
| 2012 | £159,388 | -6% |
383 Properties |
| 2011 | £168,854 | 2% |
376 Properties |
| 2010 | £164,952 | 2% |
387 Properties |
| 2009 | £161,830 | 8% |
370 Properties |
| 2008 | £148,273 | -13% |
474 Properties |
| 2007 | £167,324 | -0,4% |
870 Properties |
| 2006 | £168,036 | 5% |
820 Properties |
| 2005 | £159,773 | 11% |
579 Properties |
| 2004 | £142,736 | 16% |
1,016 Properties |
| 2003 | £120,021 | 25% |
947 Properties |
| 2002 | £89,519 | 13% |
1,062 Properties |
| 2001 | £77,867 | 12% |
829 Properties |
| 2000 | £68,662 | 9% |
676 Properties |
| 1999 | £62,449 | 8% |
661 Properties |
| 1998 | £57,264 | 2% |
583 Properties |
| 1997 | £55,862 | 6% |
667 Properties |
| 1996 | £52,664 | -2% |
564 Properties |
| 1995 | £53,542 | - |
430 Properties |
Property Price per Property Type in Colwyn Bay
Here you can find historic sold price data in order to help with your property search.
The average Property Paid Price for specific property types in the last three years are:
| Property Type | Average Sold Price | Sold Properties |
|---|---|---|
| Semi Detached House | £214,839.00 | 545 Semi Detached Houses |
| Detached House | £357,817.00 | 495 Detached Houses |
| Terraced House | £162,611.00 | 284 Terraced Houses |
| Flat | £137,870.00 | 389 Flats |