
Houses for sale & to rent in Llandudno, Conwy - Conwy
House Prices in Llandudno
Properties in Llandudno have an average house price of £239k and had 1,152 Property Transactions within the last 3 years.¹
Llandudno is an area in Conwy - Conwy with 10,113 households², where the most expensive property was sold for £2.14M.
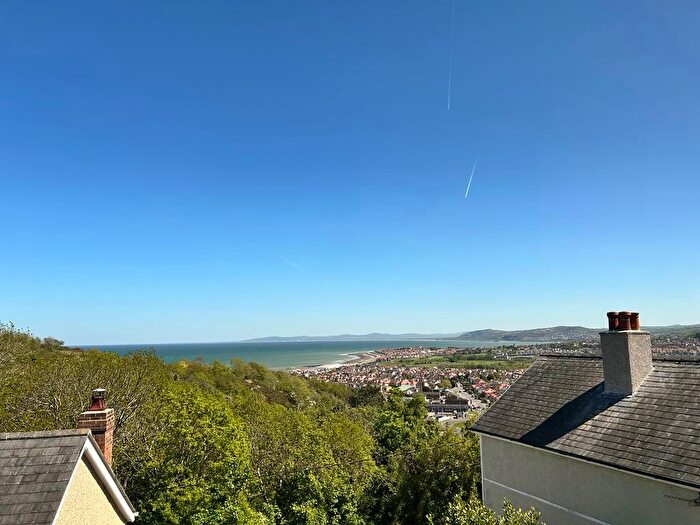
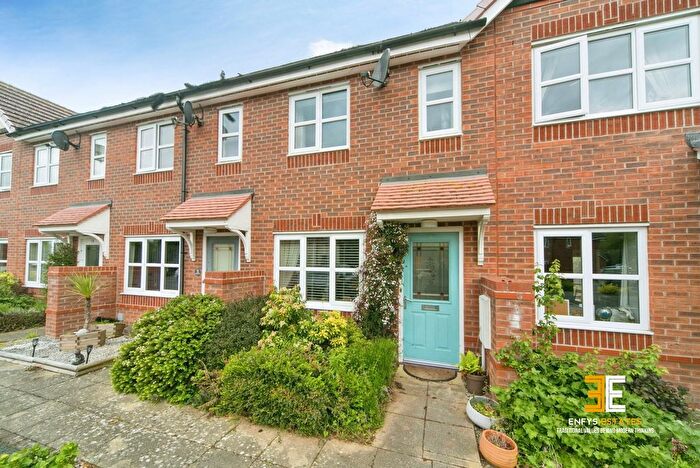
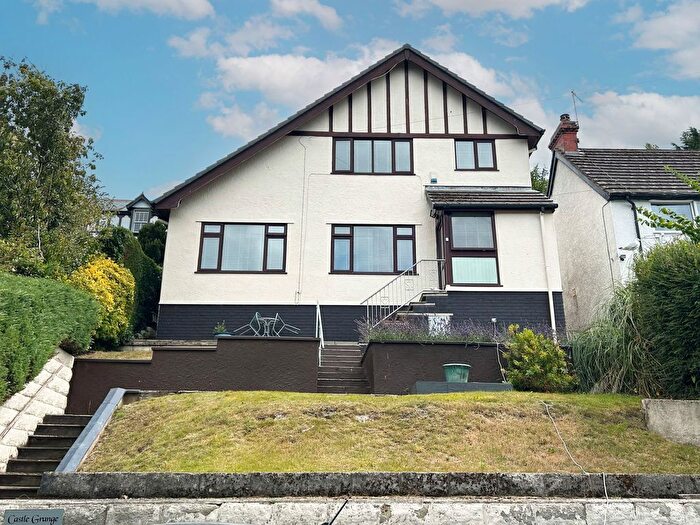
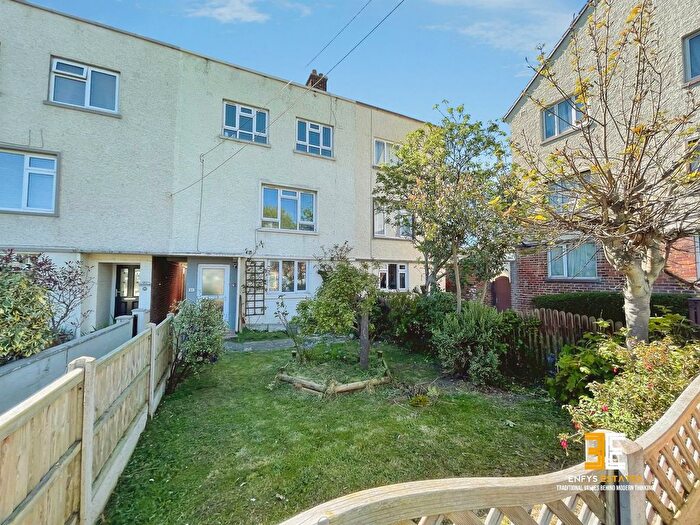
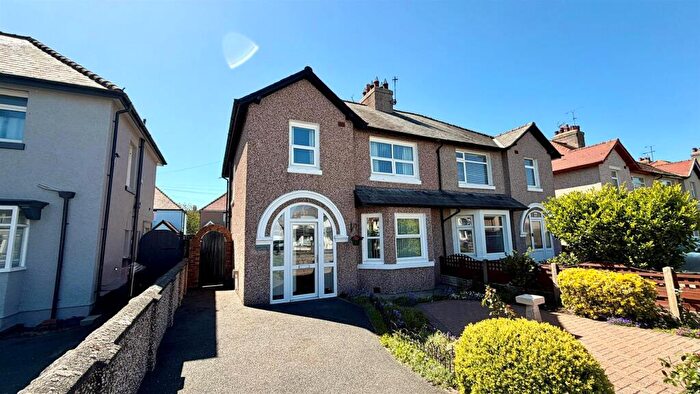
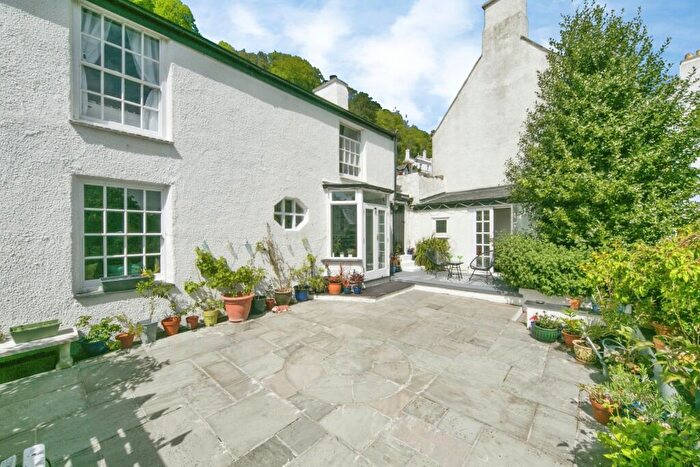
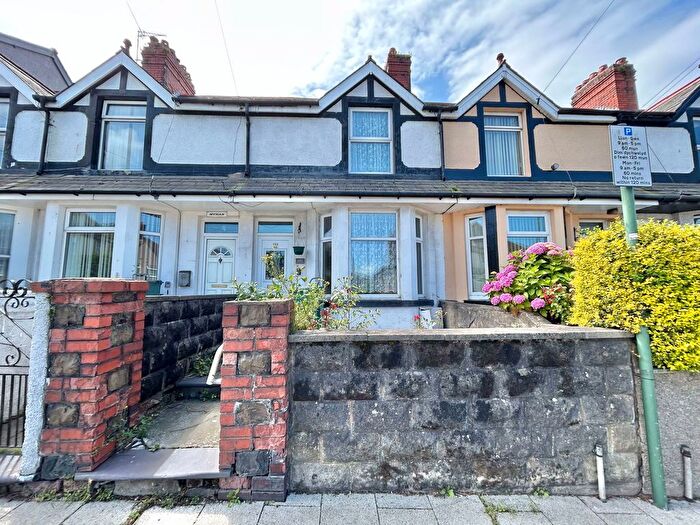
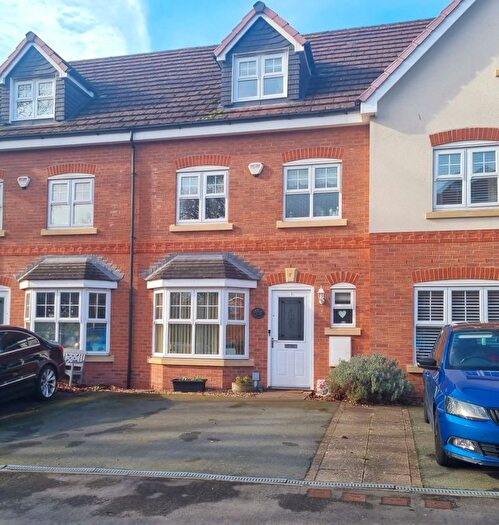
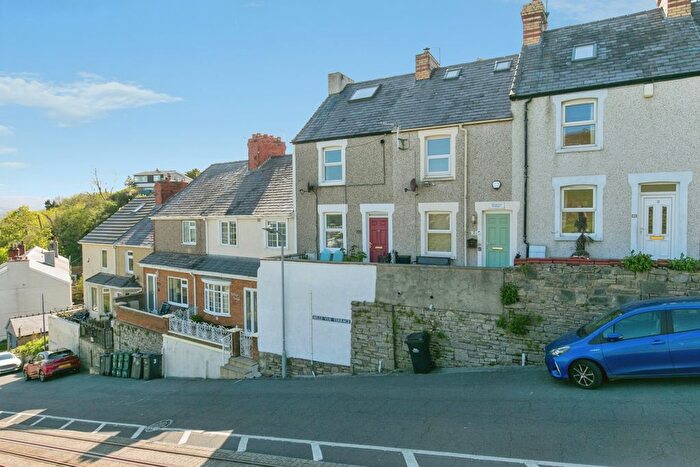
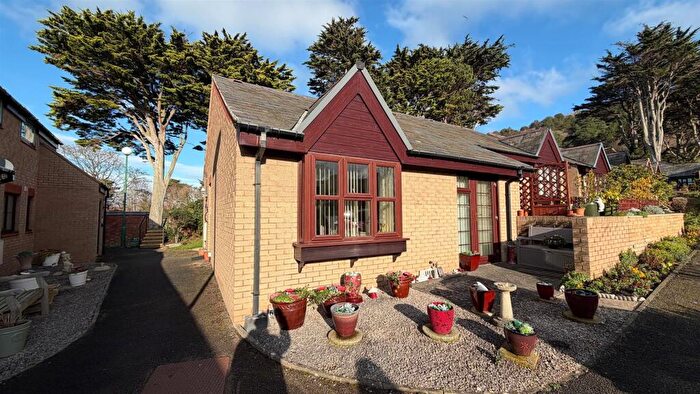
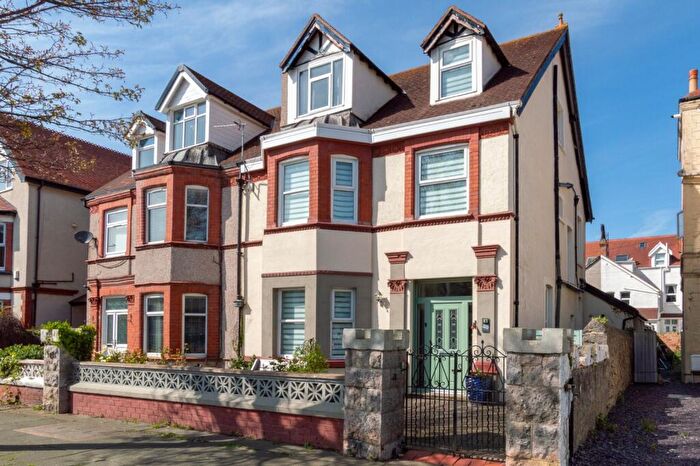
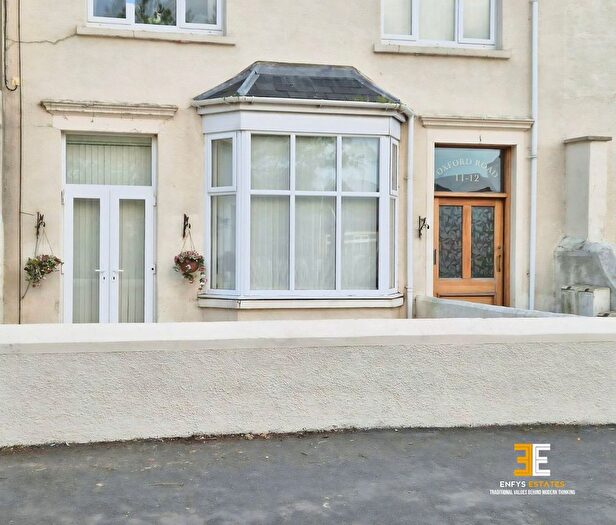
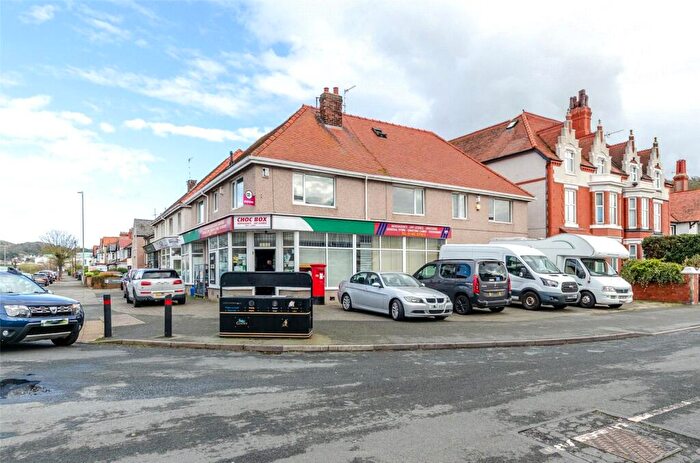
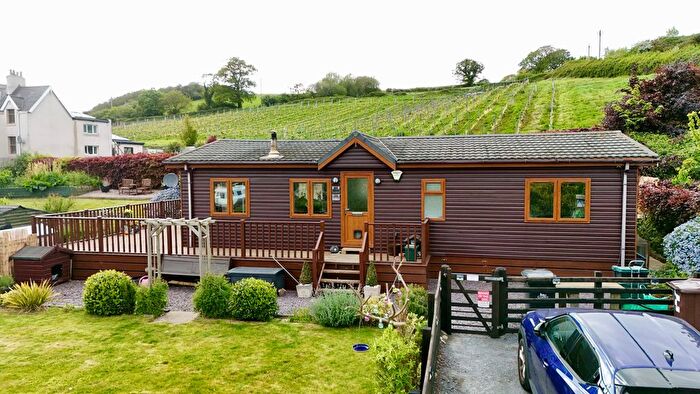
Properties for sale in Llandudno
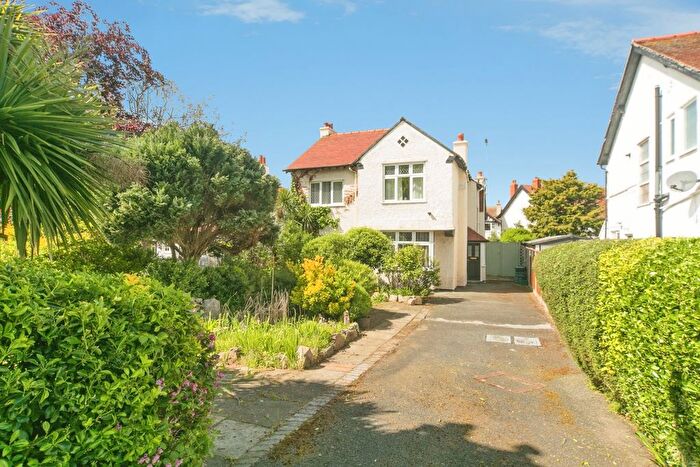
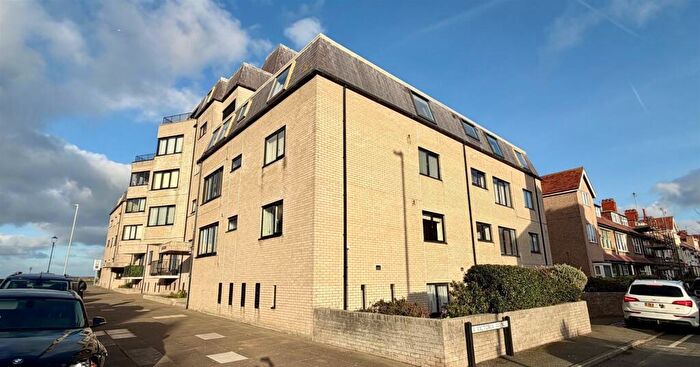
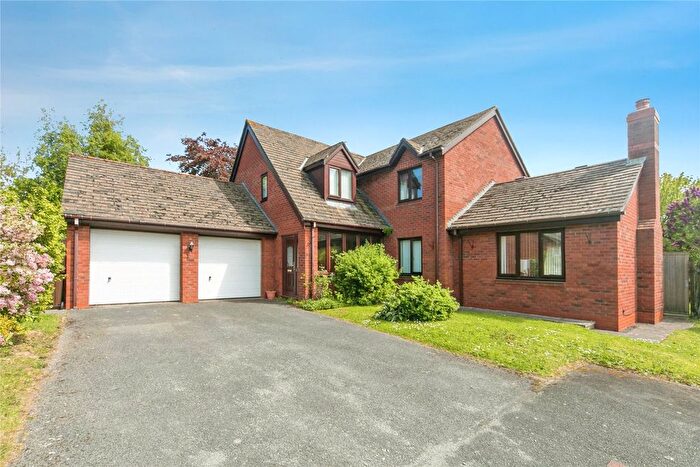
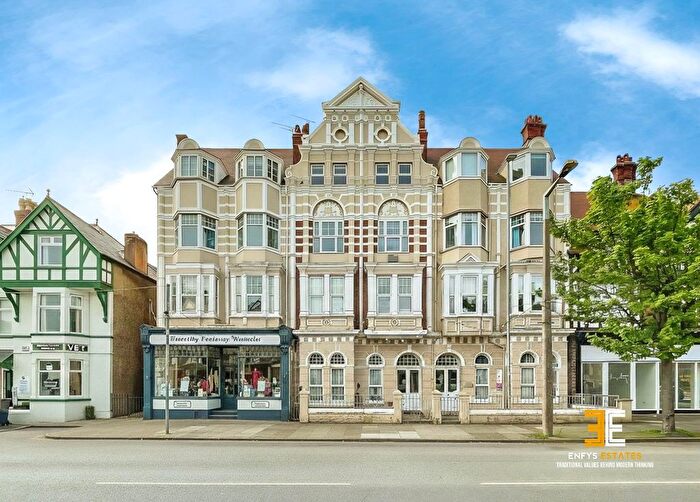
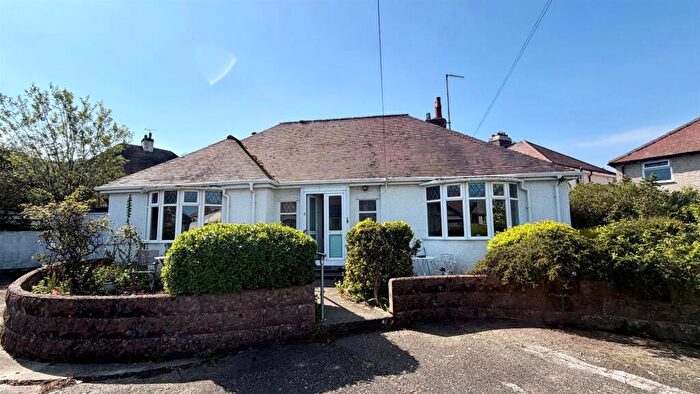
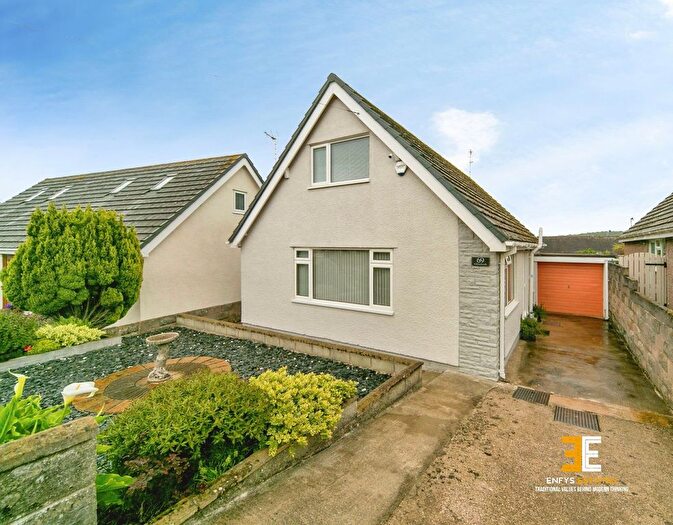
![]()
If you are looking to sell your house, let it out, or receive a property valuation, an expert can help you.
Click the button below to get started.
Neighbourhoods in Llandudno
Navigate through our locations to find the location of your next house in Llandudno, Conwy - Conwy for sale or to rent.
Transport in Llandudno
Please see below transportation links in this area:

- FAQ
- Price Paid By Year
- Property Type Price
Frequently asked questions about Llandudno
What is the average price for a property for sale in Llandudno?
The average price for a property for sale in Llandudno is £239,147. This amount is 2% higher than the average price in Conwy - Conwy. There are 3,689 property listings for sale in Llandudno.
What locations have the most expensive properties for sale in Llandudno?
The locations with the most expensive properties for sale in Llandudno are Deganwy at an average of £283,588, Craig-y-don at an average of £277,479 and Penrhyn at an average of £271,544.
What locations have the most affordable properties for sale in Llandudno?
The locations with the most affordable properties for sale in Llandudno are Tudno at an average of £196,887, Gogarth at an average of £202,027 and Mostyn at an average of £212,553.
Which train stations are available in or near Llandudno?
Some of the train stations available in or near Llandudno are Llandudno, Deganwy and Llandudno Junction.
Property Price Paid in Llandudno by Year
The average sold property price by year was:
| Year | Average Sold Price | Price Change |
Sold Properties
|
|---|---|---|---|
| 2026 | £209,420 | -17% |
32 Properties |
| 2025 | £245,333 | 5% |
353 Properties |
| 2024 | £233,104 | -4% |
417 Properties |
| 2023 | £242,827 | 9% |
350 Properties |
| 2022 | £221,319 | -2% |
456 Properties |
| 2021 | £225,729 | 3% |
520 Properties |
| 2020 | £217,920 | 9% |
338 Properties |
| 2019 | £197,338 | 7% |
362 Properties |
| 2018 | £184,365 | 0,5% |
421 Properties |
| 2017 | £183,459 | 10% |
497 Properties |
| 2016 | £165,992 | -5% |
467 Properties |
| 2015 | £174,851 | -1% |
405 Properties |
| 2014 | £176,919 | 4% |
488 Properties |
| 2013 | £169,330 | -1% |
331 Properties |
| 2012 | £170,439 | 1% |
307 Properties |
| 2011 | £168,573 | -3% |
320 Properties |
| 2010 | £172,827 | 5% |
285 Properties |
| 2009 | £164,342 | -4% |
277 Properties |
| 2008 | £171,657 | -6% |
290 Properties |
| 2007 | £182,801 | 2% |
589 Properties |
| 2006 | £179,016 | 6% |
536 Properties |
| 2005 | £167,600 | 11% |
396 Properties |
| 2004 | £149,398 | 14% |
530 Properties |
| 2003 | £127,879 | 21% |
630 Properties |
| 2002 | £101,408 | 19% |
684 Properties |
| 2001 | £82,235 | 11% |
557 Properties |
| 2000 | £73,581 | 9% |
504 Properties |
| 1999 | £66,953 | 2% |
495 Properties |
| 1998 | £65,812 | 4% |
473 Properties |
| 1997 | £63,121 | 14% |
529 Properties |
| 1996 | £54,357 | -4% |
486 Properties |
| 1995 | £56,746 | - |
371 Properties |
Property Price per Property Type in Llandudno
Here you can find historic sold price data in order to help with your property search.
The average Property Paid Price for specific property types in the last three years are:
| Property Type | Average Sold Price | Sold Properties |
|---|---|---|
| Semi Detached House | £246,236.00 | 283 Semi Detached Houses |
| Detached House | £361,417.00 | 344 Detached Houses |
| Terraced House | £189,618.00 | 192 Terraced Houses |
| Flat | £135,371.00 | 333 Flats |