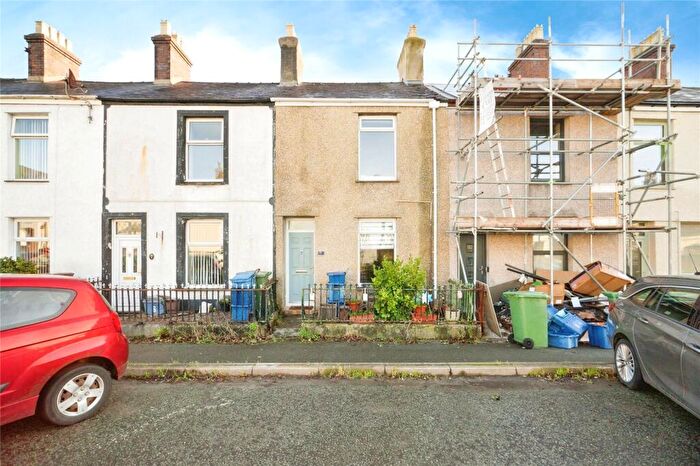
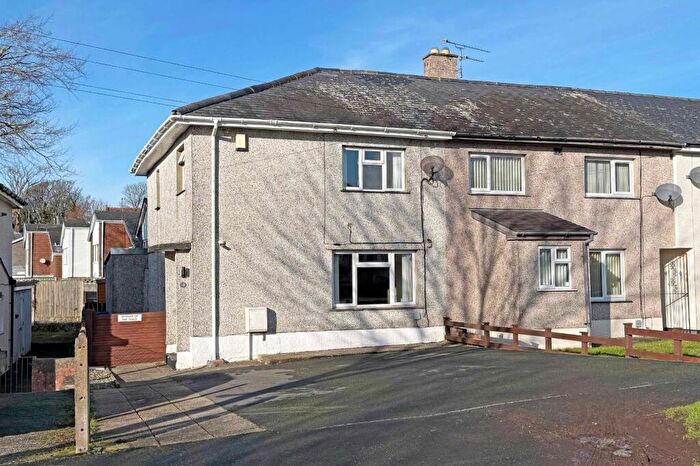
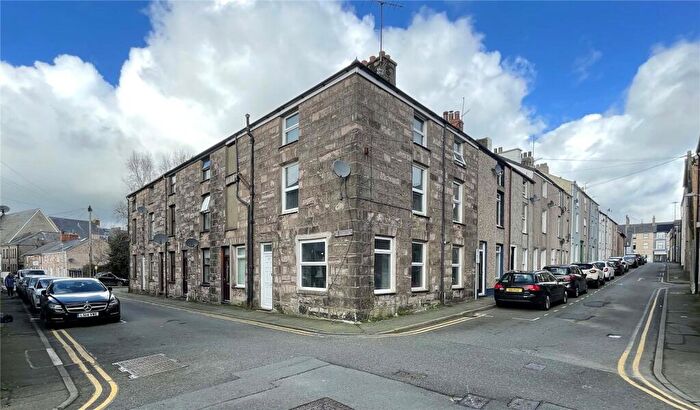
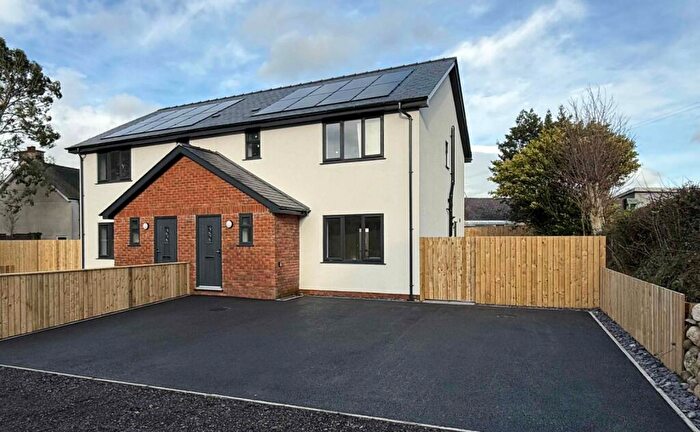
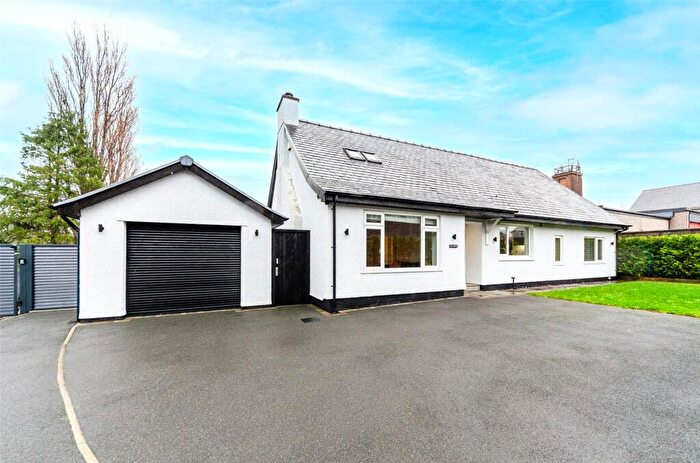
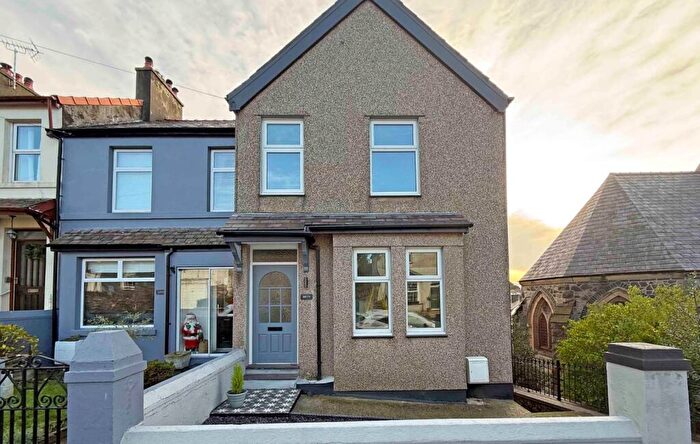
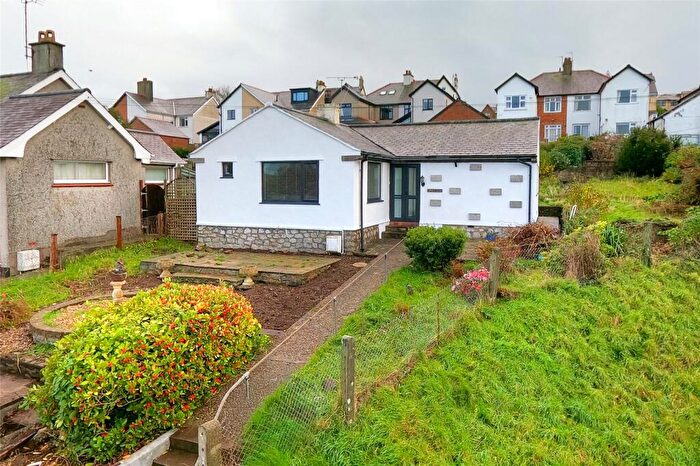
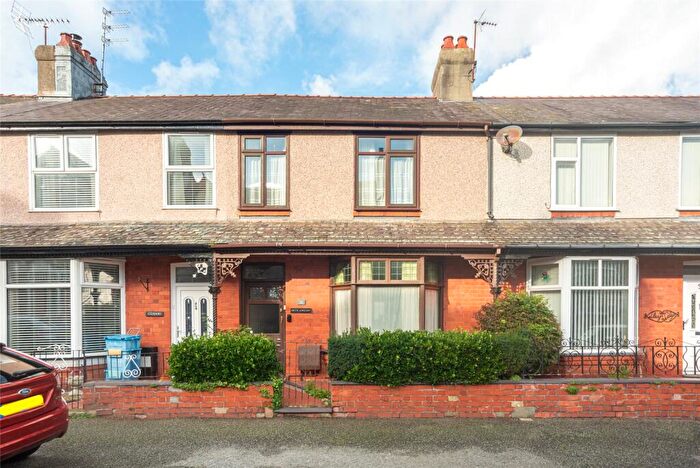
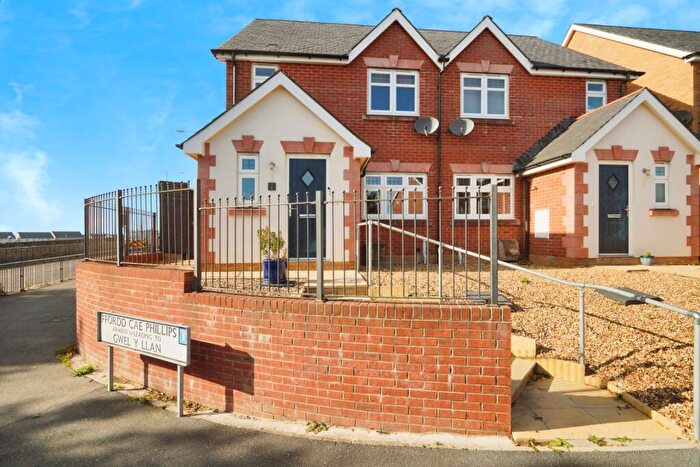
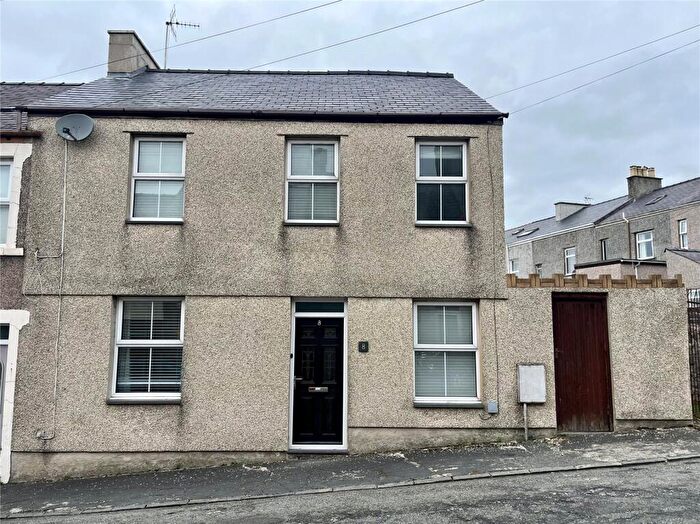
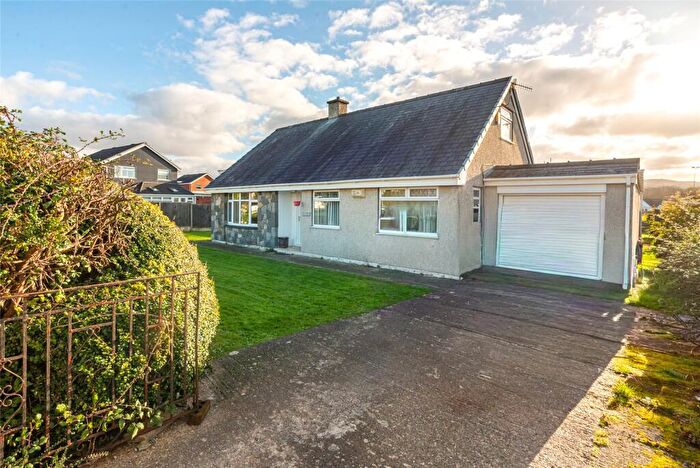
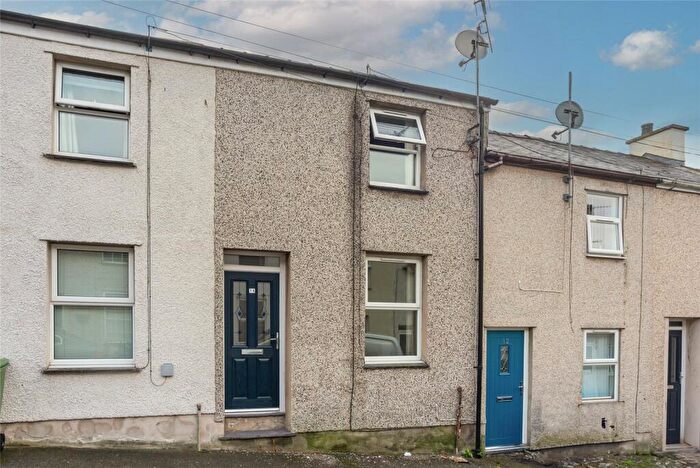
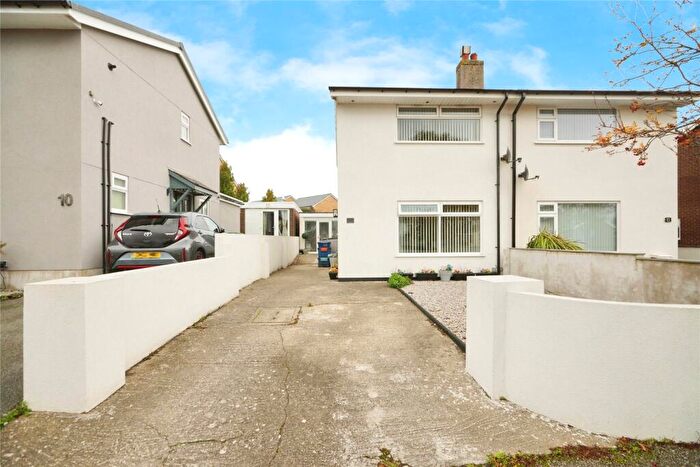
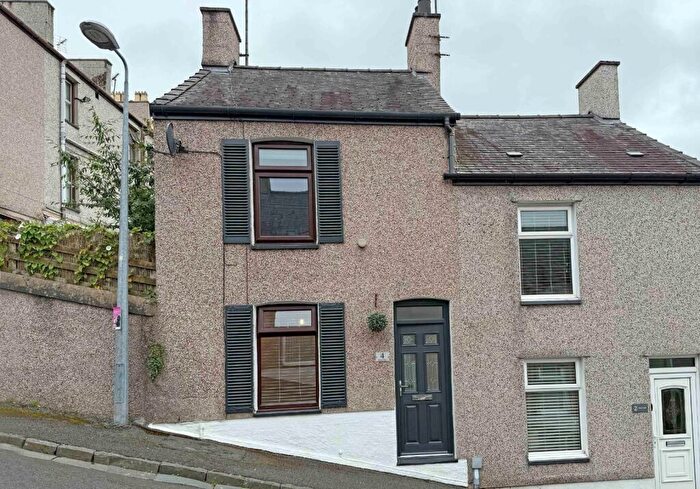
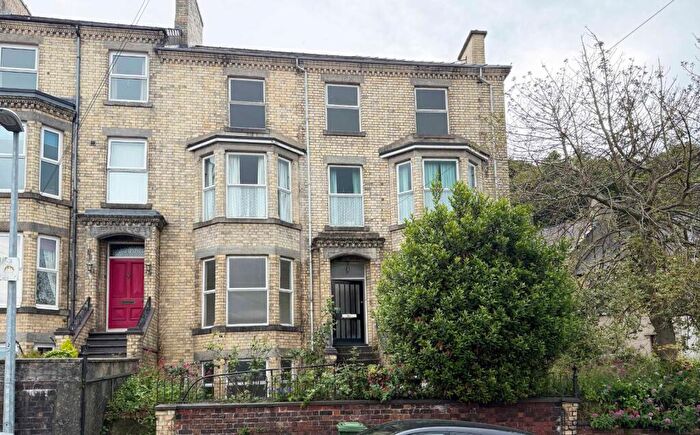
Houses for sale & to rent in Cadnant, Caernarfon
House Prices in Cadnant
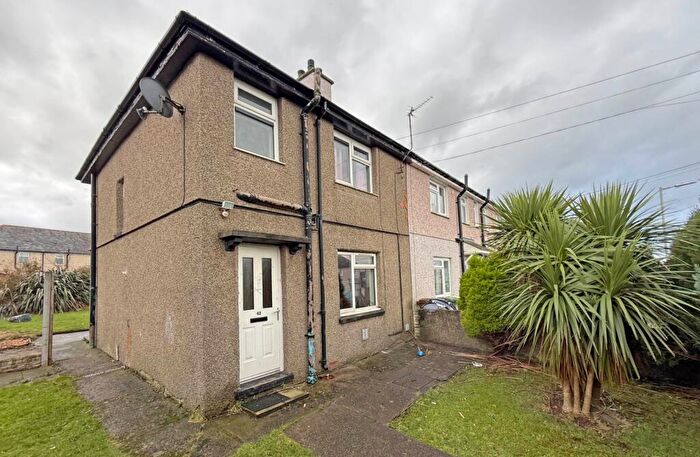
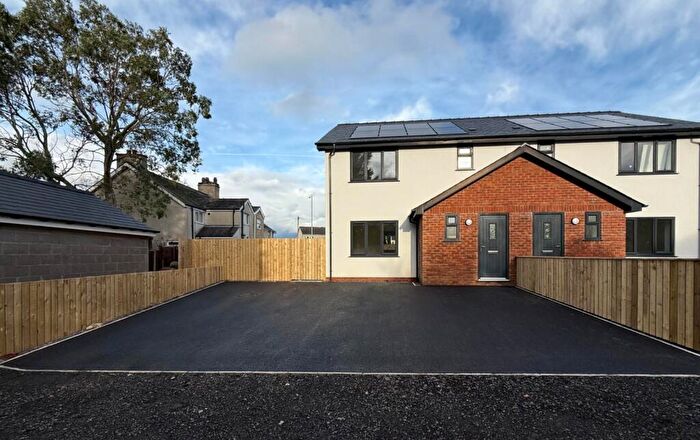
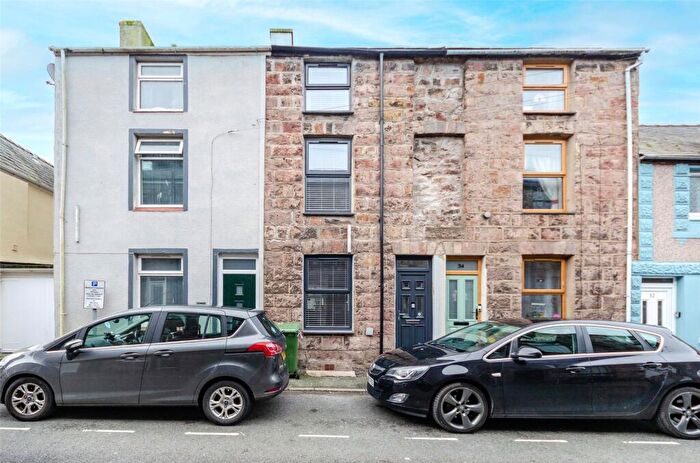
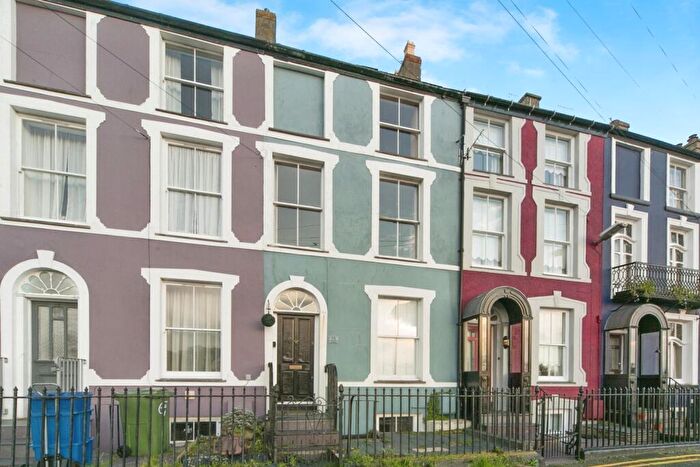
Properties in Cadnant have an average house price of £169,435.00 and had 54 Property Transactions within the last 3 years¹.
Cadnant is an area in Caernarfon, Gwynedd - Gwynedd with 948 households², where the most expensive property was sold for £355,000.00.
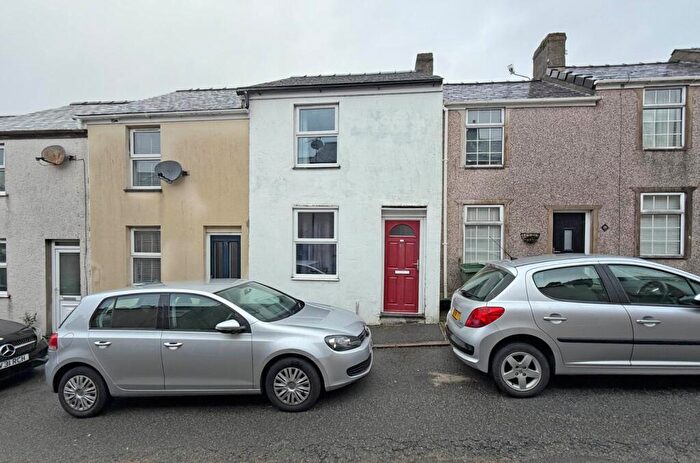
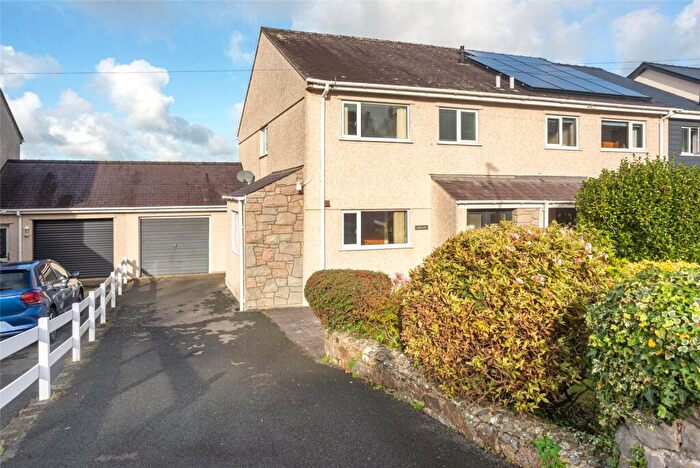
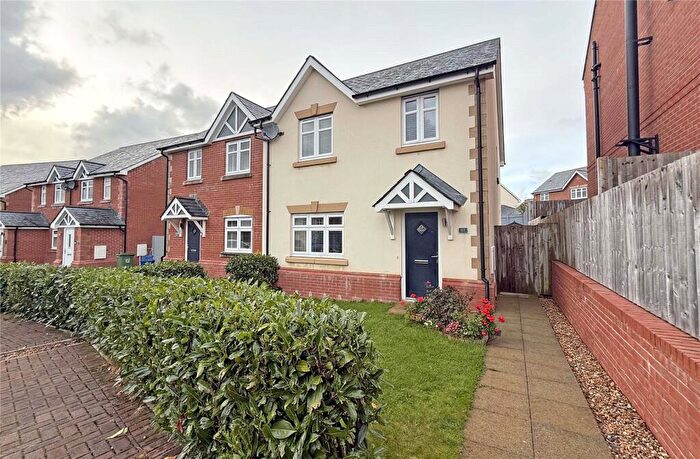
Properties for sale in Cadnant
Roads and Postcodes in Cadnant
Navigate through our locations to find the location of your next house in Cadnant, Caernarfon for sale or to rent.
| Streets | Postcodes |
|---|---|
| Bethel Road | LL55 1EB LL55 1UH |
| Bryn Rhos | LL55 2BT |
| Cadnant Road | LL55 1NA |
| Cae Berllan | LL55 1HH |
| Cae Garw Road | LL55 2BW |
| Cae Mur | LL55 1DA LL55 1DS |
| Castle Square | LL55 2NE |
| Clarke Terrace | LL55 2AW |
| Ffordd Cwellyn | LL55 1DT |
| Ffordd Elidir | LL55 1DR |
| Ffordd Glascoed | LL55 1DW |
| Hafod Terrace | LL55 2AR |
| Llanberis Road | LL55 2BL LL55 2BS LL55 2DE |
| Llwyn Ceirios | LL55 1DJ |
| Maes Cadnant | LL55 1BS |
| Maes Gwynedd | LL55 1DH LL55 1DL |
| Maes Hyfryd | LL55 1DN |
| Maesincla | LL55 1BY LL55 1DG |
| Maesincla Lane | LL55 1DD LL55 1BT LL55 1BU |
| Margaret Street | LL55 1NB |
| Mary Street | LL55 1NE |
| North Penrallt | LL55 1PP |
| Pengelli Wyn Estate | LL55 1EA |
| Plas Twthill | LL55 1PT |
| Pool Hill | LL55 1NP |
| Pool Lane | LL55 2AL |
| Pool Side | LL55 1NW |
| Pool Street | LL55 2AD |
| Rhoslan | LL55 2BJ |
| South Penrallt | LL55 1NS |
| William Street | LL55 1ND |
| Y Glyn | LL55 1HD LL55 1HE LL55 1HF LL55 1HG LL55 1HL |
| LL55 1DB LL55 1DE LL55 1DF LL55 1DP LL55 1ED LL55 1EE LL55 1EF LL55 1NN LL55 1PS LL55 1PU LL55 1RS LL55 2EJ |
Transport near Cadnant
- FAQ
- Price Paid By Year
- Property Type Price
Frequently asked questions about Cadnant
What is the average price for a property for sale in Cadnant?
The average price for a property for sale in Cadnant is £169,435. This amount is 18% lower than the average price in Caernarfon. There are 498 property listings for sale in Cadnant.
What streets have the most expensive properties for sale in Cadnant?
The streets with the most expensive properties for sale in Cadnant are Bryn Rhos at an average of £322,000, Bethel Road at an average of £290,000 and Llanberis Road at an average of £246,250.
What streets have the most affordable properties for sale in Cadnant?
The streets with the most affordable properties for sale in Cadnant are Pool Hill at an average of £94,189, North Penrallt at an average of £95,000 and William Street at an average of £102,250.
Which train stations are available in or near Cadnant?
Some of the train stations available in or near Cadnant are Llanfairpwll, Bangor (Gwynedd) and Bodorgan.
Property Price Paid in Cadnant by Year
The average sold property price by year was:
| Year | Average Sold Price | Price Change |
Sold Properties
|
|---|---|---|---|
| 2025 | £182,021 | 12% |
15 Properties |
| 2024 | £160,733 | -6% |
24 Properties |
| 2023 | £170,773 | -9% |
15 Properties |
| 2022 | £186,527 | 16% |
28 Properties |
| 2021 | £155,811 | 1% |
28 Properties |
| 2020 | £153,500 | 9% |
10 Properties |
| 2019 | £139,052 | 2% |
17 Properties |
| 2018 | £136,245 | -2% |
22 Properties |
| 2017 | £139,461 | 1% |
13 Properties |
| 2016 | £137,906 | -9% |
22 Properties |
| 2015 | £149,781 | 18% |
16 Properties |
| 2014 | £122,500 | -8% |
18 Properties |
| 2013 | £131,972 | -1% |
18 Properties |
| 2012 | £133,621 | 14% |
16 Properties |
| 2011 | £115,261 | 9% |
21 Properties |
| 2010 | £104,919 | -11% |
13 Properties |
| 2009 | £116,244 | -1% |
18 Properties |
| 2008 | £117,583 | -19% |
6 Properties |
| 2007 | £140,409 | -8% |
16 Properties |
| 2006 | £151,327 | 32% |
27 Properties |
| 2005 | £102,523 | -4% |
21 Properties |
| 2004 | £106,406 | 25% |
28 Properties |
| 2003 | £79,491 | 14% |
44 Properties |
| 2002 | £68,413 | 25% |
25 Properties |
| 2001 | £51,418 | 7% |
35 Properties |
| 2000 | £47,920 | -11% |
25 Properties |
| 1999 | £53,364 | 21% |
25 Properties |
| 1998 | £42,118 | -12% |
25 Properties |
| 1997 | £47,356 | 21% |
25 Properties |
| 1996 | £37,305 | -34% |
18 Properties |
| 1995 | £49,906 | - |
16 Properties |
Property Price per Property Type in Cadnant
Here you can find historic sold price data in order to help with your property search.
The average Property Paid Price for specific property types in the last three years are:
| Property Type | Average Sold Price | Sold Properties |
|---|---|---|
| Semi Detached House | £192,476.00 | 19 Semi Detached Houses |
| Detached House | £261,125.00 | 8 Detached Houses |
| Terraced House | £126,054.00 | 27 Terraced Houses |

