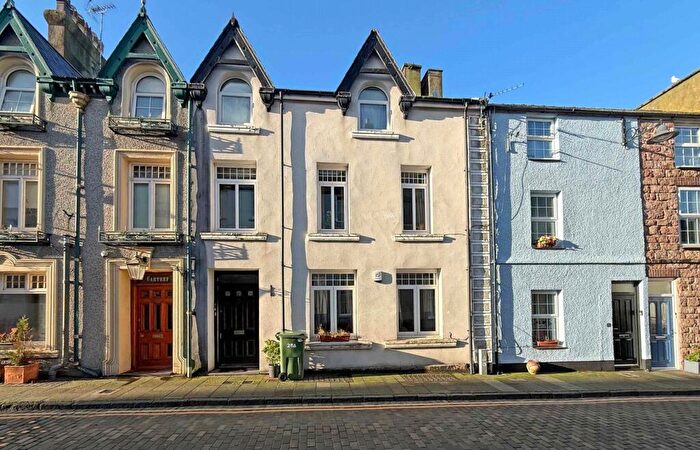
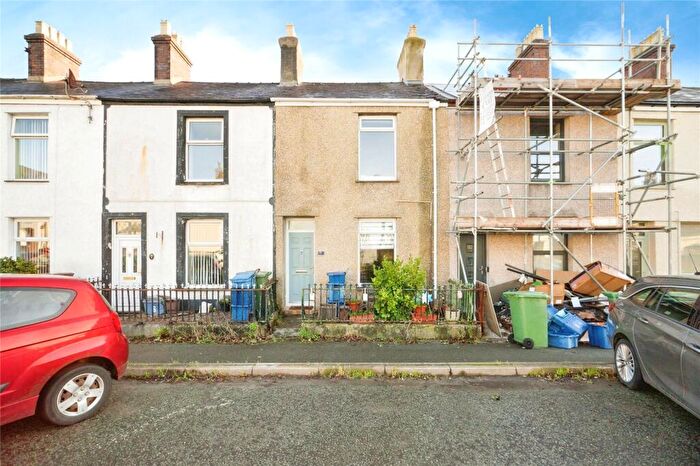
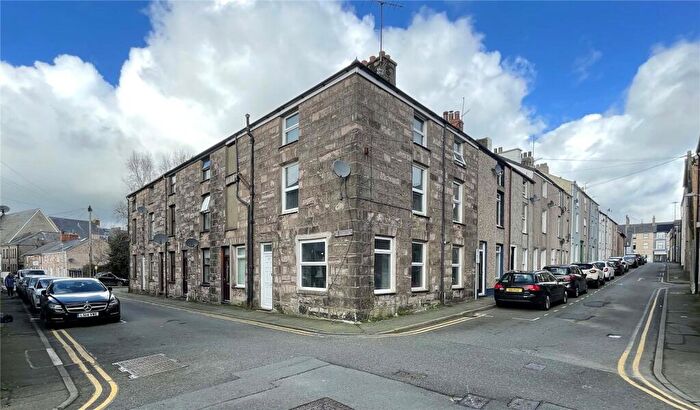
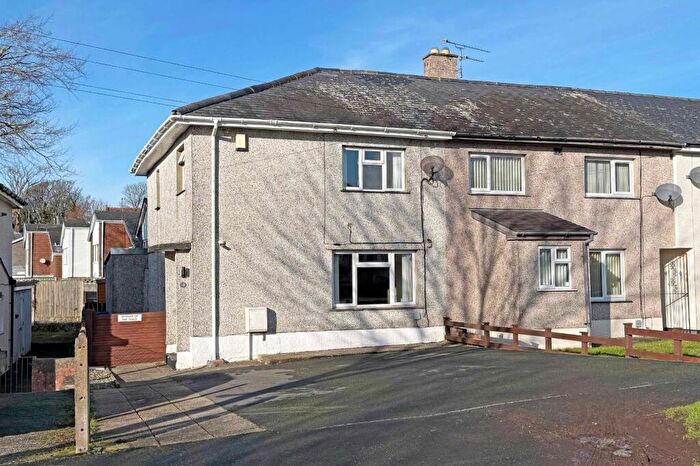
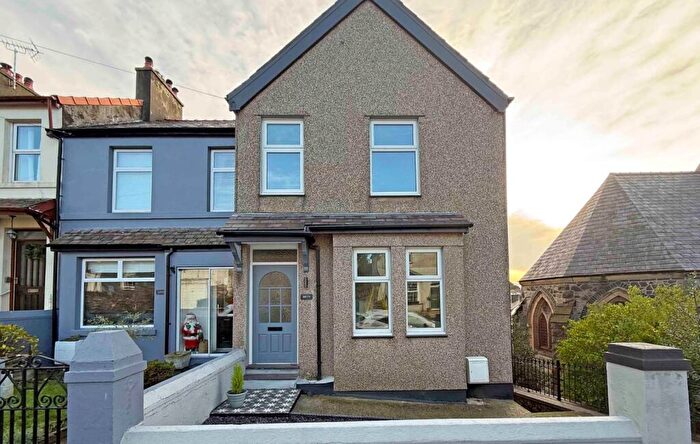
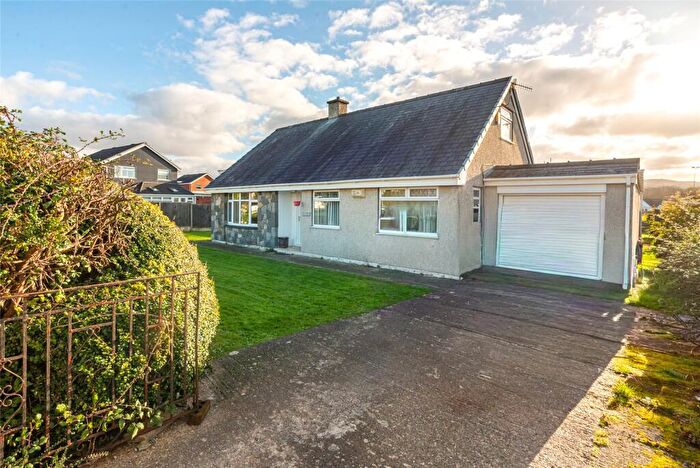
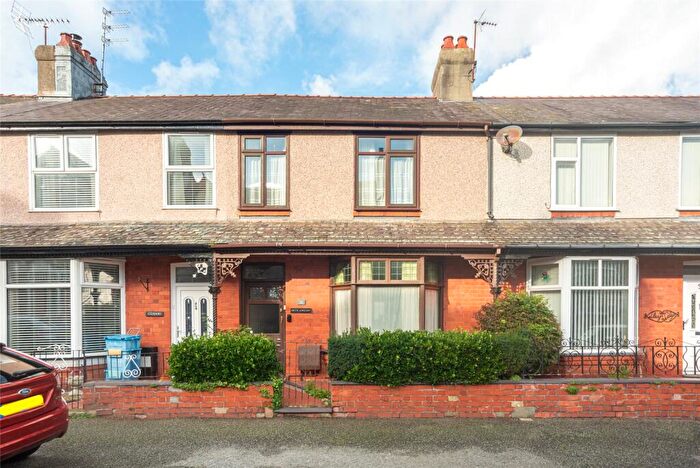
Houses for sale & to rent in Seiont, Caernarfon
House Prices in Seiont
Properties in Seiont have an average house price of £159,482.00 and had 91 Property Transactions within the last 3 years¹.
Seiont is an area in Caernarfon, Gwynedd - Gwynedd with 1,340 households², where the most expensive property was sold for £525,000.00.
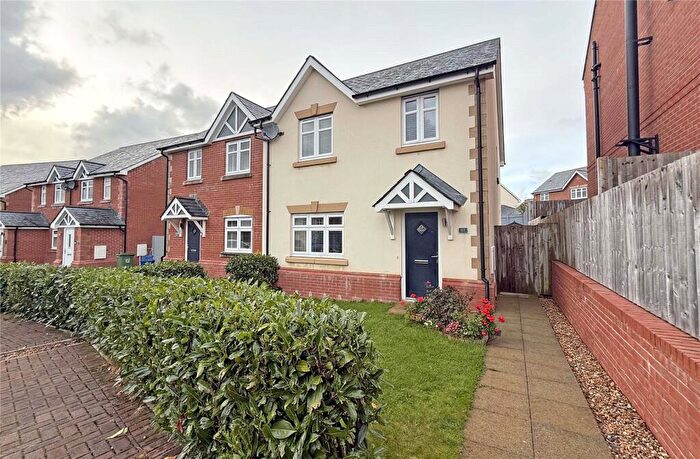
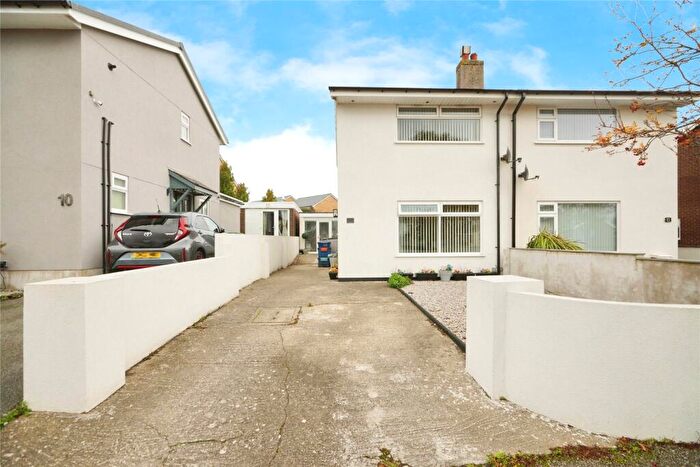
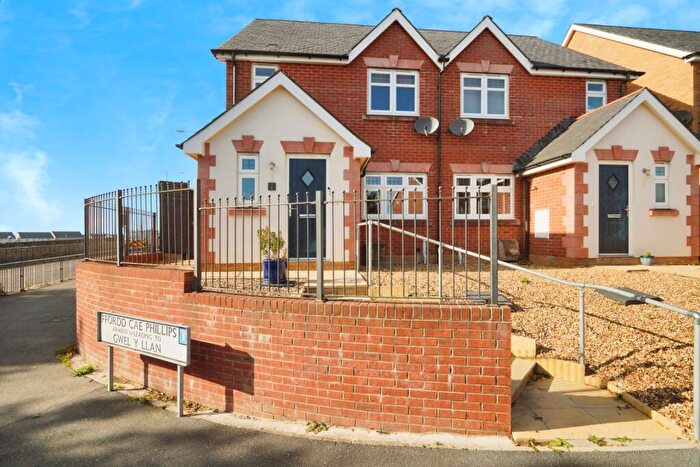
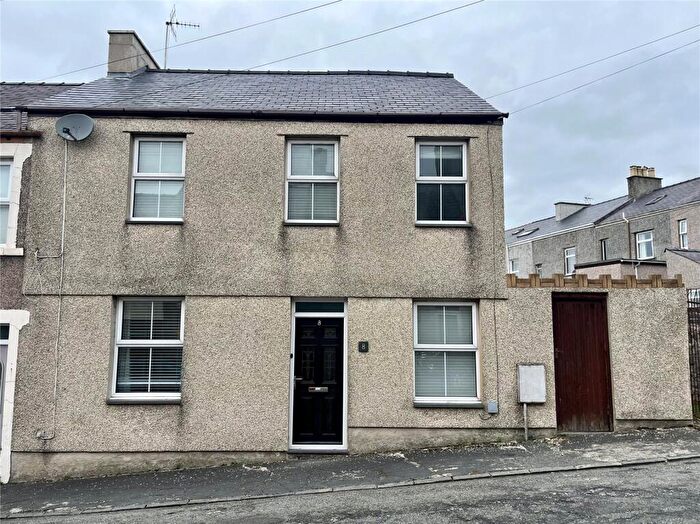
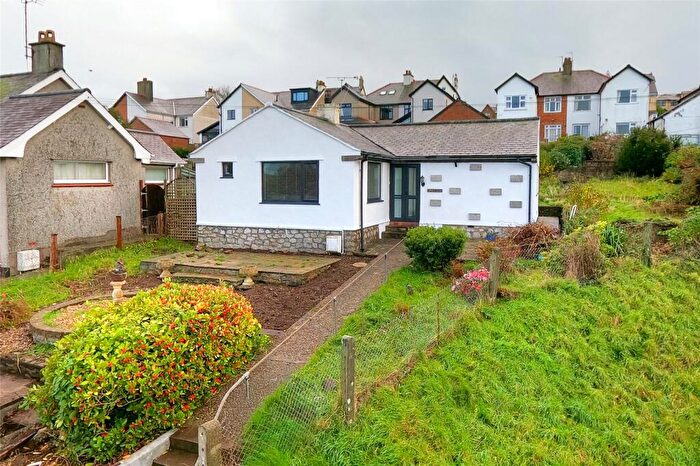
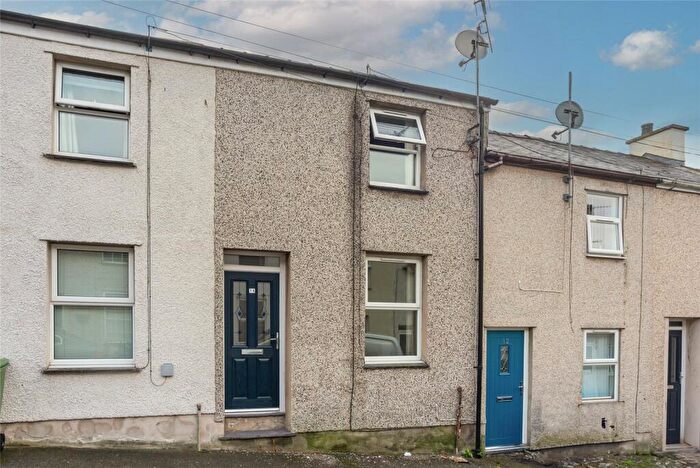
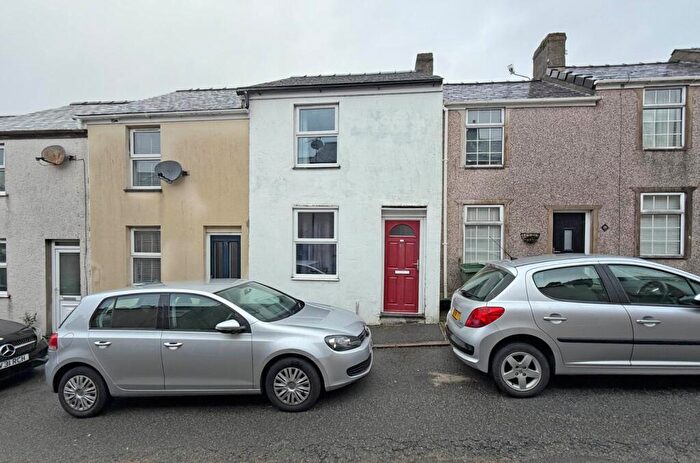
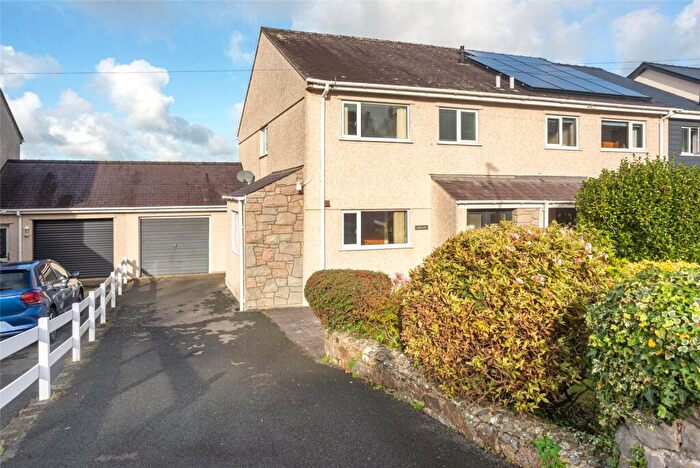
Properties for sale in Seiont
Roads and Postcodes in Seiont
Navigate through our locations to find the location of your next house in Seiont, Caernarfon for sale or to rent.
| Streets | Postcodes |
|---|---|
| Aber Foreshore Road | LL54 5RR |
| Assheton Terrace | LL55 2LD LL55 2LE |
| Beulah Square | LL55 2LA |
| Bridge Street | LL55 1AB LL55 1AF |
| Bro Helen | LL55 2HR |
| Bryn Eilian | LL55 2RX |
| Bryn Hyfryd | LL55 2UU |
| Cae Corn Hir | LL55 2LQ |
| Caeau Bach | LL55 2BZ |
| Caer Ymryson | LL55 2LR |
| Castle Ditch | LL55 2AU |
| Castle Hill | LL55 2PG |
| Castle Square | LL55 2NF LL55 2NA LL55 2NB LL55 2ND LL55 2NN LL55 2NP LL55 2WY |
| Castle Street | LL55 1SE |
| Cefn Hendre | LL55 2LP |
| Chapel Street | LL55 2PR LL55 2PS LL55 2PT |
| Coed Helen Road | LL54 5RS |
| Constantine Terrace | LL55 2HL |
| Cwm Silyn | LL55 2AG |
| Derwen Las | LL55 2UY |
| Eastgate Street | LL55 1AG |
| Ffordd Eryri | LL55 2UR LL55 2US |
| Gallt Y Sil | LL55 2SX |
| Garnon Street | LL55 2RB |
| Gelert Street | LL55 2LH |
| Glan Seiont | LL55 2DX |
| Hen Walia | LL55 2LB |
| Hendre Street | LL55 2HY |
| High Street | LL55 1RN |
| Hole In The Wall Street | LL55 1RF |
| Llanbeblig Road | LL55 2LW LL55 2SE |
| Llys Siabod | LL55 2LT |
| Llys Tryfan | LL55 2LS |
| Llys Y Foel | LL55 2LU |
| Llys Y Garn | LL55 2UT |
| Llys Yr Eifl | LL55 2LJ |
| Lon Cilgwyn | LL55 2DQ |
| Lon Oleuwen | LL55 2UP |
| Maes Meddyg | LL55 2SF |
| Marcus Street | LL55 2HT |
| Moel Eilio | LL55 2LZ |
| Muriau Park | LL55 2YR |
| New Street | LL55 2PU |
| Newborough Street | LL55 2HE |
| Palace Street | LL55 1RR |
| Pant Road | LL54 5RL LL55 2YN LL55 2YU |
| Pen Deitch | LL55 2AY |
| Pen Morfa | LL55 2DJ |
| Pen Y Bryn | LL55 2YT |
| Pool Street | LL55 2AB LL55 2AF LL55 2AS |
| Pwll Cefn Werthyd | LL54 5RG |
| Pwllheli Road | LL55 2YS LL55 2YW |
| Segontium Road South | LL55 2LL |
| Segontium Terrace | LL55 2PH LL55 2PN |
| Seiont Mill Road | LL55 2YL |
| Shirehall Street | LL55 1SH LL55 1ZH LL55 9ZX LL55 9ZZ |
| Skinner Street | LL55 1RB |
| Slate Quay | LL55 2PB |
| Snowdon Street | LL55 2RD |
| South Road | LL55 2HP LL55 2HS |
| St Helens Road | LL55 2PF LL55 2YB LL55 2YD LL55 2YG |
| St Helens Street | LL55 2HU |
| St Helens Terrace | LL55 2HW |
| The Park | LL55 2YE LL55 2YF |
| Tyddyn Llwydyn | LL55 2LX |
| Wellington Terrace | LL55 2HH |
| Wesley Street | LL55 2PQ |
| LL55 1SG LL55 1SN LL55 2LY LL55 2SZ |
Transport near Seiont
- FAQ
- Price Paid By Year
- Property Type Price
Frequently asked questions about Seiont
What is the average price for a property for sale in Seiont?
The average price for a property for sale in Seiont is £159,482. This amount is 23% lower than the average price in Caernarfon. There are 470 property listings for sale in Seiont.
What streets have the most expensive properties for sale in Seiont?
The streets with the most expensive properties for sale in Seiont are Pant Road at an average of £353,894, Pen Morfa at an average of £330,000 and Cae Corn Hir at an average of £310,000.
What streets have the most affordable properties for sale in Seiont?
The streets with the most affordable properties for sale in Seiont are Newborough Street at an average of £55,500, Pool Street at an average of £61,135 and High Street at an average of £85,000.
Which train stations are available in or near Seiont?
Some of the train stations available in or near Seiont are Llanfairpwll, Bodorgan and Bangor (Gwynedd).
Property Price Paid in Seiont by Year
The average sold property price by year was:
| Year | Average Sold Price | Price Change |
Sold Properties
|
|---|---|---|---|
| 2025 | £148,501 | -5% |
32 Properties |
| 2024 | £156,589 | -12% |
32 Properties |
| 2023 | £175,927 | 5% |
27 Properties |
| 2022 | £166,385 | 10% |
47 Properties |
| 2021 | £149,770 | -7% |
50 Properties |
| 2020 | £160,046 | 19% |
53 Properties |
| 2019 | £129,390 | -21% |
33 Properties |
| 2018 | £156,189 | 14% |
37 Properties |
| 2017 | £134,362 | 2% |
33 Properties |
| 2016 | £131,116 | 6% |
37 Properties |
| 2015 | £123,862 | -1% |
44 Properties |
| 2014 | £125,135 | -2% |
45 Properties |
| 2013 | £127,403 | -9% |
31 Properties |
| 2012 | £139,346 | 9% |
36 Properties |
| 2011 | £127,113 | 7% |
37 Properties |
| 2010 | £117,622 | -8% |
43 Properties |
| 2009 | £127,493 | -15% |
39 Properties |
| 2008 | £146,510 | 17% |
38 Properties |
| 2007 | £121,443 | -7% |
57 Properties |
| 2006 | £130,032 | 5% |
40 Properties |
| 2005 | £123,987 | 27% |
54 Properties |
| 2004 | £90,405 | 5% |
65 Properties |
| 2003 | £86,096 | 36% |
61 Properties |
| 2002 | £54,956 | 4% |
74 Properties |
| 2001 | £52,767 | 5% |
86 Properties |
| 2000 | £50,016 | 11% |
86 Properties |
| 1999 | £44,740 | -12% |
43 Properties |
| 1998 | £50,042 | 16% |
58 Properties |
| 1997 | £42,095 | 8% |
40 Properties |
| 1996 | £38,771 | 3% |
52 Properties |
| 1995 | £37,442 | - |
32 Properties |
Property Price per Property Type in Seiont
Here you can find historic sold price data in order to help with your property search.
The average Property Paid Price for specific property types in the last three years are:
| Property Type | Average Sold Price | Sold Properties |
|---|---|---|
| Semi Detached House | £195,317.00 | 20 Semi Detached Houses |
| Detached House | £297,480.00 | 11 Detached Houses |
| Terraced House | £131,583.00 | 52 Terraced Houses |
| Flat | £61,493.00 | 8 Flats |

