
Houses for sale & to rent in Llanwnda, Caernarfon
House Prices in Llanwnda
Properties in Llanwnda have an average house price of £214k and had 65 Property Transactions within the last 3 years¹.
Llanwnda is an area in Caernarfon, Gwynedd - Gwynedd with 826 households², where the most expensive property was sold for £525k.
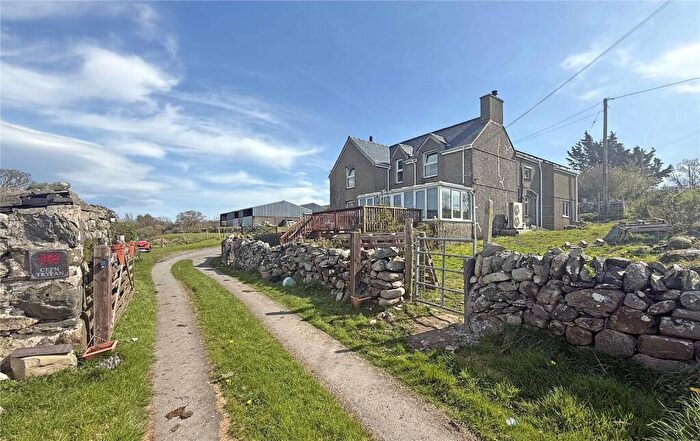
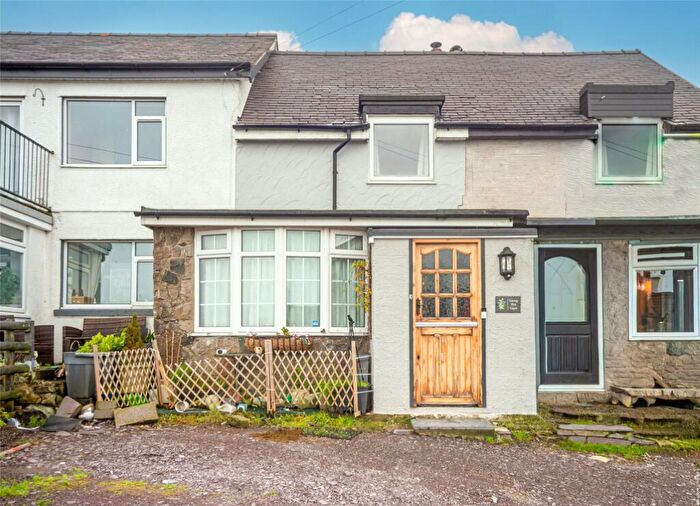
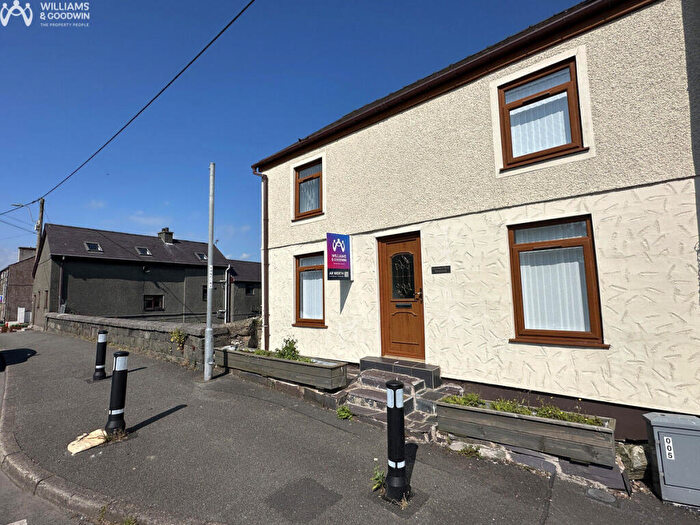
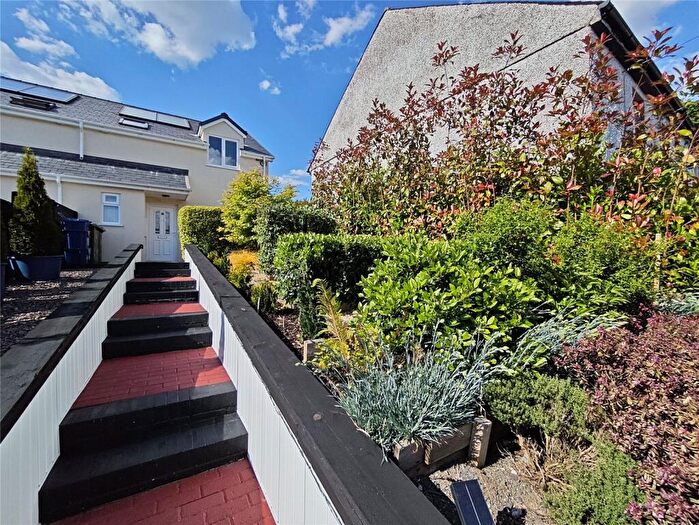
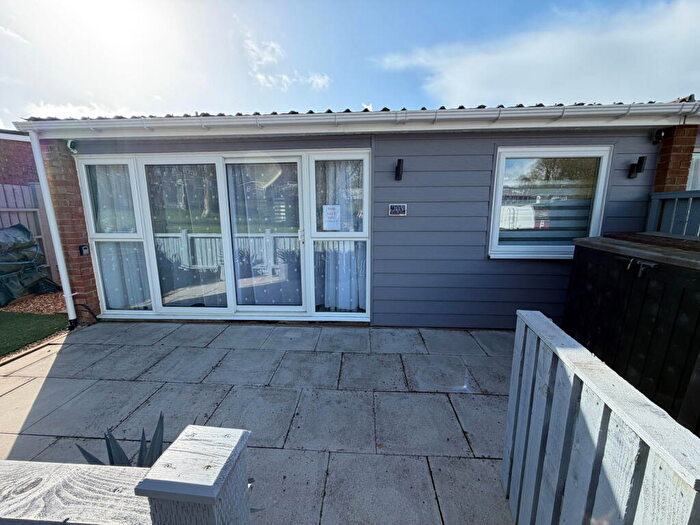
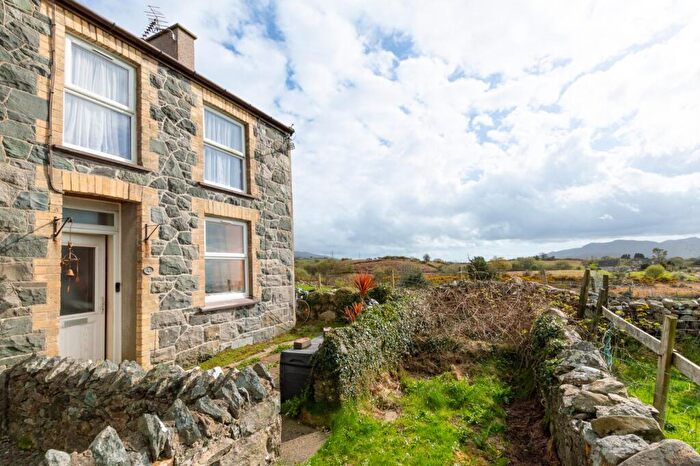
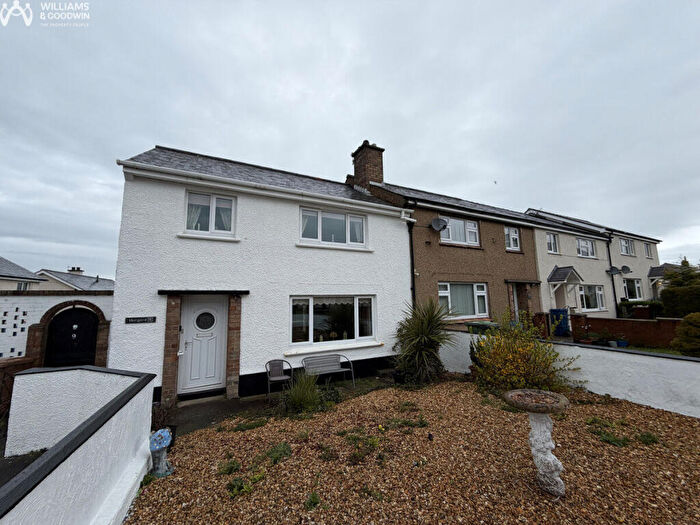
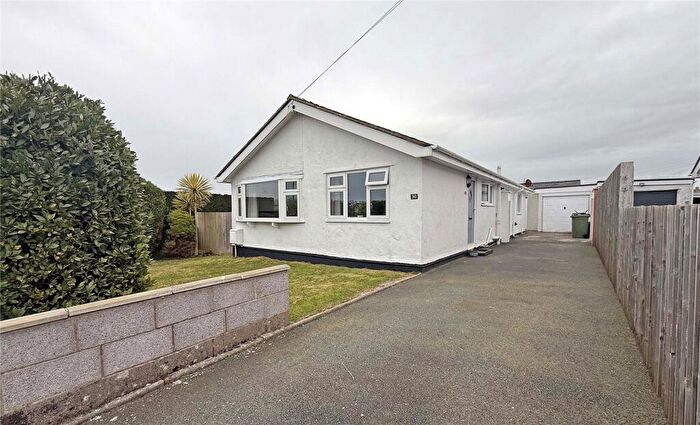
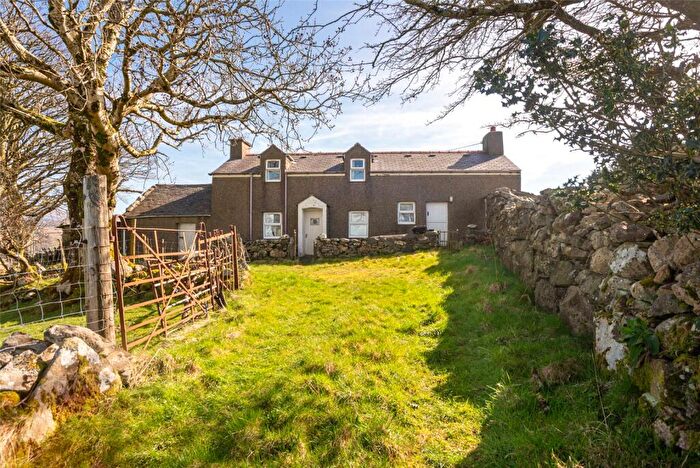
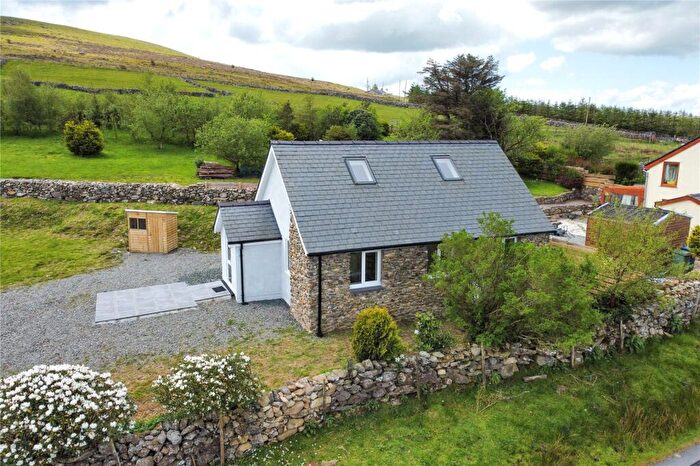
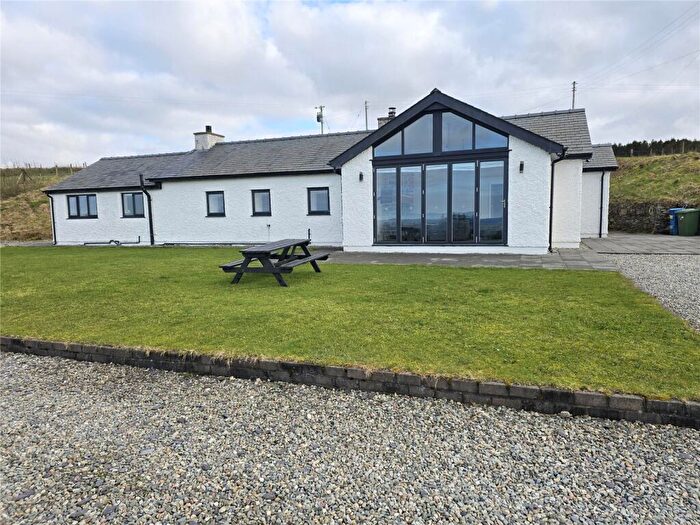
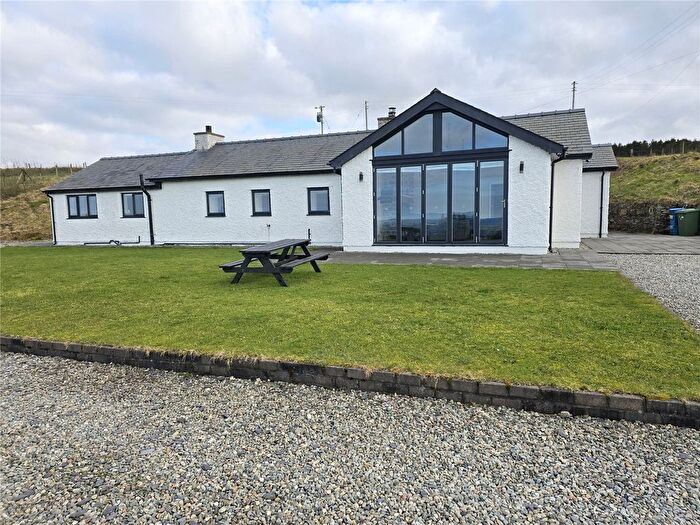
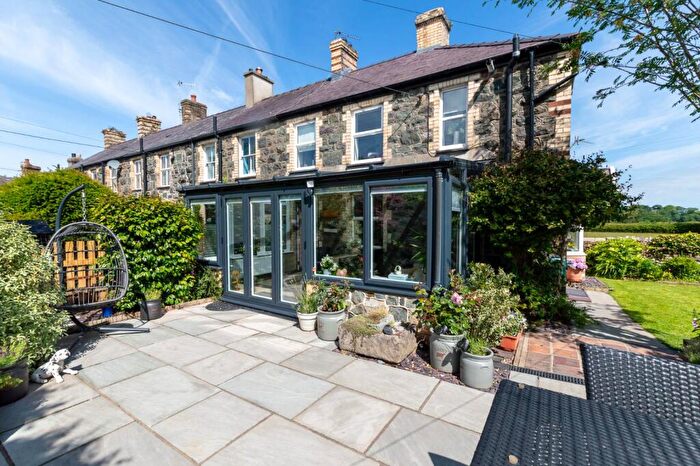
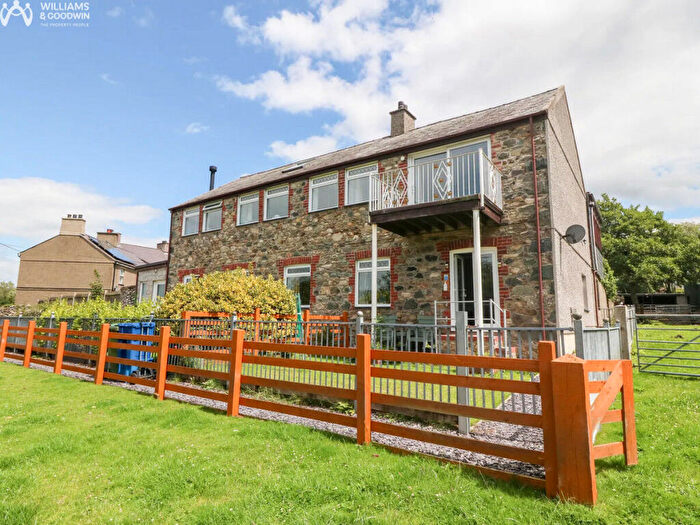
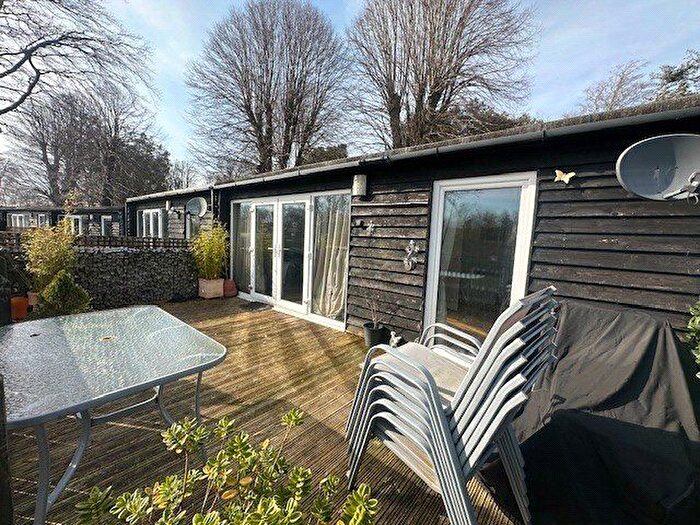
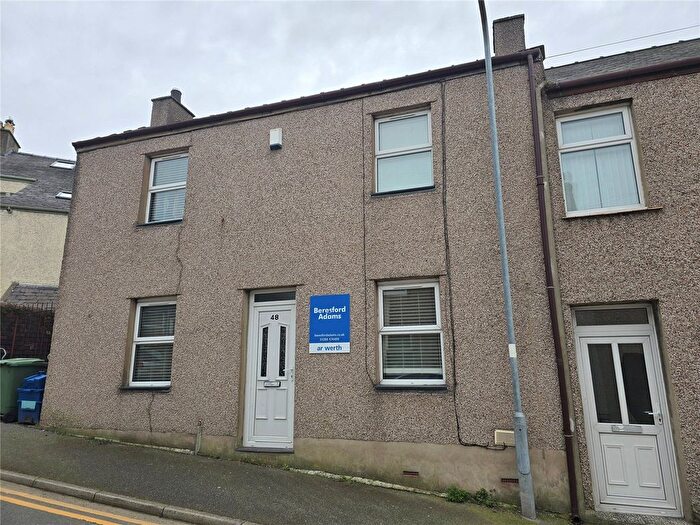
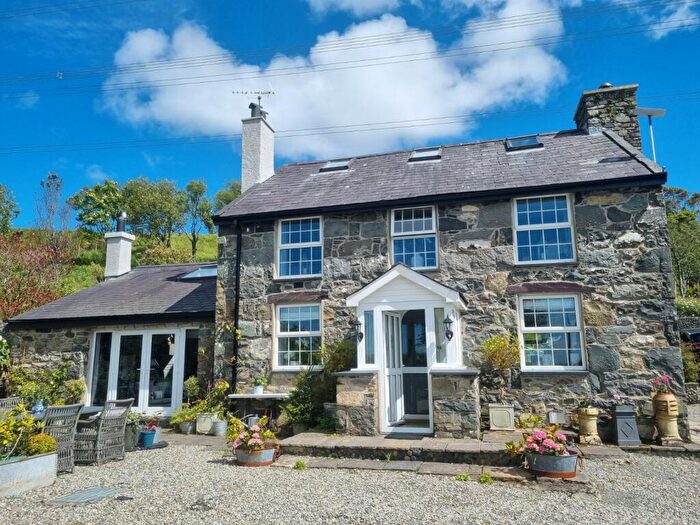
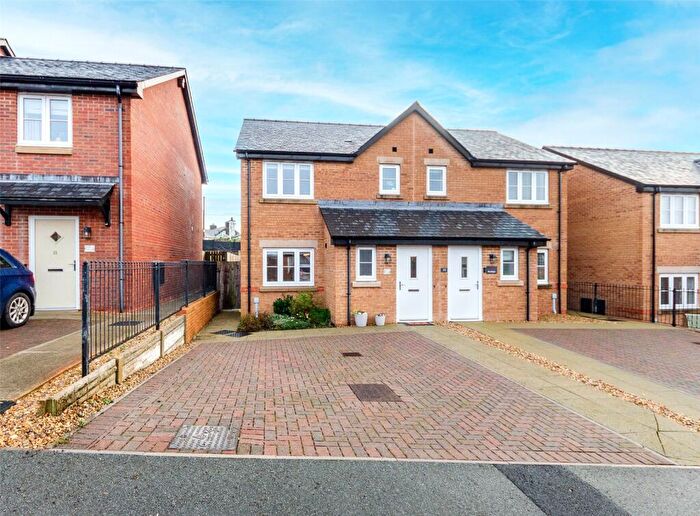
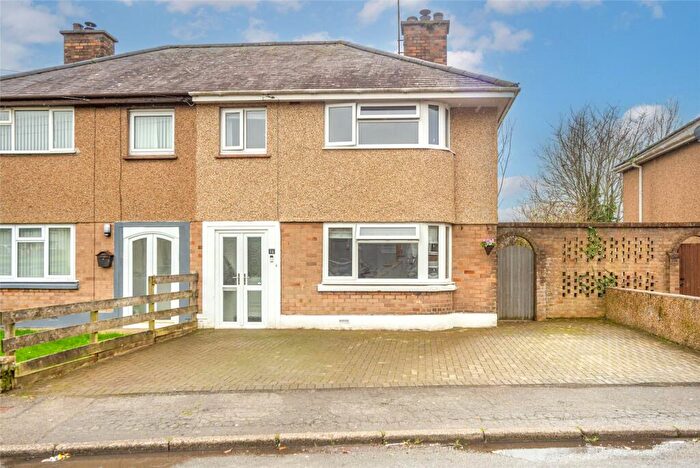
Properties for sale in Llanwnda
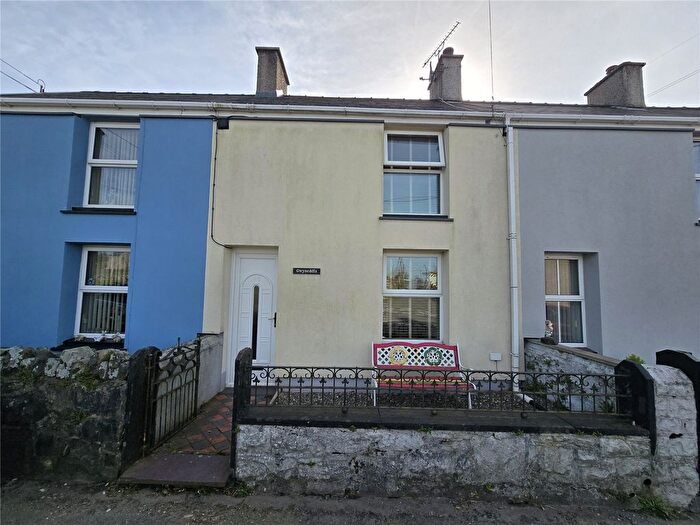
![]()
If you are looking to sell your house, let it out, or receive a property valuation, an expert can help you.
Click the button below to get started.
Roads and Postcodes in Llanwnda
Navigate through our locations to find the location of your next house in Llanwnda, Caernarfon for sale or to rent.
Transport near Llanwnda
-
 Llanfairpwll Station
 -
Bangor (Gwynedd) Station
-
Bodorgan Station
-
Criccieth Station
-
Porthmadog Station
-
Ty Croes Station
-
Minffordd Station
-
Penychain Station
-
Penrhyndeudraeth Station
-
Rhosneigr Station
- FAQ
- Price Paid By Year
- Property Type Price
Frequently asked questions about Llanwnda
What is the average price for a property for sale in Llanwnda?
The average price for a property for sale in Llanwnda is £214,254. This amount is 4% higher than the average price in Caernarfon. There are 647 property listings for sale in Llanwnda.
What streets have the most expensive properties for sale in Llanwnda?
The streets with the most expensive properties for sale in Llanwnda are Tan Yr Allt at an average of £345,000, Dinas Estate at an average of £262,500 and Minffordd Terrace at an average of £233,000.
What streets have the most affordable properties for sale in Llanwnda?
The streets with the most affordable properties for sale in Llanwnda are Bron Eryri Terrace at an average of £99,333, Llety at an average of £105,000 and Dreflan at an average of £129,000.
Which train stations are available in or near Llanwnda?
Some of the train stations available in or near Llanwnda are Llanfairpwll, Bangor (Gwynedd) and Bodorgan.
Property Price Paid in Llanwnda by Year
The average sold property price by year was:
| Year | Average Sold Price | Price Change |
Sold Properties
|
|---|---|---|---|
| 2025 | £197,105 | -3% |
19 Properties |
| 2024 | £203,060 | -20% |
25 Properties |
| 2023 | £243,097 | -10% |
21 Properties |
| 2022 | £267,358 | 29% |
28 Properties |
| 2021 | £191,075 | -4% |
35 Properties |
| 2020 | £199,072 | 5% |
27 Properties |
| 2019 | £190,042 | 8% |
35 Properties |
| 2018 | £174,236 | 20% |
23 Properties |
| 2017 | £139,950 | -28% |
24 Properties |
| 2016 | £179,542 | 12% |
25 Properties |
| 2015 | £157,290 | 7% |
28 Properties |
| 2014 | £146,587 | -27% |
29 Properties |
| 2013 | £185,821 | 33% |
21 Properties |
| 2012 | £124,178 | -29% |
14 Properties |
| 2011 | £159,760 | -5% |
23 Properties |
| 2010 | £167,541 | -5% |
18 Properties |
| 2009 | £175,940 | -30% |
21 Properties |
| 2008 | £228,976 | 23% |
11 Properties |
| 2007 | £177,220 | -3% |
27 Properties |
| 2006 | £182,687 | 19% |
24 Properties |
| 2005 | £147,621 | 14% |
22 Properties |
| 2004 | £126,640 | 11% |
15 Properties |
| 2003 | £112,450 | 14% |
28 Properties |
| 2002 | £97,103 | 18% |
39 Properties |
| 2001 | £79,748 | 7% |
35 Properties |
| 2000 | £73,930 | 32% |
23 Properties |
| 1999 | £50,209 | -13% |
32 Properties |
| 1998 | £56,648 | 36% |
30 Properties |
| 1997 | £36,024 | -45% |
25 Properties |
| 1996 | £52,168 | -4% |
24 Properties |
| 1995 | £54,400 | - |
10 Properties |
Property Price per Property Type in Llanwnda
Here you can find historic sold price data in order to help with your property search.
The average Property Paid Price for specific property types in the last three years are:
| Property Type | Average Sold Price | Sold Properties |
|---|---|---|
| Semi Detached House | £198,870.00 | 15 Semi Detached Houses |
| Detached House | £280,637.00 | 29 Detached Houses |
| Terraced House | £133,571.00 | 21 Terraced Houses |