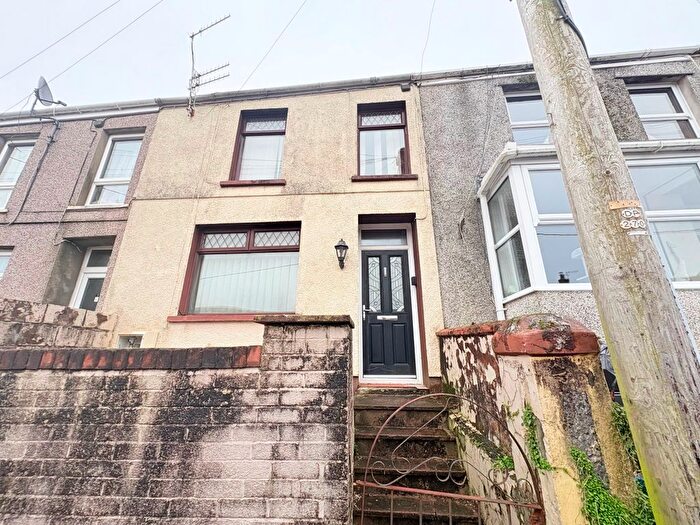
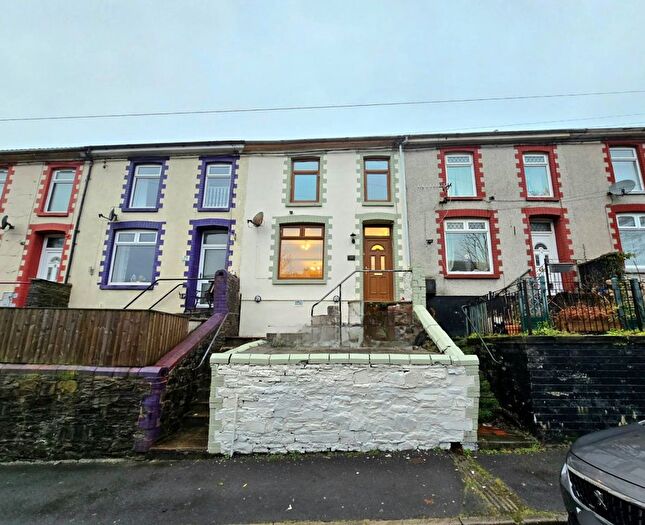
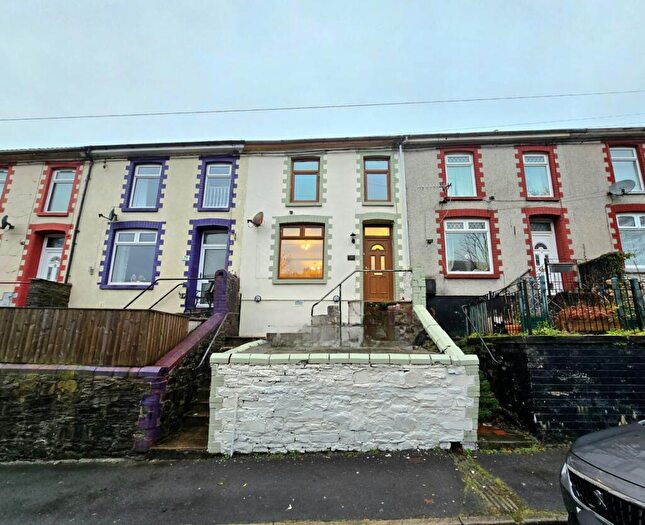
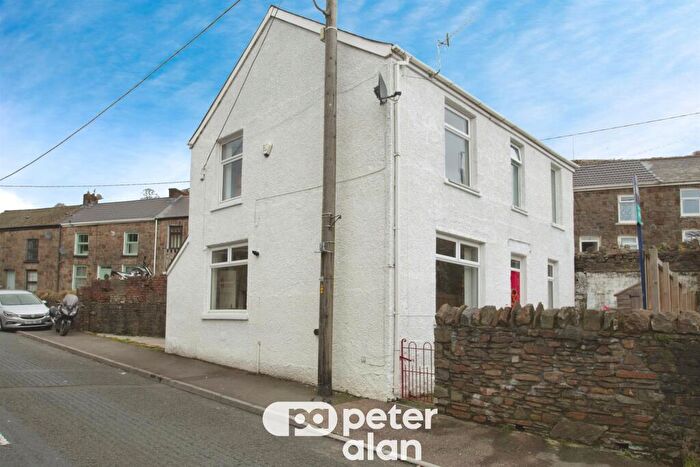
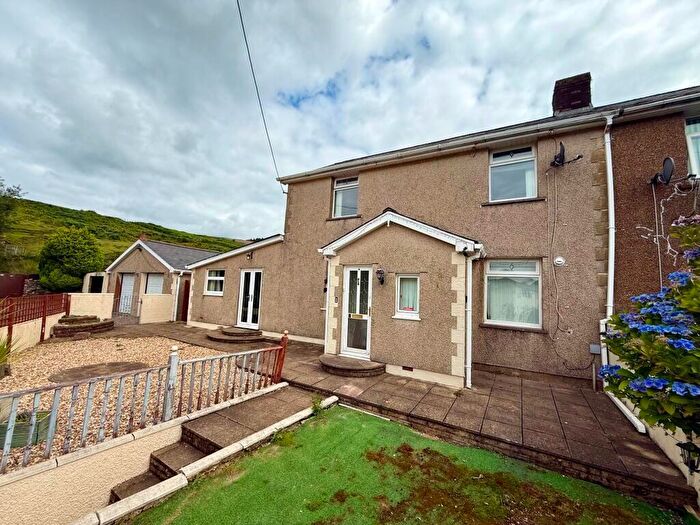
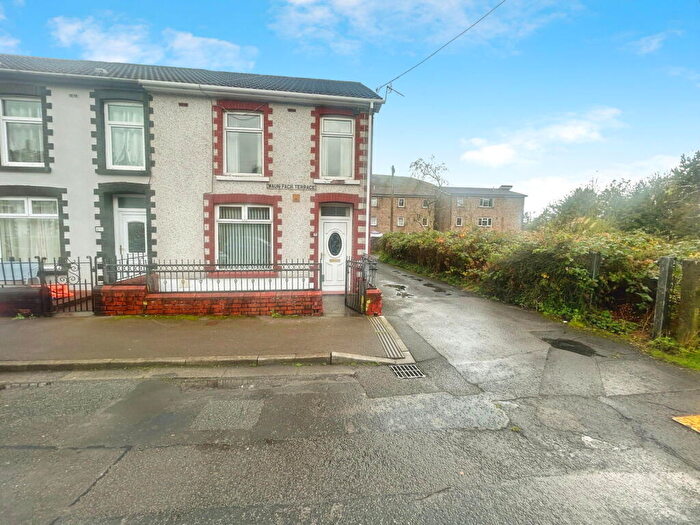
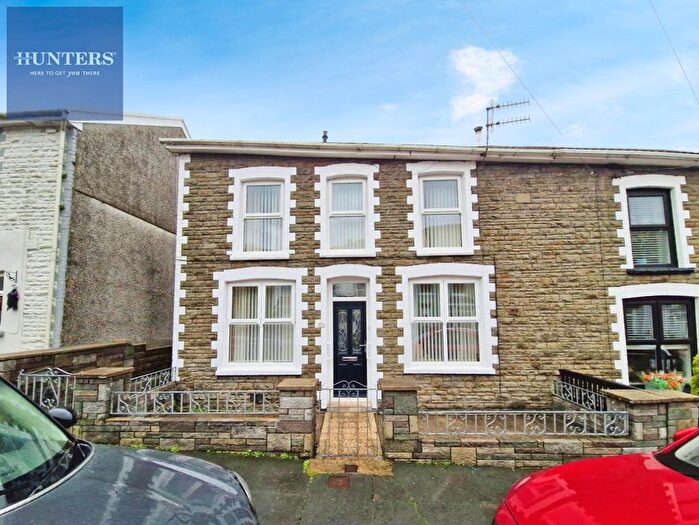
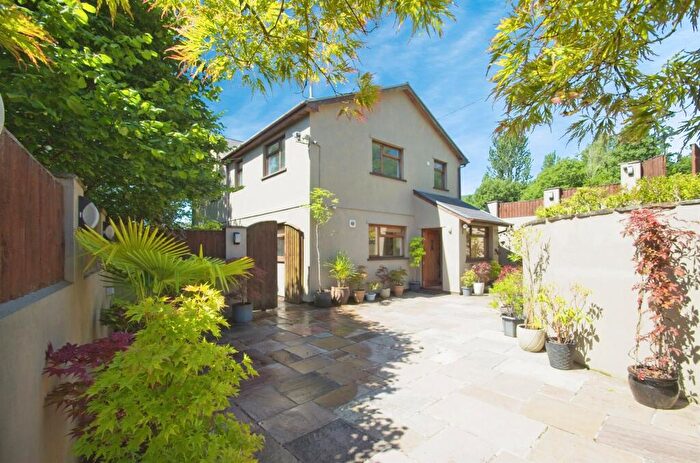
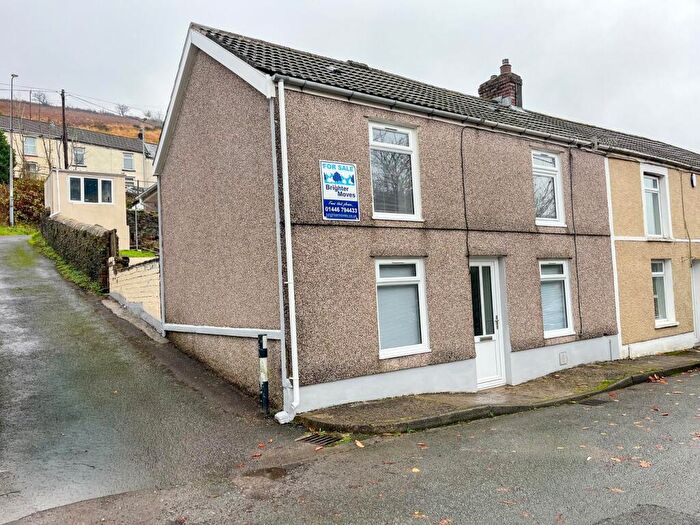
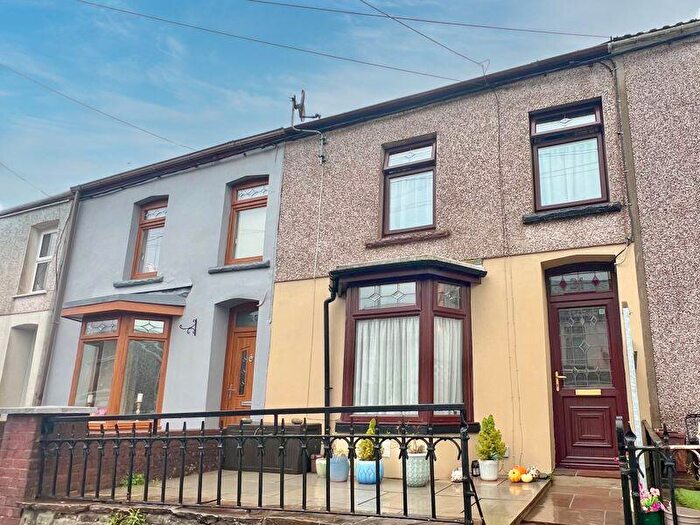
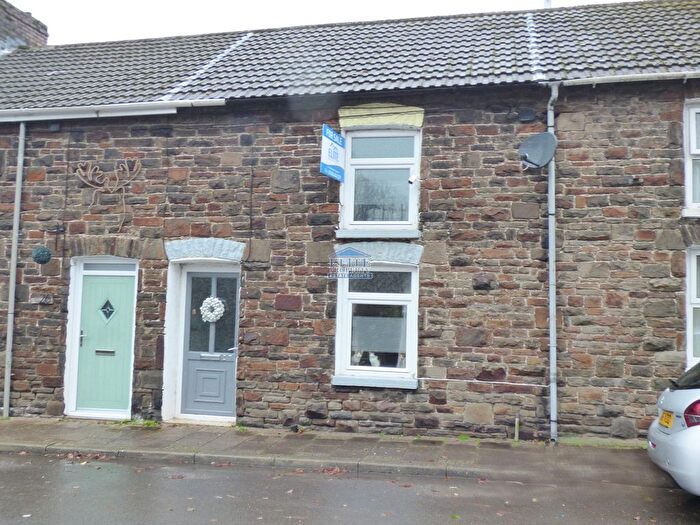
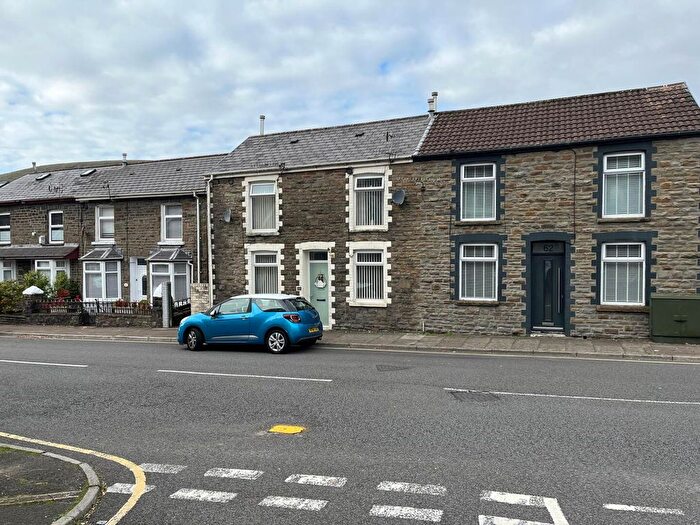
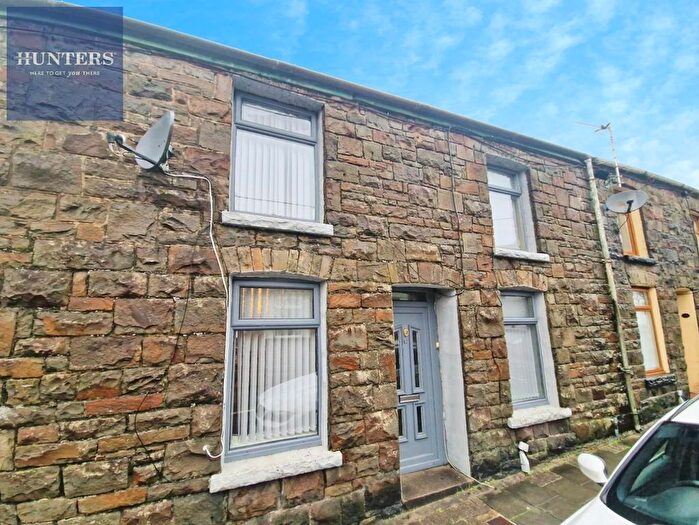
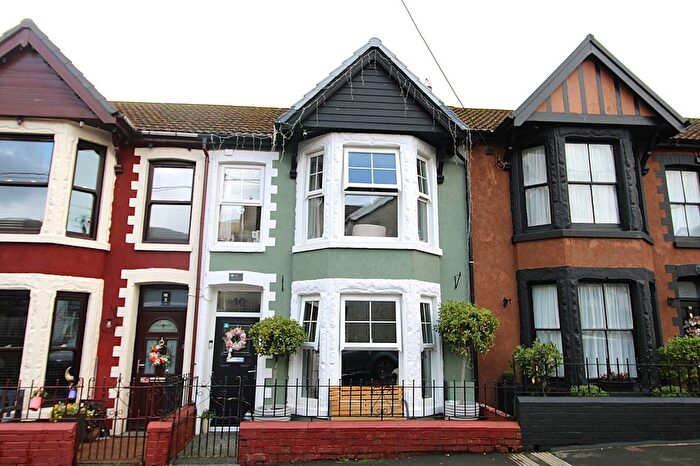
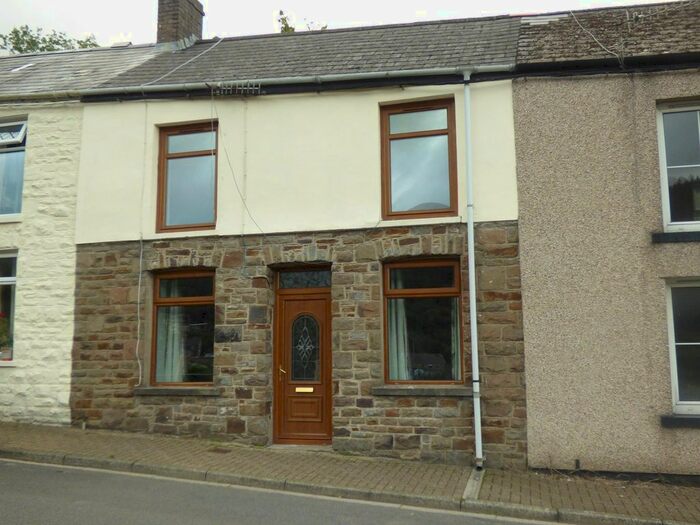
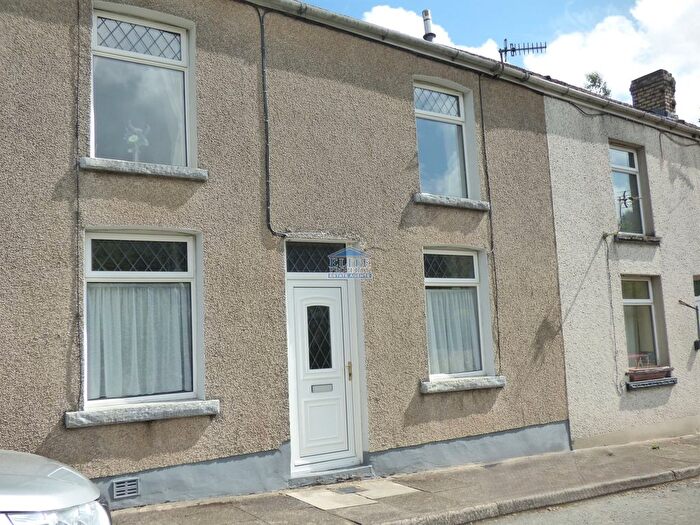
Houses for sale & to rent in Nant-y-moel, Bridgend
House Prices in Nant-y-moel
Properties in Nant-y-moel have an average house price of £115,319.00 and had 84 Property Transactions within the last 3 years¹.
Nant-y-moel is an area in Bridgend, Pen-y-bont ar Ogwr - Bridgend with 1,025 households², where the most expensive property was sold for £353,000.00.
Properties for sale in Nant-y-moel
Previously listed properties in Nant-y-moel
Roads and Postcodes in Nant-y-moel
Navigate through our locations to find the location of your next house in Nant-y-moel, Bridgend for sale or to rent.
| Streets | Postcodes |
|---|---|
| Aberfields View | CF32 7SJ |
| Arnant Villas | CF32 7PW |
| Blaen Ogwr Court | CF32 7SB |
| Blaenogwr Terrace | CF32 7NG |
| Blandy Terrace | CF32 7NR |
| Brookland Terrace | CF32 7SY |
| Brynhyfryd | CF32 7RN |
| Brynogwy Terrace | CF32 7ST |
| Cadogan Street | CF32 7TB |
| Cardigan Terrace | CF32 7NH |
| Chapel Street | CF32 7NF |
| Church Terrace | CF32 7PE |
| Commercial Street | CF32 7NW CF32 7RA CF32 7RB |
| Court Colman Street | CF32 7RL |
| Craig Fryn Terrace | CF32 7PD |
| Dan Y Bryn | CF32 7NU |
| Dinam Close | CF32 7PQ |
| Dinam Street | CF32 7NE CF32 7NN CF32 7PU |
| Garon Terrace | CF32 7RH |
| Glanavon Terrace | CF32 7RP |
| Gwendoline Street | CF32 7PN CF32 7PL |
| Heol Ganol | CF32 7NT |
| Heol Y Fedwen | CF32 7NS |
| Hill Street | CF32 7SW |
| Howell Street | CF32 7RE |
| John Street | CF32 7SU |
| Llanharan Terrace | CF32 7TA |
| Llewellyn Street | CF32 7RF |
| Nantymoel Row | CF32 7RW |
| Oakfield Terrace | CF32 7SR CF32 7SS |
| Ogmore Terrace | CF32 7NL |
| Ogwy Street | CF32 7NA CF32 7SA CF32 7SE CF32 7SG CF32 7SH CF32 7SN |
| Osborne Terrace | CF32 7NP |
| Park Street | CF32 7SF |
| Pembroke Terrace | CF32 7NY |
| Rhodfas Machlud | CF32 7NX |
| Rowland Terrace | CF32 7PA |
| Station Road | CF32 7RD |
| Stormy Lane | CF32 7TD |
| Tegfan | CF32 7NJ |
| Teify Crescent | CF32 7RG |
| The Bungalows | CF32 7SP |
| Vale View Terrace | CF32 7PB |
| Waun Fach | CF32 7PR |
| Waun Goch Terrace | CF32 7PS CF32 7PT |
| Waun Llwyd Terrace | CF32 7PP |
| Waun Wen Terrace | CF32 7NB CF32 7ND |
| Woodlands Grove | CF32 7RR |
| CF32 7RJ |
Transport near Nant-y-moel
-
Treorchy Station
-
Ton Pentre Station
-
Ynyswen Station
-
Ystrad Rhondda Station
-
Treherbert Station
-
Llwynypia Station
-
Tonypandy Station
-
Dinas (Rhondda) Station
-
Garth (Mid-Glamorgan) Station
-
Maesteg (Ewenny Road) Station
- FAQ
- Price Paid By Year
- Property Type Price
Frequently asked questions about Nant-y-moel
What is the average price for a property for sale in Nant-y-moel?
The average price for a property for sale in Nant-y-moel is £115,319. This amount is 47% lower than the average price in Bridgend. There are 385 property listings for sale in Nant-y-moel.
What streets have the most expensive properties for sale in Nant-y-moel?
The streets with the most expensive properties for sale in Nant-y-moel are Osborne Terrace at an average of £221,500, Tegfan at an average of £195,000 and Arnant Villas at an average of £165,500.
What streets have the most affordable properties for sale in Nant-y-moel?
The streets with the most affordable properties for sale in Nant-y-moel are Ogmore Terrace at an average of £50,000, Blaenogwr Terrace at an average of £70,000 and Heol Ganol at an average of £75,000.
Which train stations are available in or near Nant-y-moel?
Some of the train stations available in or near Nant-y-moel are Treorchy, Ton Pentre and Ynyswen.
Property Price Paid in Nant-y-moel by Year
The average sold property price by year was:
| Year | Average Sold Price | Price Change |
Sold Properties
|
|---|---|---|---|
| 2025 | £122,613 | 9% |
22 Properties |
| 2024 | £111,918 | -2% |
33 Properties |
| 2023 | £113,655 | 8% |
29 Properties |
| 2022 | £104,931 | 4% |
60 Properties |
| 2021 | £100,917 | 21% |
48 Properties |
| 2020 | £80,166 | 2% |
40 Properties |
| 2019 | £78,866 | -6% |
49 Properties |
| 2018 | £83,851 | 7% |
48 Properties |
| 2017 | £77,655 | 5% |
38 Properties |
| 2016 | £73,433 | 3% |
45 Properties |
| 2015 | £71,021 | 7% |
47 Properties |
| 2014 | £66,050 | 4% |
43 Properties |
| 2013 | £63,405 | -4% |
34 Properties |
| 2012 | £65,913 | -9% |
29 Properties |
| 2011 | £72,170 | 15% |
28 Properties |
| 2010 | £61,068 | -21% |
22 Properties |
| 2009 | £73,976 | -7% |
23 Properties |
| 2008 | £79,401 | -1% |
34 Properties |
| 2007 | £79,941 | 4% |
68 Properties |
| 2006 | £76,634 | 11% |
65 Properties |
| 2005 | £68,344 | 19% |
60 Properties |
| 2004 | £55,688 | 31% |
81 Properties |
| 2003 | £38,244 | 25% |
91 Properties |
| 2002 | £28,723 | 2% |
62 Properties |
| 2001 | £28,184 | 6% |
59 Properties |
| 2000 | £26,430 | 11% |
28 Properties |
| 1999 | £23,424 | -14% |
27 Properties |
| 1998 | £26,755 | -1% |
26 Properties |
| 1997 | £26,893 | 10% |
24 Properties |
| 1996 | £24,108 | 14% |
27 Properties |
| 1995 | £20,769 | - |
30 Properties |
Property Price per Property Type in Nant-y-moel
Here you can find historic sold price data in order to help with your property search.
The average Property Paid Price for specific property types in the last three years are:
| Property Type | Average Sold Price | Sold Properties |
|---|---|---|
| Semi Detached House | £142,055.00 | 9 Semi Detached Houses |
| Detached House | £353,000.00 | 1 Detached House |
| Terraced House | £108,855.00 | 74 Terraced Houses |

