
Houses for sale & to rent in Glasbury, Builth Wells
House Prices in Glasbury
Properties in Glasbury have an average house price of £342k and had 10 Property Transactions within the last 3 years¹.
Glasbury is an area in Builth Wells, Powys - Powys with 213 households², where the most expensive property was sold for £630k.
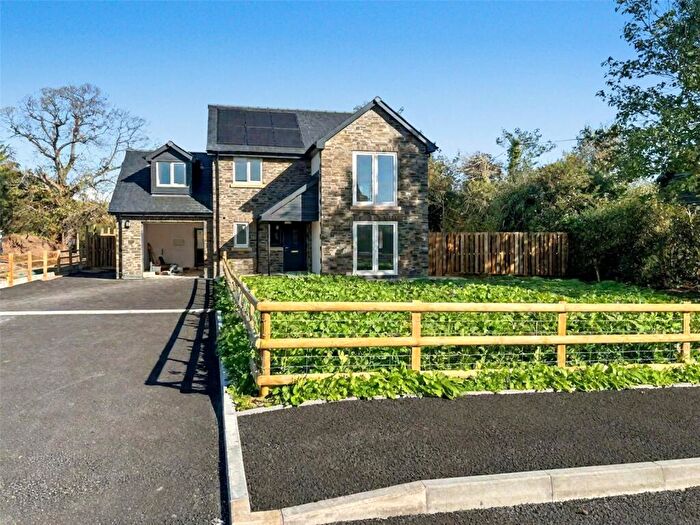
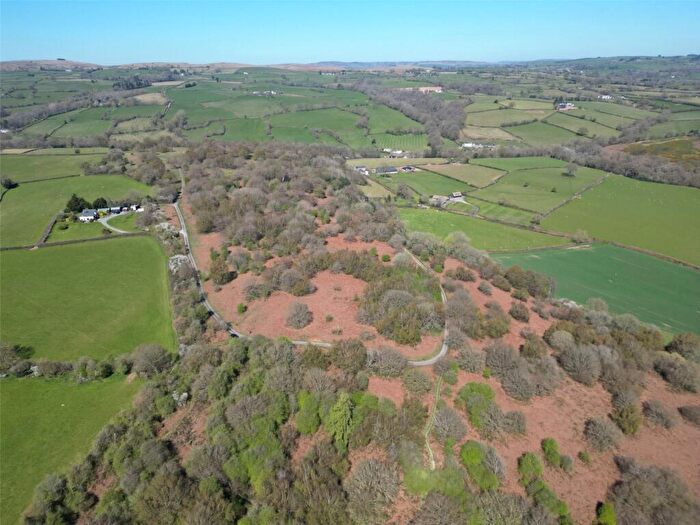
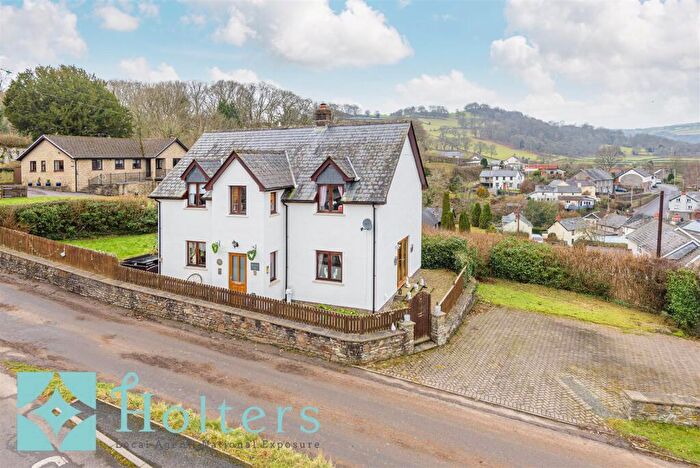
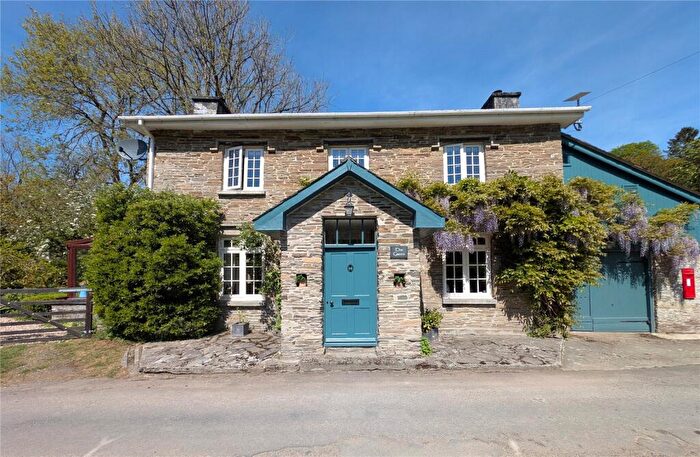
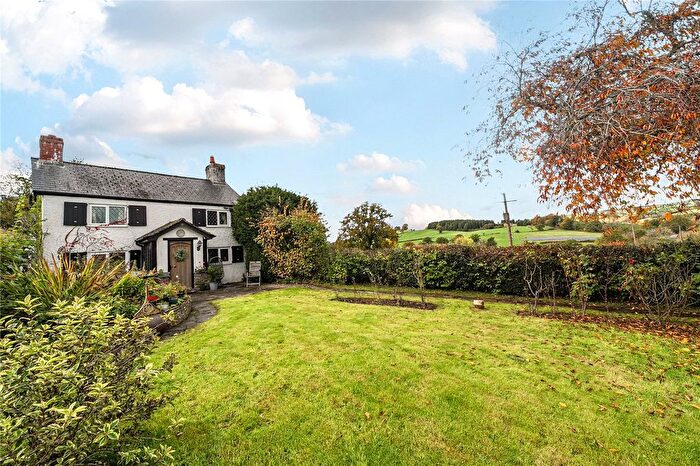
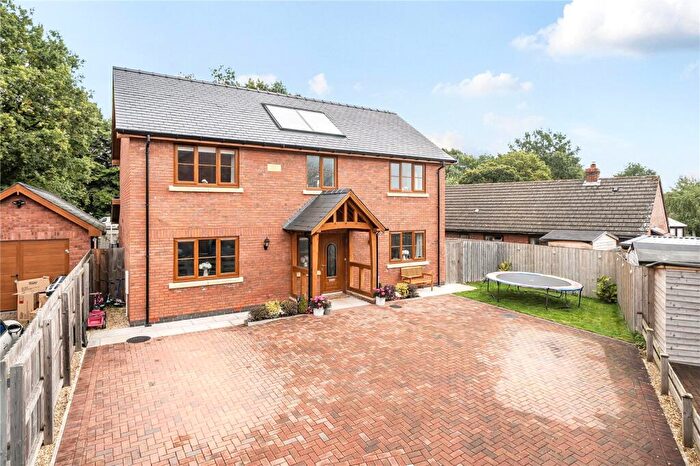
Properties for sale in Glasbury
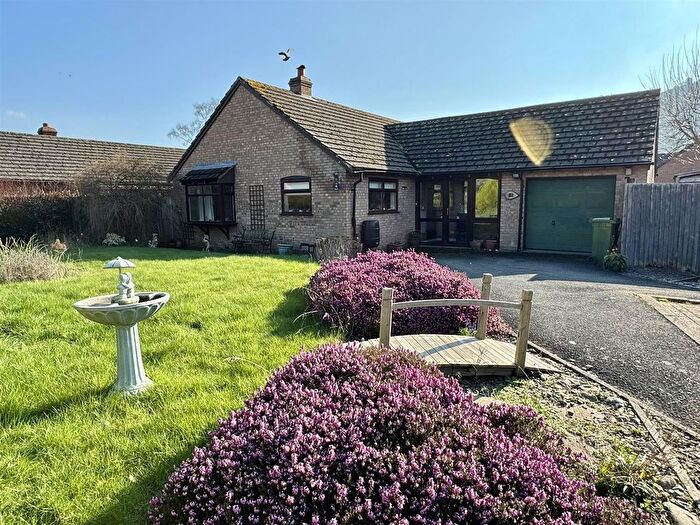


![]()
If you are looking to sell your house, let it out, or receive a property valuation, an expert can help you.
Click the button below to get started.
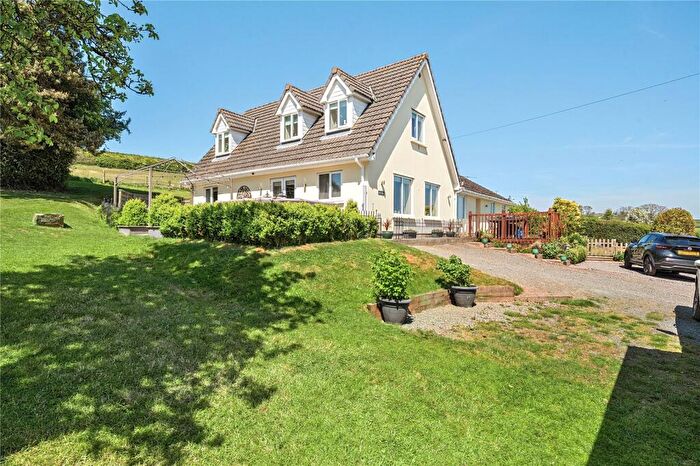
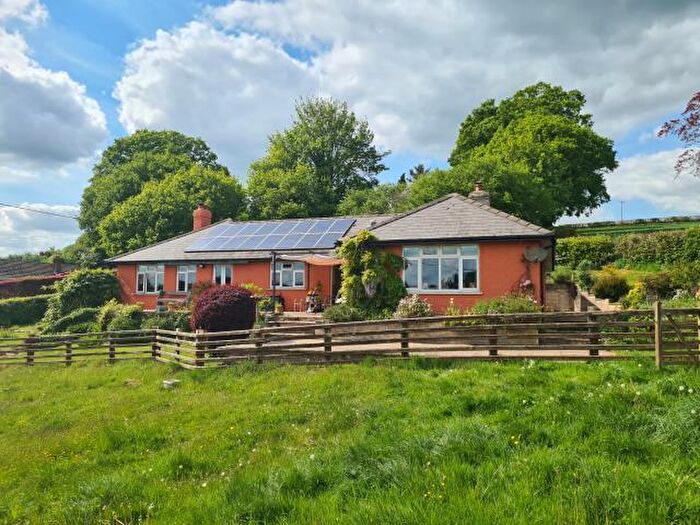
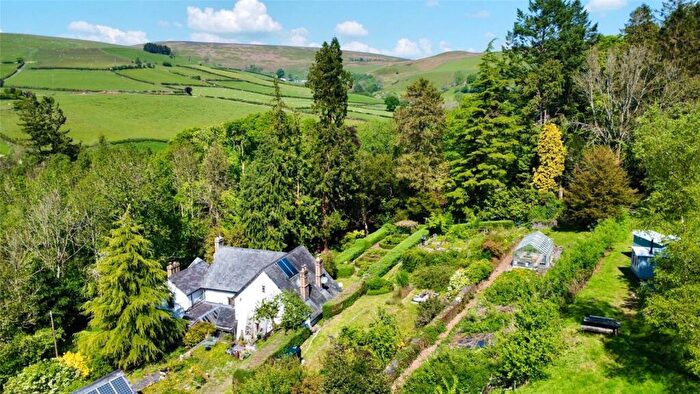
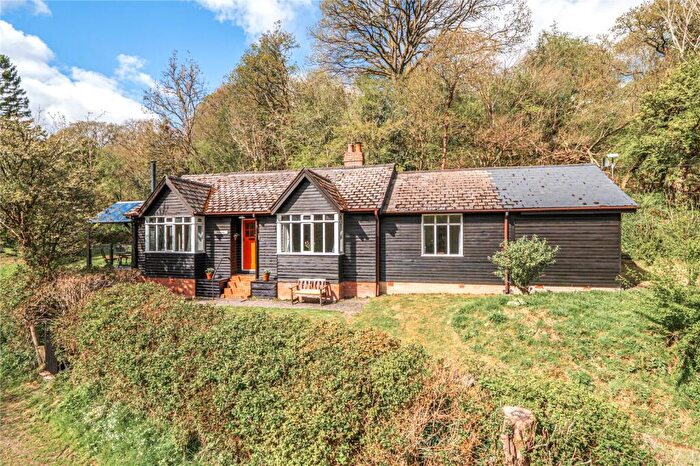
Previously listed properties in Glasbury
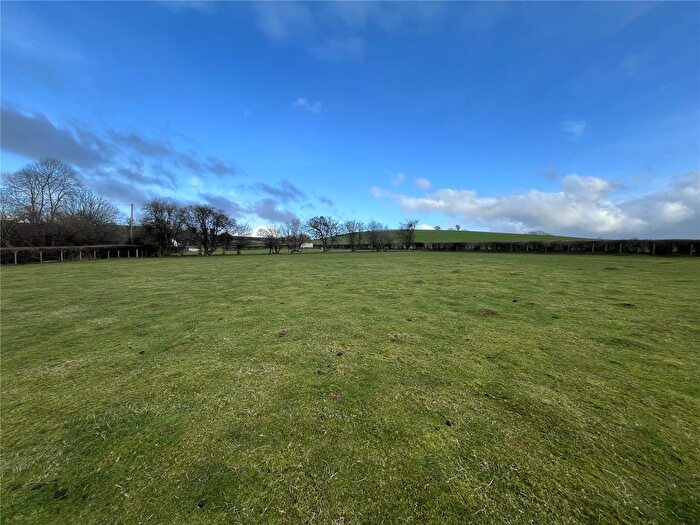
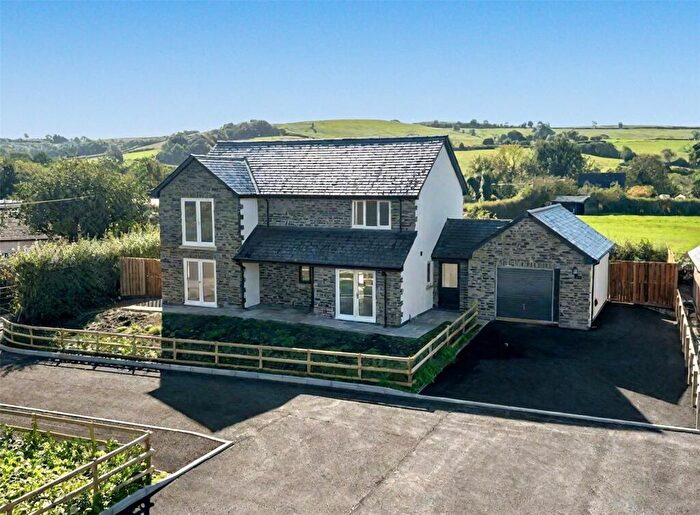
![]()
If you are looking to sell your house, let it out, or receive a property valuation, an expert can help you.
Click the button below to get started.

Roads and Postcodes in Glasbury
Navigate through our locations to find the location of your next house in Glasbury, Builth Wells for sale or to rent.
| Streets | Postcodes |
|---|---|
| Begwyns View | LD2 3JX |
| Castle Meadow | LD2 3JZ |
| Castlefield Close | LD2 3JD |
| Herman Villas | LD2 3JY |
| LD2 3JB LD2 3JF LD2 3JH LD2 3JL LD2 3JN LD2 3JP LD2 3JR LD2 3JU LD2 3JW LD2 3SJ LD2 3SX LD2 3UQ LD2 3YJ LD2 3YQ LD2 3YX LD2 3JE LD2 3JG LD2 3JJ LD2 3JQ LD2 3JS LD2 3JT LD2 3TZ LD2 3UJ LD2 3UX LD2 3UZ |
Transport near Glasbury
-
 Builth Road Station
 -
Cilmeri Station
-
Llandrindod Station
-
Garth (Powys) Station
-
Pen-Y-Bont Station
-
Llangammarch Station
-
Dolau Station
- FAQ
- Price Paid By Year
- Property Type Price
Frequently asked questions about Glasbury
What is the average price for a property for sale in Glasbury?
The average price for a property for sale in Glasbury is £342,350. This amount is 30% higher than the average price in Builth Wells. There are 125 property listings for sale in Glasbury.
What streets have the most expensive properties for sale in Glasbury?
The street with the most expensive properties for sale in Glasbury is Herman Villas at an average of £191,000.
What streets have the most affordable properties for sale in Glasbury?
The street with the most affordable properties for sale in Glasbury is Castle Meadow at an average of £187,500.
Which train stations are available in or near Glasbury?
Some of the train stations available in or near Glasbury are Builth Road, Cilmeri and Llandrindod.
Property Price Paid in Glasbury by Year
The average sold property price by year was:
| Year | Average Sold Price | Price Change |
Sold Properties
|
|---|---|---|---|
| 2025 | £260,250 | -14% |
4 Properties |
| 2024 | £297,500 | -100% |
4 Properties |
| 2023 | £596,250 | 23% |
2 Properties |
| 2022 | £461,318 | 33% |
11 Properties |
| 2021 | £308,750 | 40% |
4 Properties |
| 2020 | £186,737 | -46% |
4 Properties |
| 2019 | £271,812 | -32% |
8 Properties |
| 2018 | £360,000 | 29% |
2 Properties |
| 2017 | £254,583 | -54% |
6 Properties |
| 2016 | £390,833 | 33% |
3 Properties |
| 2015 | £261,250 | -56% |
4 Properties |
| 2014 | £406,875 | 37% |
4 Properties |
| 2013 | £256,237 | -14% |
4 Properties |
| 2012 | £292,166 | -95% |
6 Properties |
| 2011 | £570,000 | 49% |
1 Property |
| 2010 | £288,750 | 30% |
4 Properties |
| 2009 | £202,714 | -24% |
7 Properties |
| 2008 | £251,216 | 21% |
3 Properties |
| 2007 | £198,064 | -30% |
7 Properties |
| 2006 | £258,250 | 14% |
2 Properties |
| 2005 | £221,600 | 13% |
5 Properties |
| 2004 | £193,390 | 44% |
5 Properties |
| 2003 | £107,500 | -53% |
4 Properties |
| 2002 | £164,600 | -82% |
5 Properties |
| 2001 | £300,000 | 76% |
1 Property |
| 2000 | £73,166 | -18% |
3 Properties |
| 1999 | £86,666 | 13% |
6 Properties |
| 1998 | £75,000 | 20% |
1 Property |
| 1997 | £60,000 | -86% |
2 Properties |
| 1996 | £111,535 | 62% |
7 Properties |
| 1995 | £42,000 | - |
1 Property |
Property Price per Property Type in Glasbury
Here you can find historic sold price data in order to help with your property search.
The average Property Paid Price for specific property types in the last three years are:
| Property Type | Average Sold Price | Sold Properties |
|---|---|---|
| Semi Detached House | £175,000.00 | 1 Semi Detached House |
| Terraced House | £191,000.00 | 1 Terraced House |
| Detached House | £382,187.00 | 8 Detached Houses |