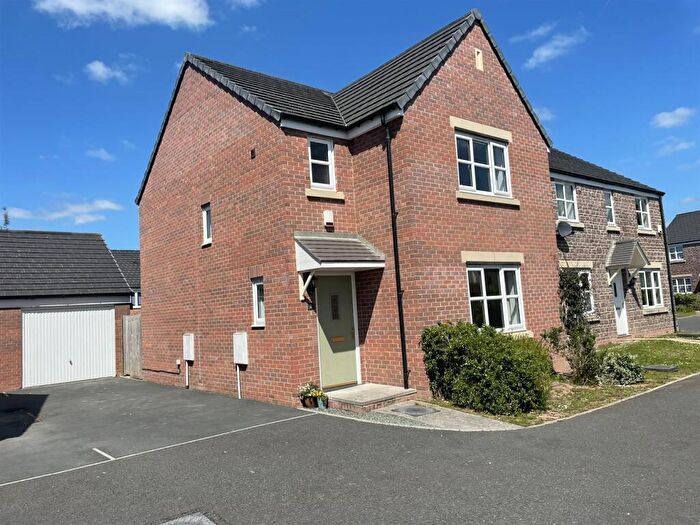
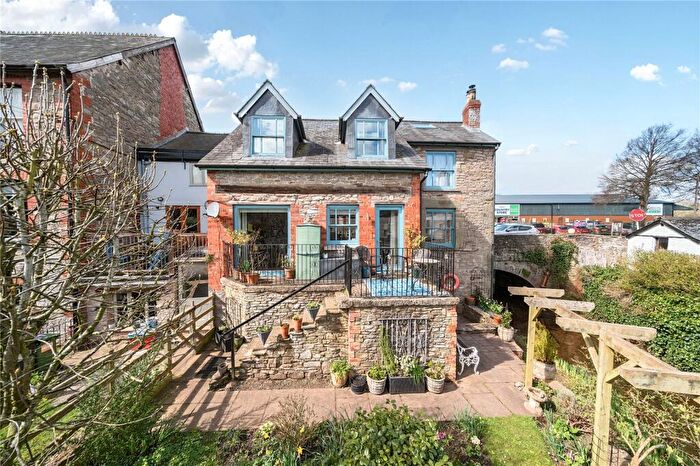
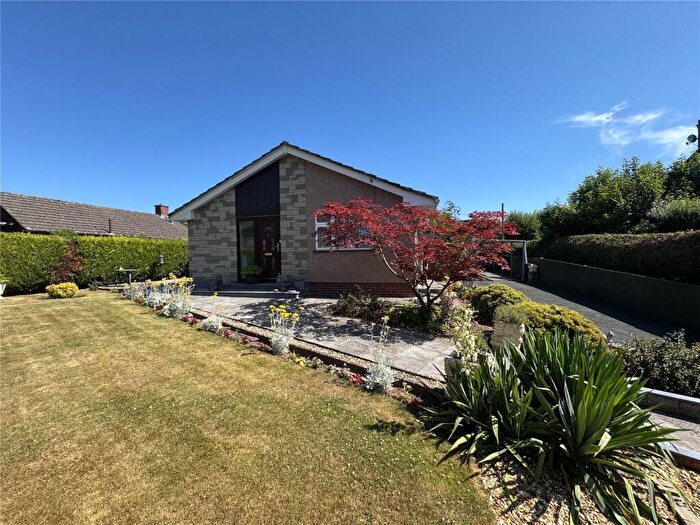
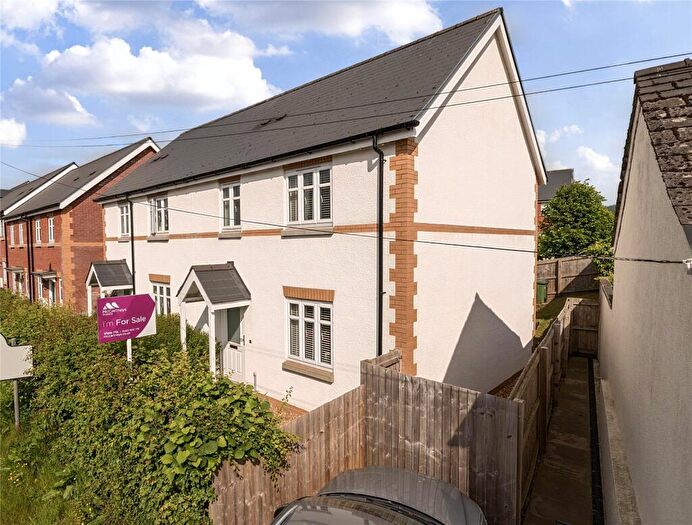
Houses for sale & to rent in Hay, Hereford
House Prices in Hay
Properties in Hay have an average house price of £314,070.00 and had 83 Property Transactions within the last 3 years¹.
Hay is an area in Hereford, Powys - Powys with 832 households², where the most expensive property was sold for £825,000.00.
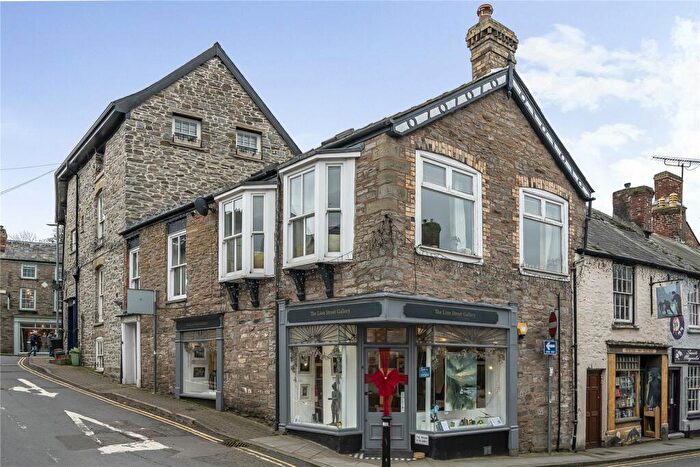
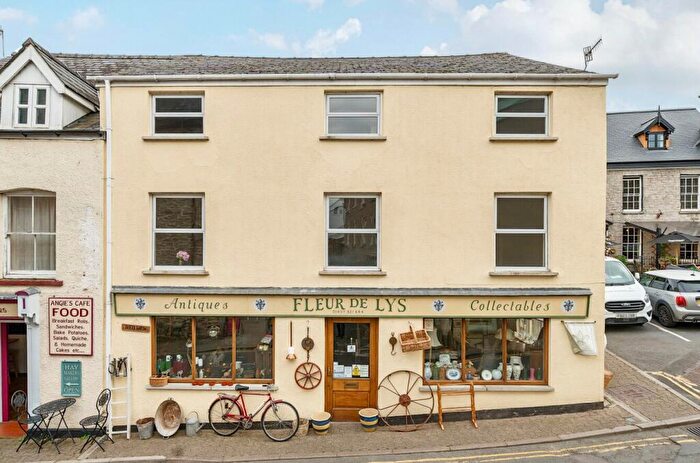
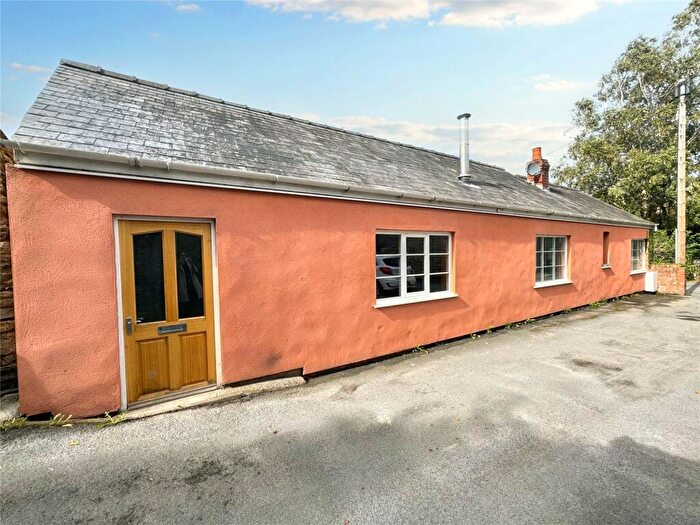
Properties for sale in Hay
Roads and Postcodes in Hay
Navigate through our locations to find the location of your next house in Hay, Hereford for sale or to rent.
| Streets | Postcodes |
|---|---|
| Albion Terrace | HR3 5AP |
| Back Fold | HR3 5EQ |
| Bear Street | HR3 5AN |
| Bell Bank | HR3 5AQ |
| Belmont Road | HR3 5DA |
| Birch Close | HR3 5TL HR3 5TN |
| Black Lion Green | HR3 5AR |
| Booth Gardens | HR3 5BH |
| Brecon Road | HR3 5DY HR3 5PJ HR3 5DN HR3 5DZ |
| Bridge Street | HR3 5DE |
| Broad Street | HR3 5DB HR3 5BX HR3 5DD |
| Brook Street | HR3 5BQ |
| Bull Ring | HR3 5AG |
| Carlesgate | HR3 5BS |
| Castle Lane | HR3 5FD |
| Castle Street | HR3 5DF |
| Chancery Court | HR3 5BP |
| Chancery Lane | HR3 5BL HR3 5DJ |
| Church Street | HR3 5DQ |
| Church Terrace | HR3 5EE |
| Clos Pwll Llestri | HR3 5EJ |
| De Breos Court | HR3 5DL |
| Forest Road | HR3 5DS HR3 5DT HR3 5DX HR3 5EH HR3 5FA |
| Garribaldi Terrace | HR3 5AW |
| Gipsy Castle Estate | HR3 5EG |
| Heol Y Dwr | HR3 5AT HR3 5AY HR3 5AZ |
| High Town | HR3 5AE HR3 5ZZ |
| Kemish Place | HR3 5BY |
| Lion Street | HR3 5AA HR3 5AB HR3 5AD |
| Market Street | HR3 5AF |
| Mill Bank | HR3 5DH |
| Newport Street | HR3 5BG |
| Oakland Villas | HR3 5PH |
| Oxford Road | HR3 5AJ HR3 5BT HR3 5DG |
| Oxford Terrace | HR3 5AH |
| Oxford Villas | HR3 5BW |
| Police Houses | HR3 5AS |
| Smallbrook Terrace | HR3 5AX |
| St Johns Place | HR3 5BN |
| St Marys Road | HR3 5EA HR3 5EF |
| St Marys Villas | HR3 5ED |
| Station Terrace | HR3 5BA |
| Swan Bank | HR3 5DW |
| Swan Villas | HR3 5DP |
| The Caepound | HR3 5DU |
| The Gardens | HR3 5AU |
| The Meadows | HR3 5LF |
| The Pavement | HR3 5BU |
| Union Mews | HR3 5EB |
| Warren Close | HR3 5EL |
| Wye Valley Business Park | HR3 5PG |
| Wyeford Road | HR3 5BJ |
| Wyeside Gardens | HR3 5QR HR3 5QS |
| HR3 5DR HR3 5PW |
Transport near Hay
-
Builth Road Station
-
Cilmeri Station
-
Llandrindod Station
-
Pen-Y-Bont Station
-
Dolau Station
-
Garth (Powys) Station
-
Hereford Station
-
Llangammarch Station
-
Abergavenny Station
-
Llanbister Road Station
- FAQ
- Price Paid By Year
- Property Type Price
Frequently asked questions about Hay
What is the average price for a property for sale in Hay?
The average price for a property for sale in Hay is £314,070. This amount is 14% lower than the average price in Hereford. There are 221 property listings for sale in Hay.
What streets have the most expensive properties for sale in Hay?
The streets with the most expensive properties for sale in Hay are Church Street at an average of £646,666, Forest Road at an average of £512,500 and Broad Street at an average of £507,025.
What streets have the most affordable properties for sale in Hay?
The streets with the most affordable properties for sale in Hay are High Town at an average of £170,000, Lion Street at an average of £179,000 and Market Street at an average of £205,000.
Which train stations are available in or near Hay?
Some of the train stations available in or near Hay are Builth Road, Cilmeri and Llandrindod.
Property Price Paid in Hay by Year
The average sold property price by year was:
| Year | Average Sold Price | Price Change |
Sold Properties
|
|---|---|---|---|
| 2025 | £307,238 | 1% |
22 Properties |
| 2024 | £304,509 | -9% |
33 Properties |
| 2023 | £330,708 | 4% |
28 Properties |
| 2022 | £317,275 | 6% |
32 Properties |
| 2021 | £299,262 | 27% |
51 Properties |
| 2020 | £217,631 | -6% |
27 Properties |
| 2019 | £229,937 | -5% |
41 Properties |
| 2018 | £241,332 | -3% |
72 Properties |
| 2017 | £249,288 | 4% |
38 Properties |
| 2016 | £238,104 | 7% |
24 Properties |
| 2015 | £221,722 | -4% |
29 Properties |
| 2014 | £229,831 | 6% |
30 Properties |
| 2013 | £215,975 | -20% |
22 Properties |
| 2012 | £259,441 | 20% |
18 Properties |
| 2011 | £207,141 | -22% |
29 Properties |
| 2010 | £253,611 | 22% |
36 Properties |
| 2009 | £196,736 | -4% |
41 Properties |
| 2008 | £205,193 | -18% |
15 Properties |
| 2007 | £241,788 | 22% |
34 Properties |
| 2006 | £188,271 | 6% |
37 Properties |
| 2005 | £176,858 | -6% |
42 Properties |
| 2004 | £188,319 | 11% |
43 Properties |
| 2003 | £167,151 | 19% |
47 Properties |
| 2002 | £135,350 | 27% |
47 Properties |
| 2001 | £99,247 | 12% |
37 Properties |
| 2000 | £87,556 | 11% |
25 Properties |
| 1999 | £78,208 | 6% |
29 Properties |
| 1998 | £73,850 | 26% |
42 Properties |
| 1997 | £54,707 | 6% |
39 Properties |
| 1996 | £51,571 | -29% |
21 Properties |
| 1995 | £66,679 | - |
22 Properties |
Property Price per Property Type in Hay
Here you can find historic sold price data in order to help with your property search.
The average Property Paid Price for specific property types in the last three years are:
| Property Type | Average Sold Price | Sold Properties |
|---|---|---|
| Semi Detached House | £271,117.00 | 14 Semi Detached Houses |
| Detached House | £417,343.00 | 20 Detached Houses |
| Terraced House | £315,468.00 | 37 Terraced Houses |
| Flat | £187,750.00 | 12 Flats |

