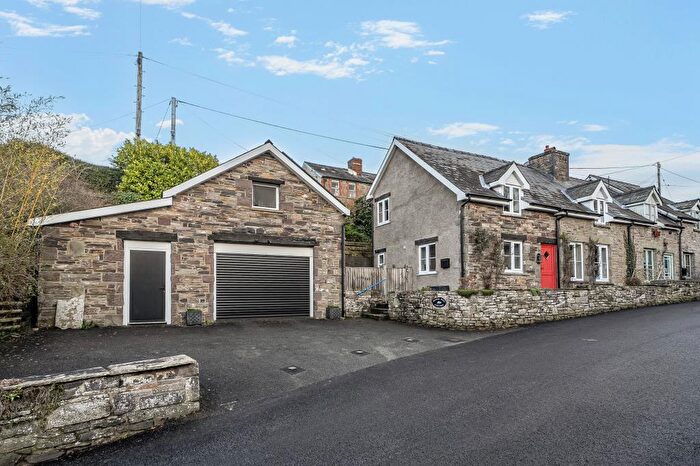
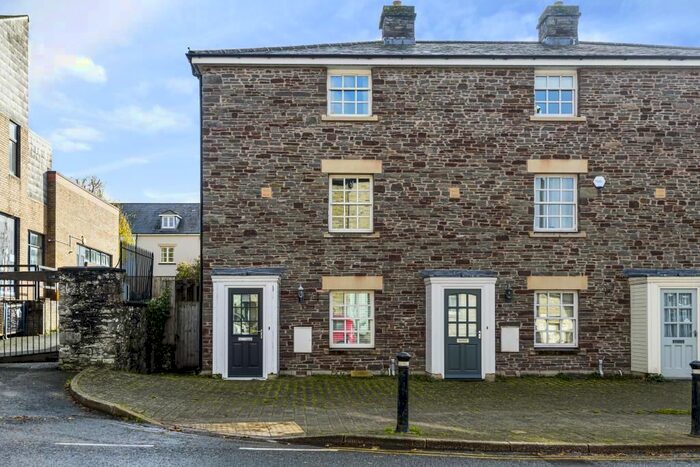
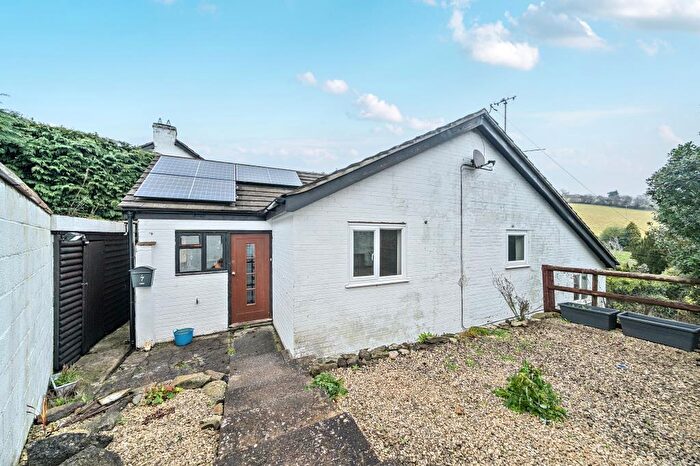
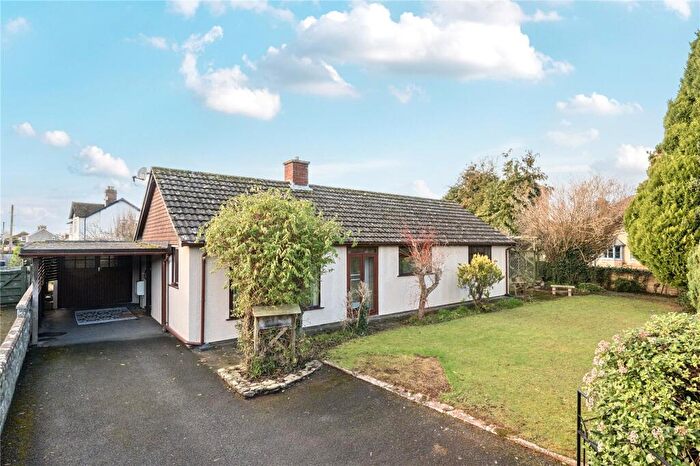
Houses for sale & to rent in Glasbury, Hereford
House Prices in Glasbury
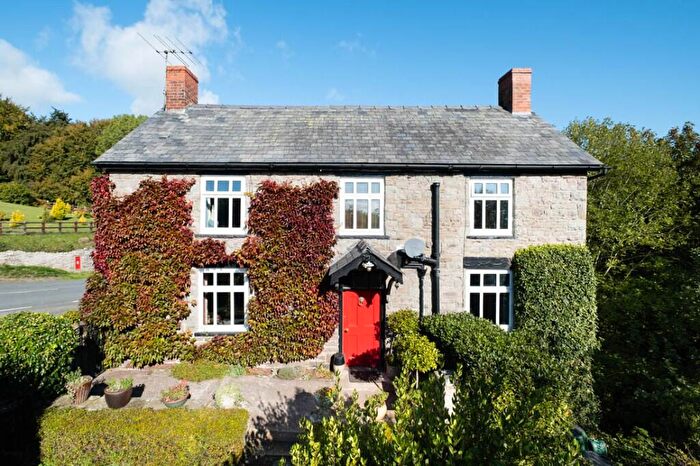
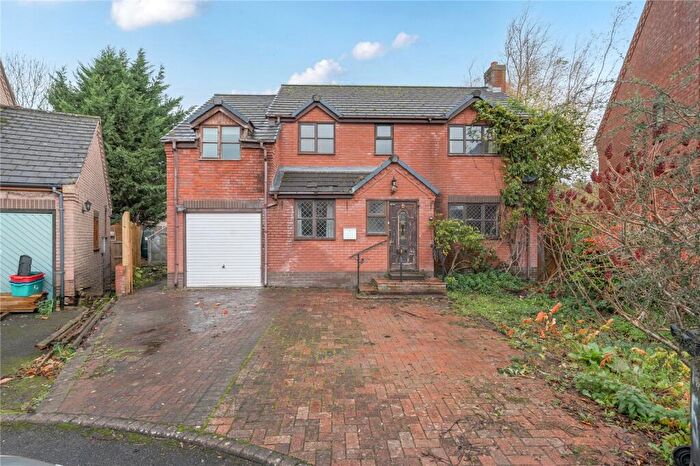
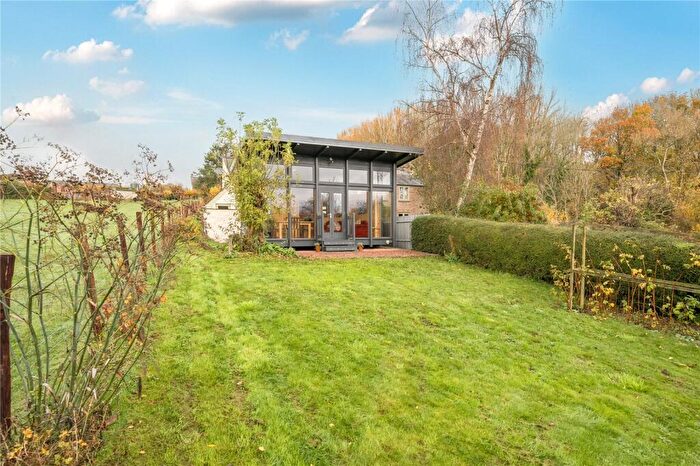
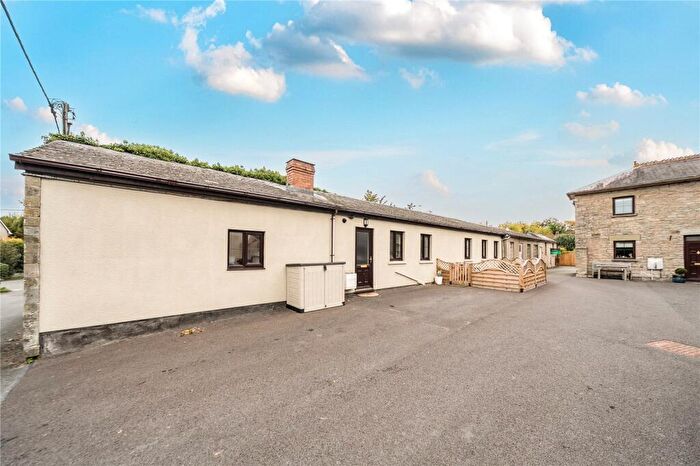
Properties in Glasbury have an average house price of £457,593.00 and had 32 Property Transactions within the last 3 years¹.
Glasbury is an area in Hereford, Powys - Powys with 583 households², where the most expensive property was sold for £980,000.00.
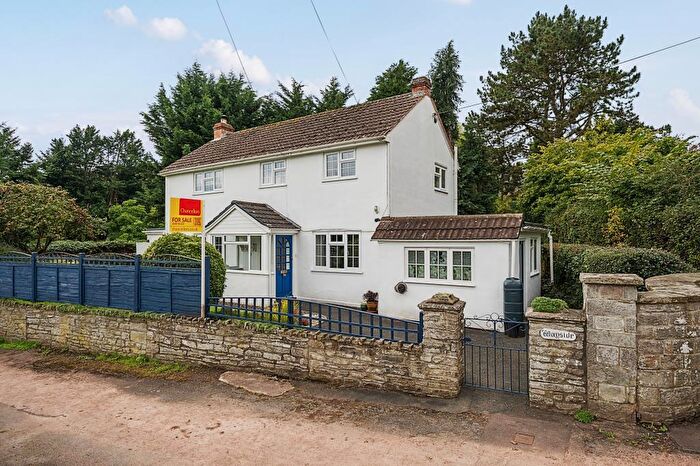
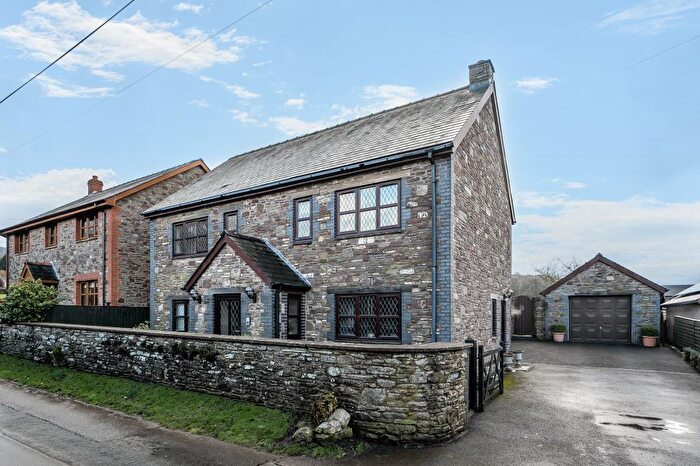
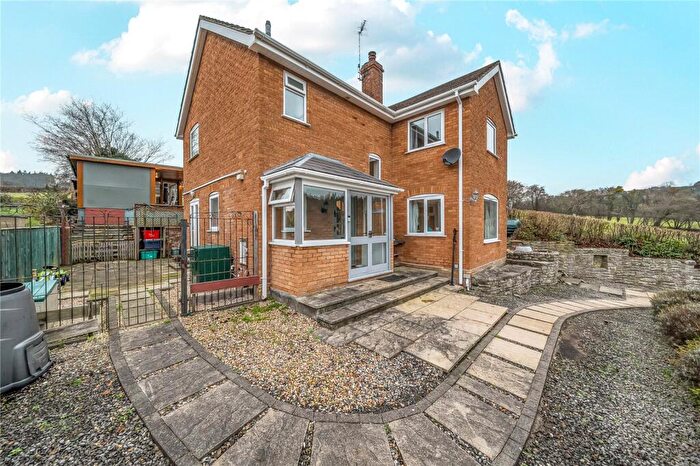
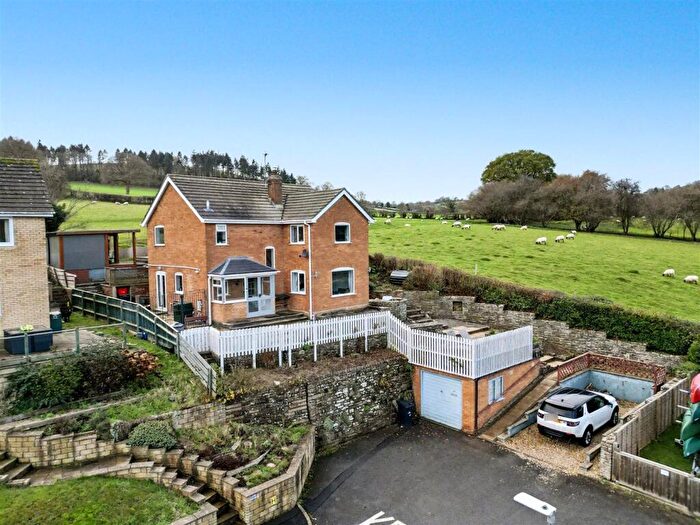
Properties for sale in Glasbury
Roads and Postcodes in Glasbury
Navigate through our locations to find the location of your next house in Glasbury, Hereford for sale or to rent.
| Streets | Postcodes |
|---|---|
| Baskerville Court | HR3 5SS |
| Begwyns Bluff | HR3 5SR |
| Brilley | HR3 6HA HR3 6HN |
| Brookside | HR3 5NF |
| Buttercup Meadow | HR3 5JZ |
| Castle Estate | HR3 5SP |
| Castle View | HR3 5SZ |
| Edwards Court | HR3 5FB |
| Glasbury Court | HR3 5LP |
| Green Terrace | HR3 5LJ |
| Hampton Gardens | HR3 5TH |
| Kilverts View | HR3 5NQ |
| Little Mill Cottages | HR3 5LG |
| Maesllwch Terrace | HR3 5LH |
| Mill Cottages | HR3 5JD |
| Rhydspence | HR3 6EY |
| Rose Cottages | HR3 5LW |
| St Meilogs Close | HR3 5JB |
| The Birches | HR3 5NW |
| The Orchard | HR3 5RR |
| The Village | HR3 5SA HR3 5SF |
| HR3 5JA HR3 5JG HR3 5JR HR3 5JS HR3 5JT HR3 5JW HR3 5LB HR3 5LD HR3 5LE HR3 5LL HR3 5LN HR3 5LR HR3 5LS HR3 5LT HR3 5LU HR3 5LX HR3 5LZ HR3 5NA HR3 5NB HR3 5ND HR3 5NJ HR3 5NN HR3 5NZ HR3 5RS HR3 5RX HR3 5RY HR3 5RZ HR3 5SB HR3 5SD HR3 5SE HR3 5SG HR3 5SL HR3 5SN HR3 5SW HR3 6JU HR3 6JX HR3 6JY HR3 5JE HR3 5JF HR3 5JH HR3 5JJ HR3 5JL HR3 5JP HR3 5JU HR3 5JX HR3 5LA HR3 5LQ HR3 5LY HR3 5NE HR3 5NG HR3 5NL HR3 5PA HR3 5PB HR3 5RT HR3 5RU HR3 5SH HR3 5SJ HR3 5SQ HR3 5TR HR3 6EX HR3 5HZ HR3 5TP |
Transport near Glasbury
- FAQ
- Price Paid By Year
- Property Type Price
Frequently asked questions about Glasbury
What is the average price for a property for sale in Glasbury?
The average price for a property for sale in Glasbury is £457,593. This amount is 25% higher than the average price in Hereford. There are 500 property listings for sale in Glasbury.
What streets have the most expensive properties for sale in Glasbury?
The streets with the most expensive properties for sale in Glasbury are Brookside at an average of £395,000, Buttercup Meadow at an average of £360,000 and The Village at an average of £318,333.
What streets have the most affordable properties for sale in Glasbury?
The streets with the most affordable properties for sale in Glasbury are Castle Estate at an average of £171,000, Little Mill Cottages at an average of £220,000 and Kilverts View at an average of £225,000.
Which train stations are available in or near Glasbury?
Some of the train stations available in or near Glasbury are Builth Road, Cilmeri and Llandrindod.
Property Price Paid in Glasbury by Year
The average sold property price by year was:
| Year | Average Sold Price | Price Change |
Sold Properties
|
|---|---|---|---|
| 2025 | £369,300 | -45% |
10 Properties |
| 2024 | £536,833 | 16% |
12 Properties |
| 2023 | £450,800 | 10% |
10 Properties |
| 2022 | £403,738 | -1% |
13 Properties |
| 2021 | £408,875 | 27% |
20 Properties |
| 2020 | £298,746 | -1% |
14 Properties |
| 2019 | £300,975 | -1% |
20 Properties |
| 2018 | £302,978 | 12% |
23 Properties |
| 2017 | £266,181 | 5% |
22 Properties |
| 2016 | £253,660 | -22% |
19 Properties |
| 2015 | £308,318 | 10% |
11 Properties |
| 2014 | £277,359 | 10% |
23 Properties |
| 2013 | £250,450 | -16% |
10 Properties |
| 2012 | £290,000 | 6% |
8 Properties |
| 2011 | £271,681 | 3% |
11 Properties |
| 2010 | £262,802 | -29% |
19 Properties |
| 2009 | £339,730 | 10% |
10 Properties |
| 2008 | £305,800 | -1% |
5 Properties |
| 2007 | £308,149 | 22% |
16 Properties |
| 2006 | £241,719 | 6% |
18 Properties |
| 2005 | £228,275 | 8% |
23 Properties |
| 2004 | £210,089 | 5% |
43 Properties |
| 2003 | £199,771 | 18% |
27 Properties |
| 2002 | £164,433 | 19% |
12 Properties |
| 2001 | £132,950 | 24% |
21 Properties |
| 2000 | £101,194 | -2% |
18 Properties |
| 1999 | £103,522 | 8% |
20 Properties |
| 1998 | £95,681 | 3% |
8 Properties |
| 1997 | £92,796 | 4% |
16 Properties |
| 1996 | £89,285 | 30% |
7 Properties |
| 1995 | £62,500 | - |
7 Properties |
Property Price per Property Type in Glasbury
Here you can find historic sold price data in order to help with your property search.
The average Property Paid Price for specific property types in the last three years are:
| Property Type | Average Sold Price | Sold Properties |
|---|---|---|
| Semi Detached House | £291,666.00 | 3 Semi Detached Houses |
| Detached House | £526,833.00 | 24 Detached Houses |
| Terraced House | £224,800.00 | 5 Terraced Houses |

