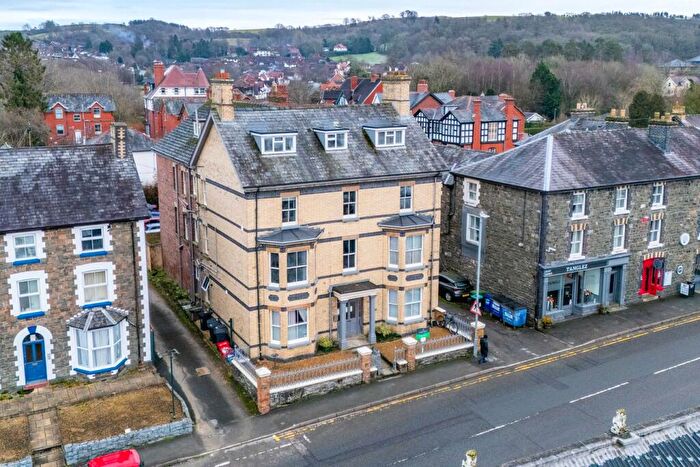
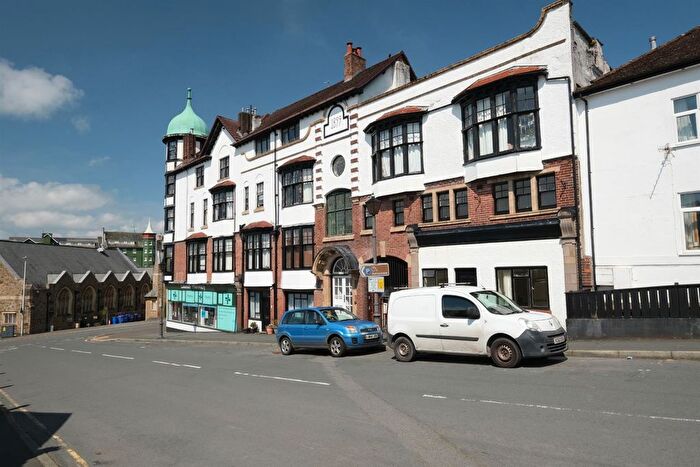
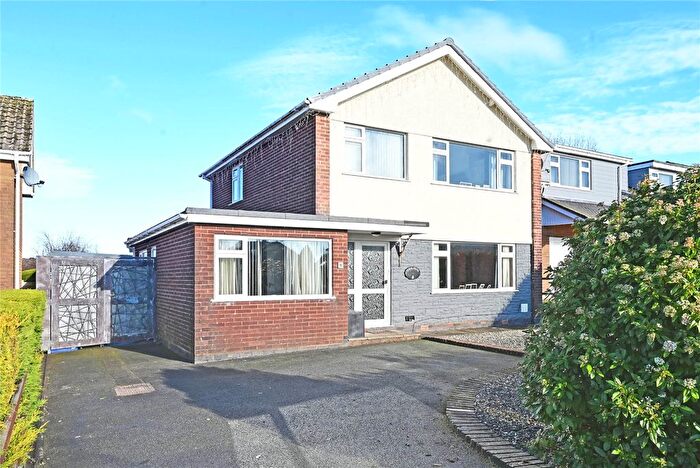
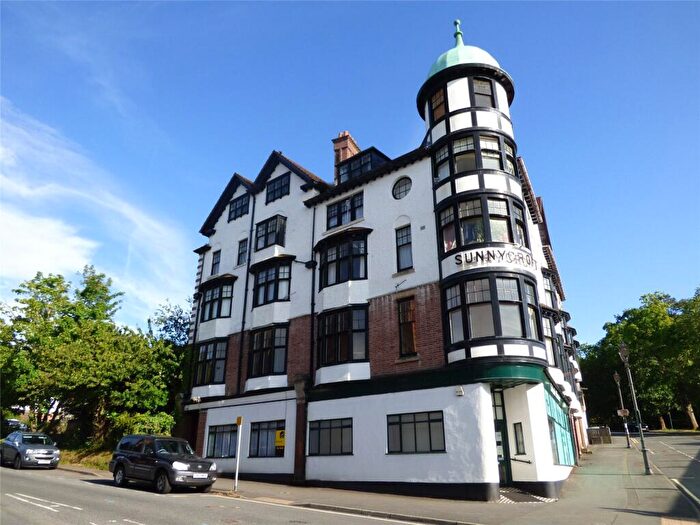
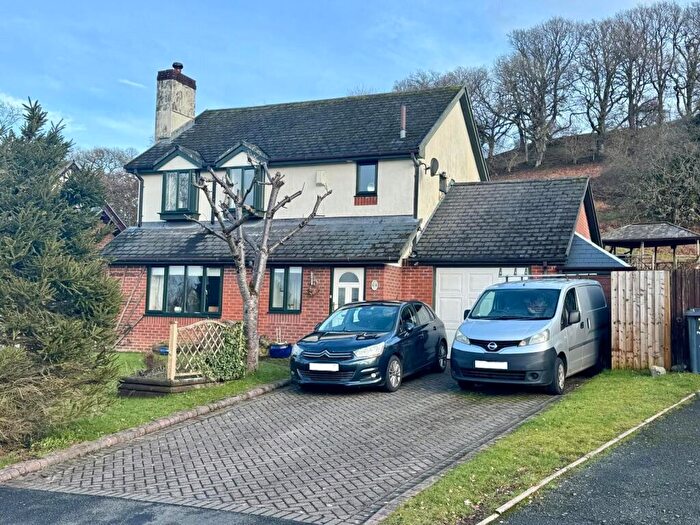
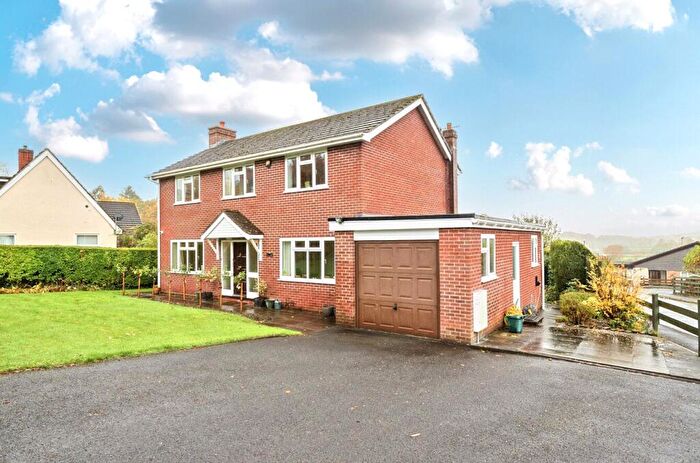
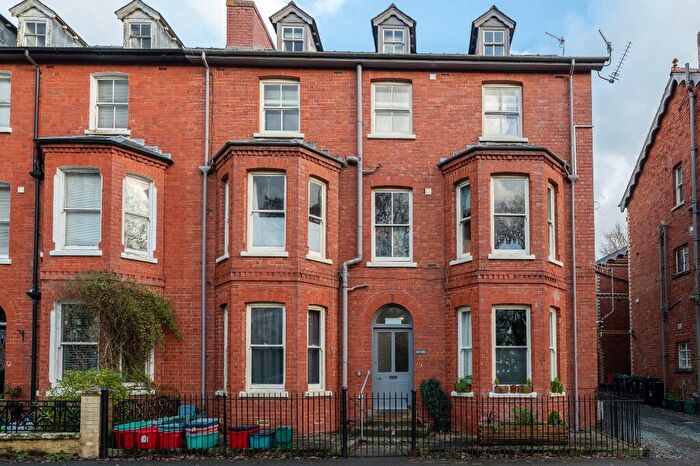
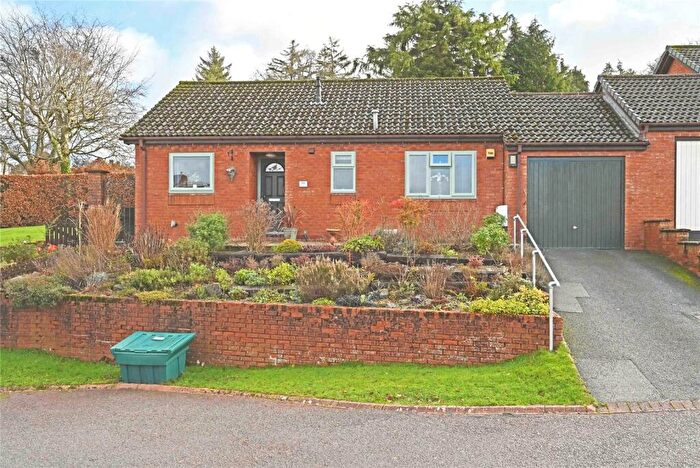
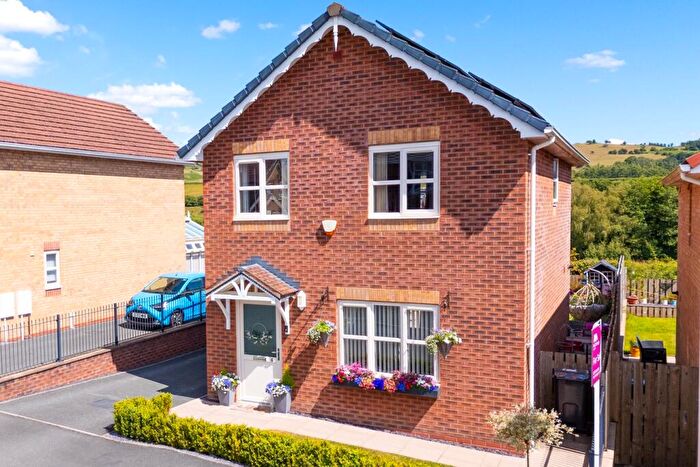
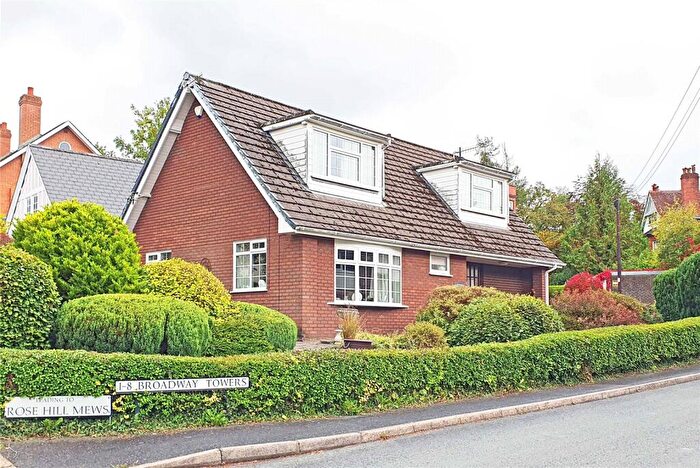
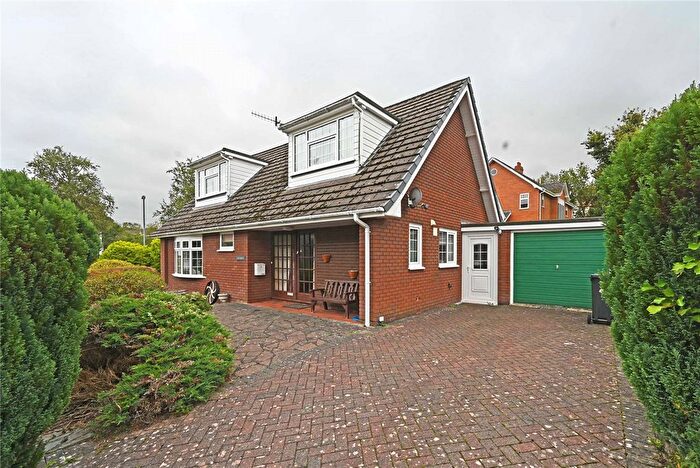
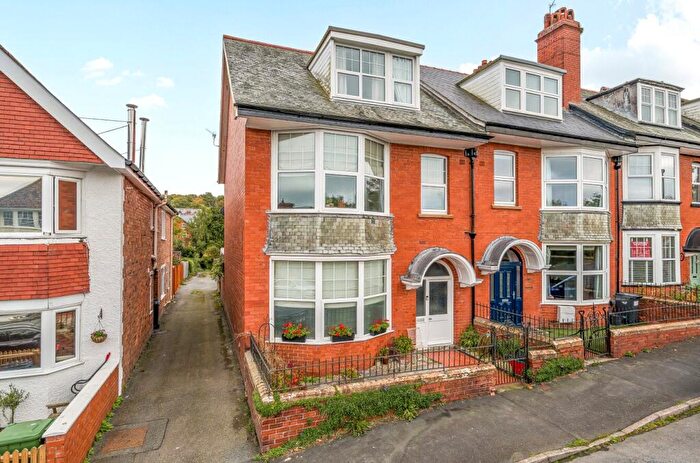
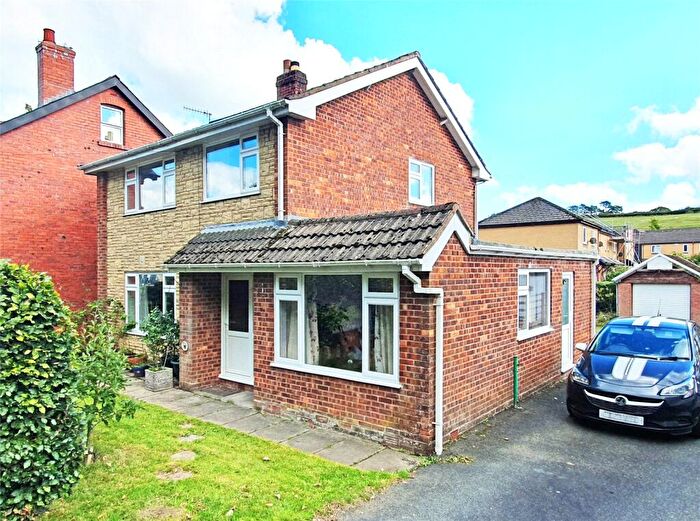
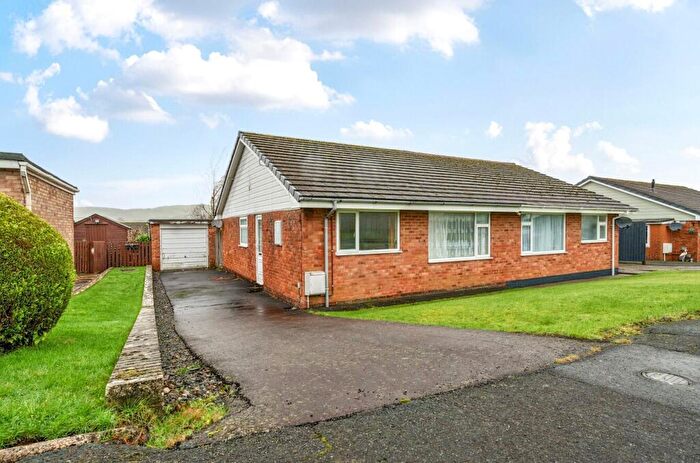
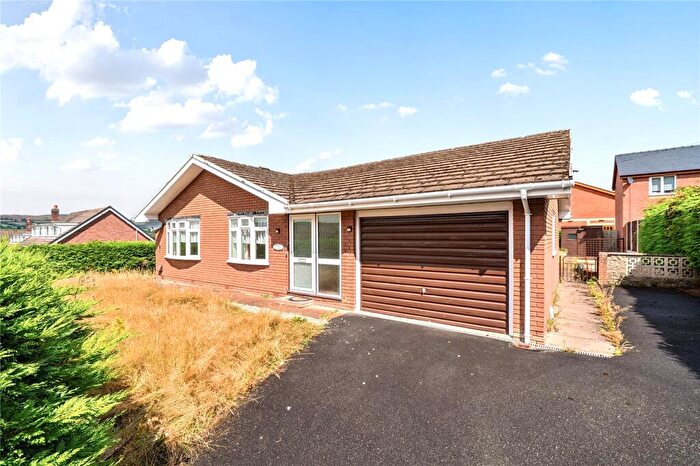
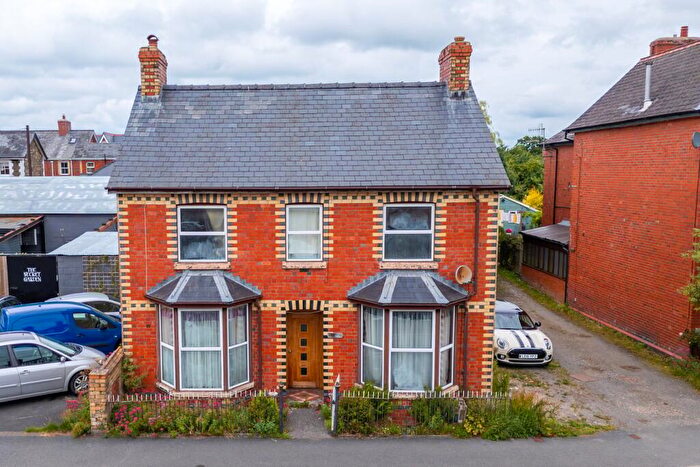
Houses for sale & to rent in Llandrindod South, Llandrindod Wells
House Prices in Llandrindod South
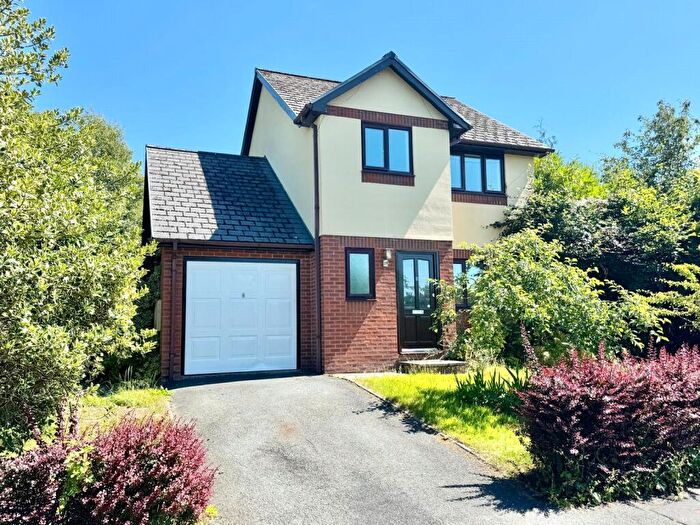
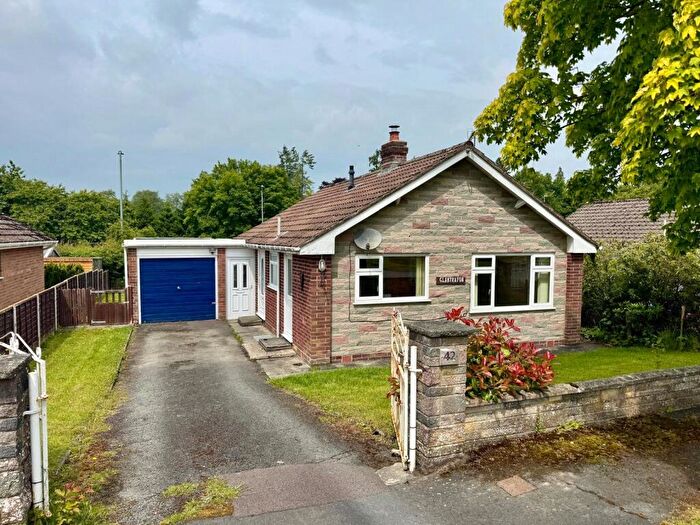
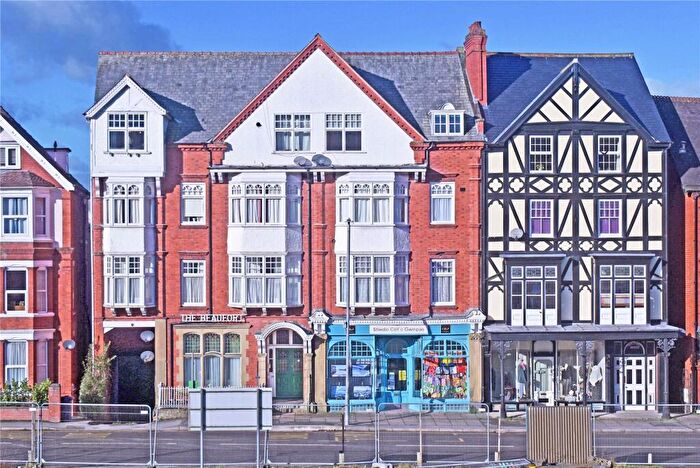
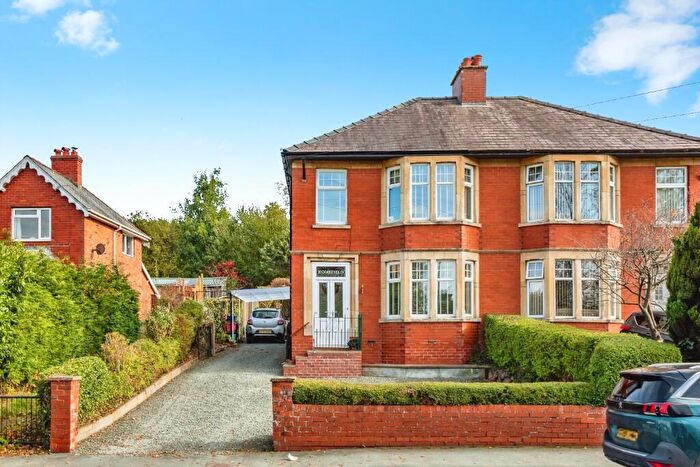
Properties in Llandrindod South have an average house price of £206,649.00 and had 115 Property Transactions within the last 3 years¹.
Llandrindod South is an area in Llandrindod Wells, Powys - Powys with 1,005 households², where the most expensive property was sold for £840,000.00.
Properties for sale in Llandrindod South
Roads and Postcodes in Llandrindod South
Navigate through our locations to find the location of your next house in Llandrindod South, Llandrindod Wells for sale or to rent.
| Streets | Postcodes |
|---|---|
| Alexandra Court | LD1 5NR |
| Alexandra Road | LD1 5LS LD1 5LT |
| Alexandra Terrace | LD1 5LQ |
| Ashridge Close | LD1 5NS |
| Broadway | LD1 5HT |
| Brookfields | LD1 5LF |
| Brynteg | LD1 5HB |
| Builth Wells | LD1 9BU LD1 9BZ |
| Cedar Ridge | LD1 5EX |
| Cefn Morfa | LD1 5NP |
| Cefnllys Lane | LD1 5LD LD1 5LE LD1 5LJ LD1 5WA |
| Denham Terrace | LD1 5NH |
| Dolydd Pentrosfa | LD1 5NZ |
| Gorse Farm Estate | LD1 5SH |
| Grosvenor Close | LD1 5NE |
| Grosvenor Road | LD1 5NA |
| Lakeside Avenue | LD1 5NT |
| Llandrindod Wells | LD1 9BW LD1 9DA |
| Maelog Court | LD1 5AE |
| Maple Ridge Close | LD1 5NX |
| Montpellier Park | LD1 5LL LD1 5LN LD1 5LW |
| Oakridge Drive | LD1 5EW |
| Park Lane | LD1 5NN |
| Pentrosfa | LD1 5AL |
| Pentrosfa Crescent | LD1 5NW |
| Pentrosfa Road | LD1 5NL |
| Princes Avenue | LD1 5HU |
| Ridgebourne Close | LD1 5NQ |
| Ridgebourne Drive | LD1 5TS |
| Rock Park | LD1 6AE |
| Spa Road East | LD1 5ES LD1 5HA |
| Temple Avenue | LD1 5LP LD1 5LR |
| Temple Avenue East | LD1 5HP |
| Temple Drive | LD1 5LU |
| Temple Street | LD1 5HG LD1 5HW |
| Wellington Road | LD1 5NB LD1 5ND LD1 5NF |
| Wellington Terrace | LD1 5NG |
| Western Promenade | LD1 5HR LD1 5LY |
| Woodlands | LD1 5DE |
| LD1 5NY LD1 5PD LD1 5LG LD1 5NU LD1 5ZG LD1 9SA LD1 9SB LD1 9XF LD1 9ZX LD1 9ZY LD1 9ZZ LD1 5LX |
Transport near Llandrindod South
-
Llandrindod Station
-
Pen-Y-Bont Station
-
Builth Road Station
-
Dolau Station
-
Cilmeri Station
-
Garth (Powys) Station
-
Llanbister Road Station
- FAQ
- Price Paid By Year
- Property Type Price
Frequently asked questions about Llandrindod South
What is the average price for a property for sale in Llandrindod South?
The average price for a property for sale in Llandrindod South is £206,649. This amount is 10% lower than the average price in Llandrindod Wells. There are 563 property listings for sale in Llandrindod South.
What streets have the most expensive properties for sale in Llandrindod South?
The streets with the most expensive properties for sale in Llandrindod South are Brookfields at an average of £345,000, Cefn Morfa at an average of £307,650 and Grosvenor Road at an average of £292,166.
What streets have the most affordable properties for sale in Llandrindod South?
The streets with the most affordable properties for sale in Llandrindod South are Temple Street at an average of £75,678, Spa Road East at an average of £76,188 and Princes Avenue at an average of £95,516.
Which train stations are available in or near Llandrindod South?
Some of the train stations available in or near Llandrindod South are Llandrindod, Pen-Y-Bont and Builth Road.
Property Price Paid in Llandrindod South by Year
The average sold property price by year was:
| Year | Average Sold Price | Price Change |
Sold Properties
|
|---|---|---|---|
| 2025 | £226,196 | 5% |
34 Properties |
| 2024 | £214,948 | 15% |
39 Properties |
| 2023 | £183,119 | -21% |
42 Properties |
| 2022 | £221,074 | 1% |
54 Properties |
| 2021 | £219,962 | 21% |
62 Properties |
| 2020 | £174,352 | 3% |
34 Properties |
| 2019 | £169,499 | 5% |
58 Properties |
| 2018 | £160,651 | -10% |
75 Properties |
| 2017 | £176,094 | 1% |
63 Properties |
| 2016 | £174,497 | 12% |
35 Properties |
| 2015 | £153,465 | 21% |
50 Properties |
| 2014 | £120,540 | -9% |
35 Properties |
| 2013 | £131,307 | -20% |
23 Properties |
| 2012 | £157,891 | 8% |
23 Properties |
| 2011 | £144,950 | -22% |
30 Properties |
| 2010 | £176,964 | 13% |
17 Properties |
| 2009 | £154,766 | 5% |
15 Properties |
| 2008 | £146,980 | -12% |
28 Properties |
| 2007 | £164,277 | 4% |
59 Properties |
| 2006 | £158,040 | 19% |
40 Properties |
| 2005 | £128,316 | -5% |
40 Properties |
| 2004 | £134,482 | 9% |
42 Properties |
| 2003 | £122,064 | 27% |
54 Properties |
| 2002 | £88,634 | 19% |
61 Properties |
| 2001 | £71,664 | -10% |
57 Properties |
| 2000 | £78,478 | 7% |
40 Properties |
| 1999 | £72,948 | 8% |
60 Properties |
| 1998 | £66,943 | 12% |
49 Properties |
| 1997 | £59,004 | 8% |
40 Properties |
| 1996 | £54,014 | -4% |
44 Properties |
| 1995 | £56,301 | - |
29 Properties |
Property Price per Property Type in Llandrindod South
Here you can find historic sold price data in order to help with your property search.
The average Property Paid Price for specific property types in the last three years are:
| Property Type | Average Sold Price | Sold Properties |
|---|---|---|
| Semi Detached House | £211,854.00 | 24 Semi Detached Houses |
| Detached House | £303,131.00 | 46 Detached Houses |
| Terraced House | £159,409.00 | 11 Terraced Houses |
| Flat | £87,723.00 | 34 Flats |

