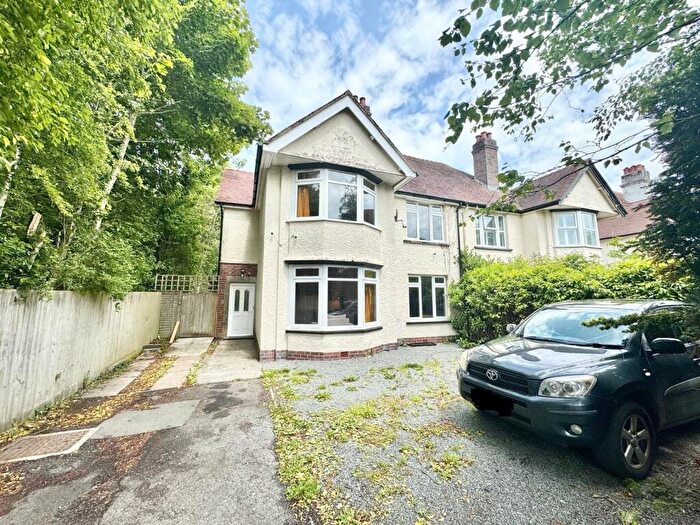
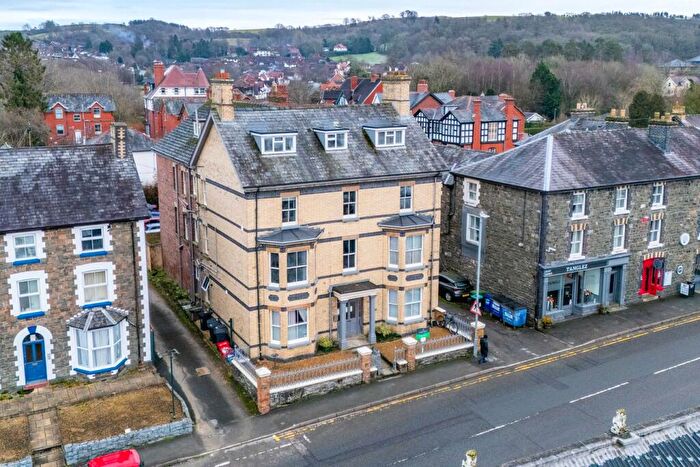
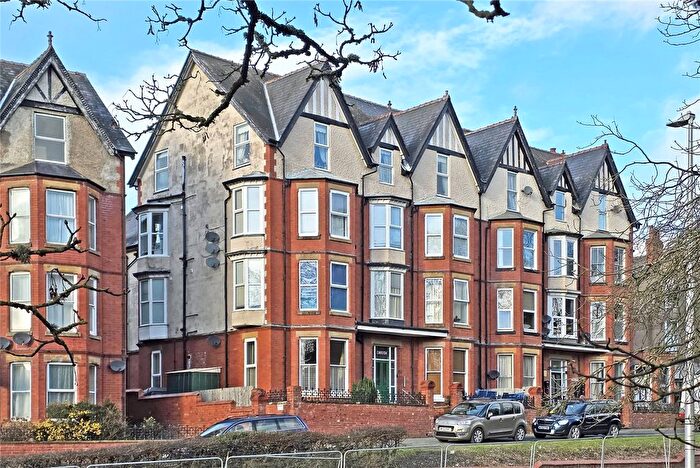
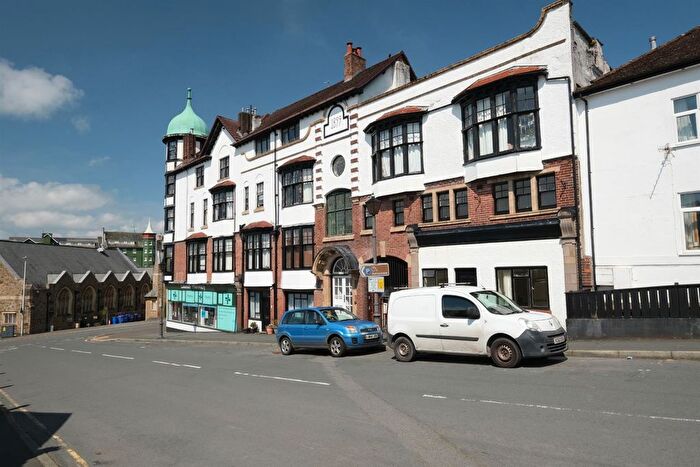
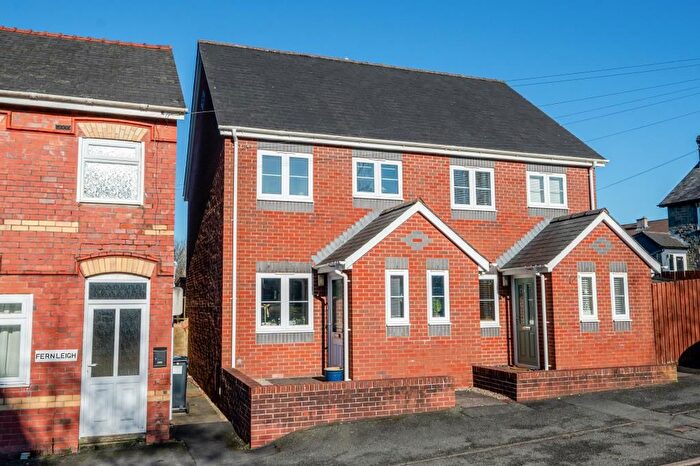
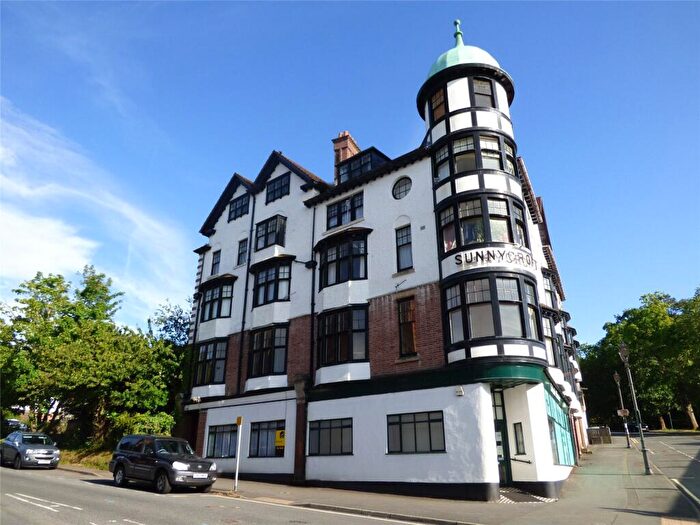
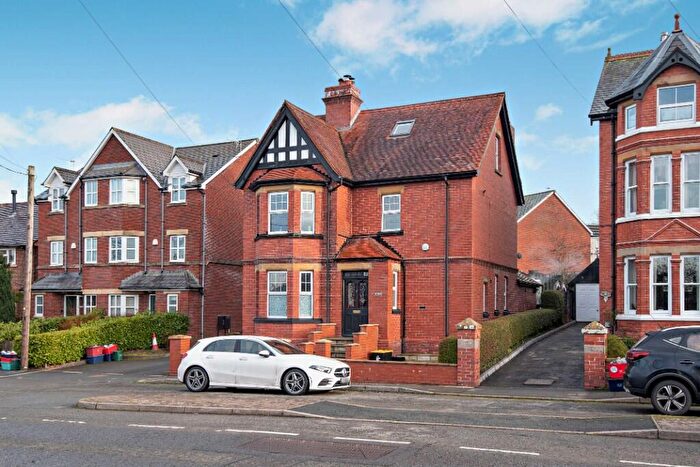
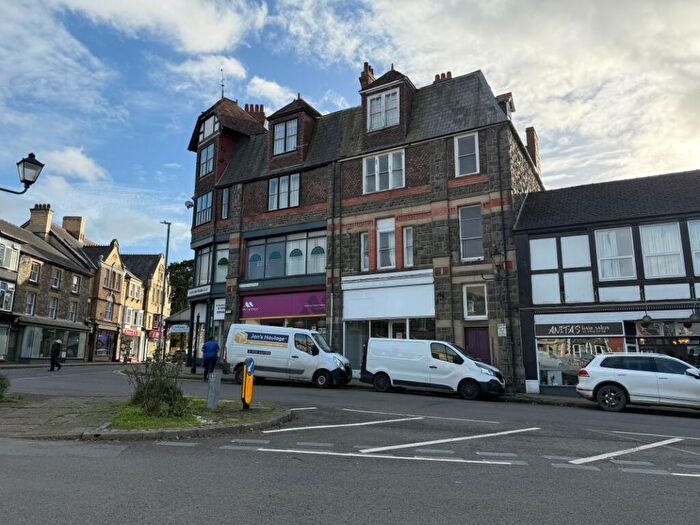
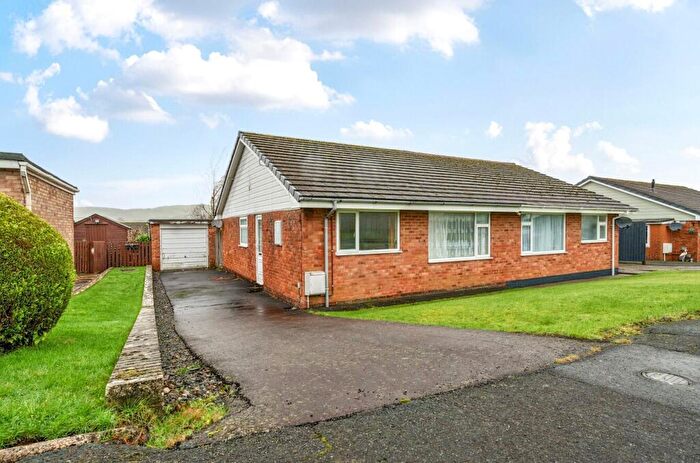
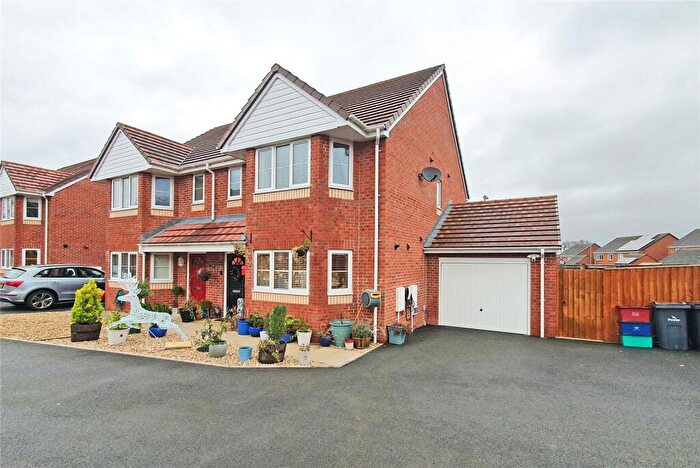
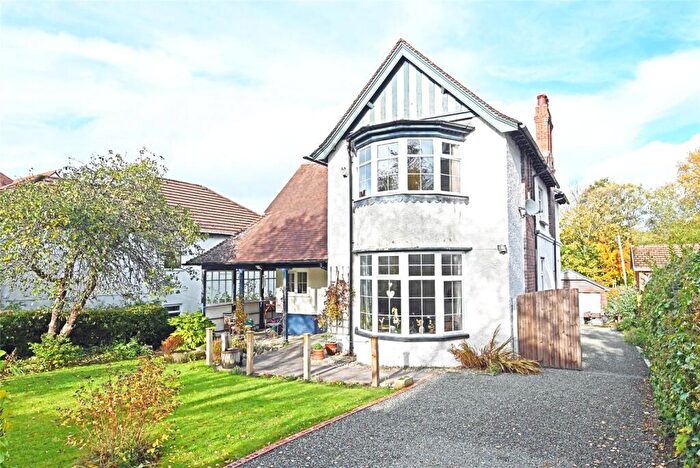
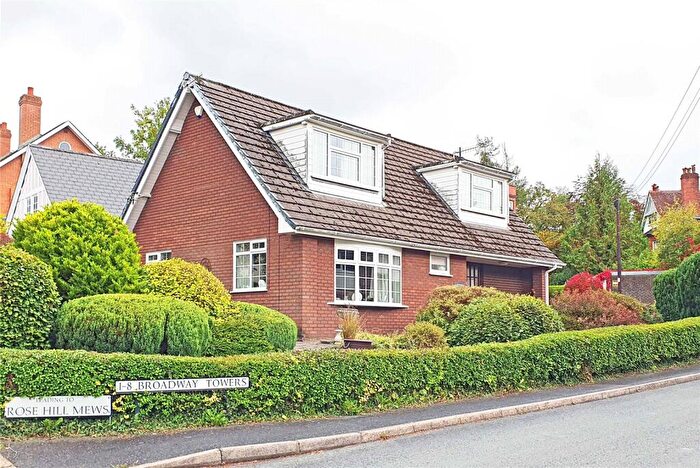
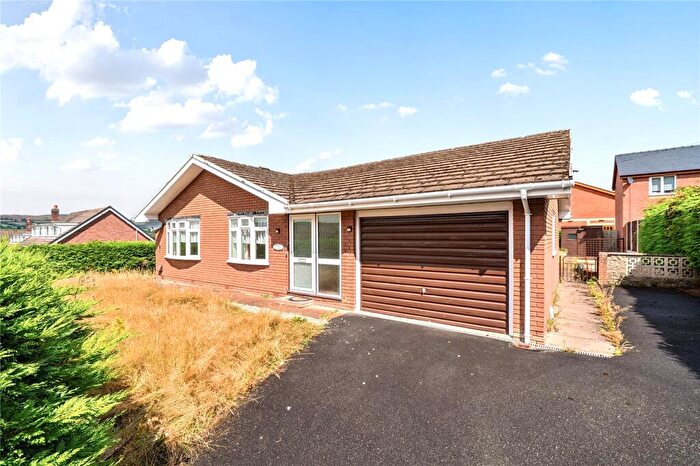
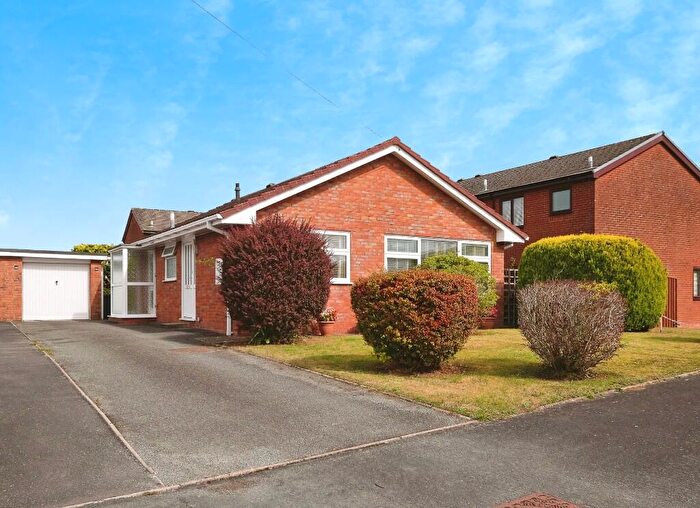
Houses for sale & to rent in Llandrindod East/llandrindod West, Llandrindod Wells
House Prices in Llandrindod East/llandrindod West
Properties in Llandrindod East/llandrindod West have an average house price of £159,554.00 and had 55 Property Transactions within the last 3 years¹.
Llandrindod East/llandrindod West is an area in Llandrindod Wells, Powys - Powys with 674 households², where the most expensive property was sold for £470,000.00.
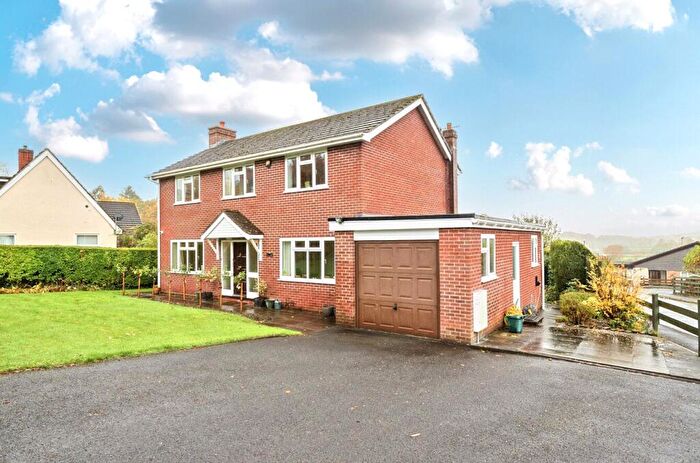
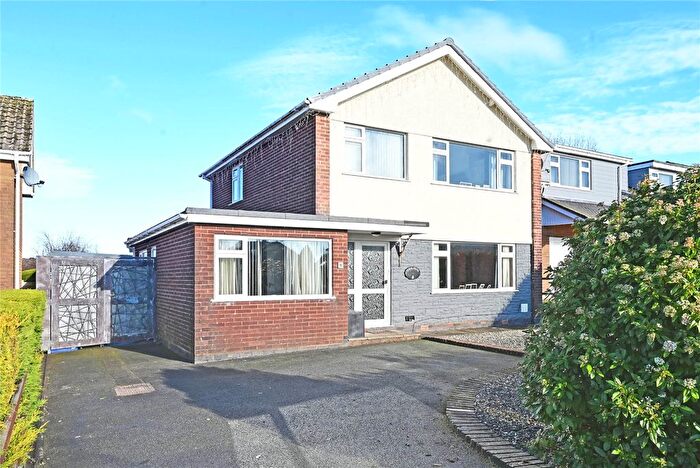
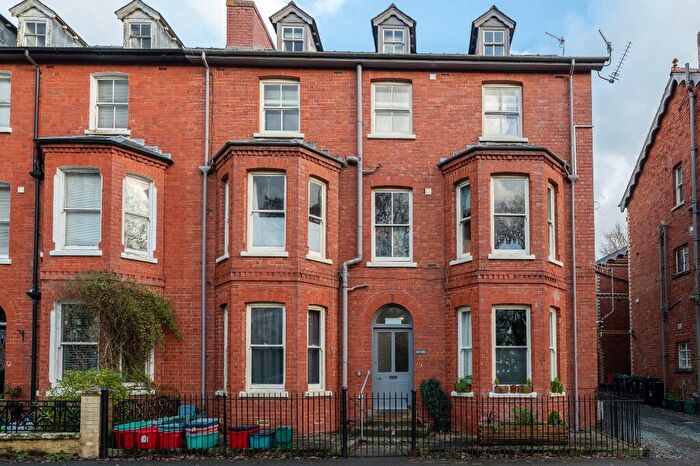
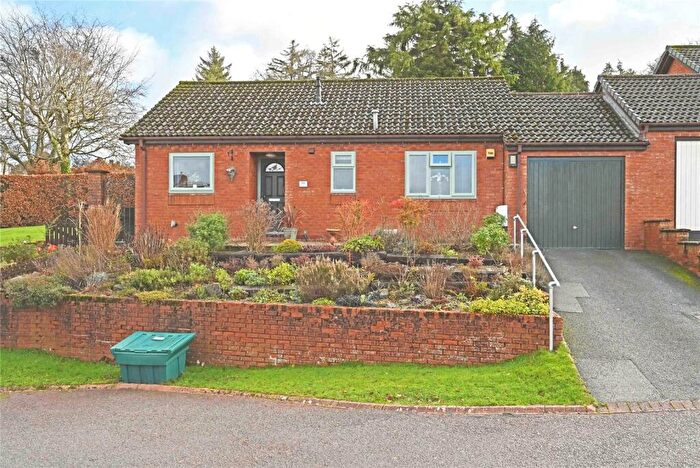
Properties for sale in Llandrindod East/llandrindod West
Roads and Postcodes in Llandrindod East/llandrindod West
Navigate through our locations to find the location of your next house in Llandrindod East/llandrindod West, Llandrindod Wells for sale or to rent.
| Streets | Postcodes |
|---|---|
| Arlais Road | LD1 5HE |
| Beaufort Road | LD1 5EE |
| Cadwallader Way | LD1 6BJ |
| Church Row | LD1 6AZ |
| Craig Road | LD1 5HS |
| Dyffryn Court | LD1 6AQ |
| Dyffryn Road | LD1 6AN LD1 6AW |
| High Street | LD1 6AG LD1 6BG |
| Ithon Road | LD1 6AS LD1 6AA |
| Lant Avenue | LD1 5EF LD1 5EH LD1 5EL LD1 5LA LD1 5HY |
| Linden Walk | LD1 5EA |
| Llanerch Lane | LD1 6BZ |
| Middleton Street | LD1 5DG LD1 5ET LD1 5EU |
| Norton Terrace | LD1 6AT |
| Orchard Gardens | LD1 6BA |
| Oxford Avenue | LD1 6AL |
| Oxford Road | LD1 6AH |
| Park Crescent | LD1 6AB |
| Park Terrace | LD1 6AY LD1 6AU |
| Rock House Court | LD1 6AX |
| Rock House Road | LD1 6AF LD1 6AJ |
| Rock Park Close | LD1 6AR |
| South Crescent | LD1 5DH |
| Spa Road | LD1 5ER LD1 5EY LD1 5EQ |
| Station Crescent | LD1 5BB LD1 5BD LD1 5AP |
| Temple Street | LD1 5DL LD1 5DP LD1 5DU LD1 5HF LD1 5DY |
| The Close | LD1 5EG |
| Tudor Lane | LD1 5UL |
| Victoria Road | LD1 6AP |
| Waterloo Road | LD1 6BH |
| LD1 5WF LD1 6DU LD1 9AD LD1 9AQ LD1 9AY LD1 9BE LD1 9BL LD1 9BQ LD2 3NZ LD2 9AN LD2 9AP LD7 9AF LD7 9AP LD7 9AQ LD8 2WA LD8 2WF |
Transport near Llandrindod East/llandrindod West
-
Llandrindod Station
-
Pen-Y-Bont Station
-
Builth Road Station
-
Dolau Station
-
Cilmeri Station
-
Llanbister Road Station
-
Garth (Powys) Station
- FAQ
- Price Paid By Year
- Property Type Price
Frequently asked questions about Llandrindod East/llandrindod West
What is the average price for a property for sale in Llandrindod East/llandrindod West?
The average price for a property for sale in Llandrindod East/llandrindod West is £159,554. This amount is 30% lower than the average price in Llandrindod Wells. There are 571 property listings for sale in Llandrindod East/llandrindod West.
What streets have the most expensive properties for sale in Llandrindod East/llandrindod West?
The streets with the most expensive properties for sale in Llandrindod East/llandrindod West are Arlais Road at an average of £375,000, Victoria Road at an average of £276,666 and Oxford Road at an average of £206,875.
What streets have the most affordable properties for sale in Llandrindod East/llandrindod West?
The streets with the most affordable properties for sale in Llandrindod East/llandrindod West are Park Terrace at an average of £59,600, Spa Road at an average of £69,000 and High Street at an average of £79,200.
Which train stations are available in or near Llandrindod East/llandrindod West?
Some of the train stations available in or near Llandrindod East/llandrindod West are Llandrindod, Pen-Y-Bont and Builth Road.
Property Price Paid in Llandrindod East/llandrindod West by Year
The average sold property price by year was:
| Year | Average Sold Price | Price Change |
Sold Properties
|
|---|---|---|---|
| 2025 | £200,961 | 39% |
13 Properties |
| 2024 | £121,809 | -41% |
21 Properties |
| 2023 | £171,666 | 20% |
21 Properties |
| 2022 | £136,609 | 7% |
33 Properties |
| 2021 | £127,229 | -9% |
32 Properties |
| 2020 | £138,458 | 25% |
24 Properties |
| 2019 | £103,375 | 4% |
24 Properties |
| 2018 | £99,607 | -62% |
32 Properties |
| 2017 | £161,083 | 21% |
18 Properties |
| 2016 | £127,531 | 9% |
16 Properties |
| 2015 | £116,307 | -5% |
34 Properties |
| 2014 | £121,842 | 12% |
19 Properties |
| 2013 | £107,166 | -1% |
9 Properties |
| 2012 | £108,178 | -17% |
14 Properties |
| 2011 | £126,166 | -10% |
9 Properties |
| 2010 | £139,321 | -14% |
14 Properties |
| 2009 | £159,500 | 19% |
10 Properties |
| 2008 | £129,000 | 1% |
7 Properties |
| 2007 | £128,165 | 1% |
35 Properties |
| 2006 | £127,260 | 23% |
34 Properties |
| 2005 | £98,378 | -13% |
23 Properties |
| 2004 | £111,234 | 33% |
29 Properties |
| 2003 | £74,785 | -1% |
21 Properties |
| 2002 | £75,714 | 10% |
25 Properties |
| 2001 | £67,900 | 5% |
15 Properties |
| 2000 | £64,833 | 10% |
18 Properties |
| 1999 | £58,387 | 36% |
13 Properties |
| 1998 | £37,311 | -44% |
17 Properties |
| 1997 | £53,814 | 6% |
14 Properties |
| 1996 | £50,415 | 20% |
10 Properties |
| 1995 | £40,500 | - |
7 Properties |
Property Price per Property Type in Llandrindod East/llandrindod West
Here you can find historic sold price data in order to help with your property search.
The average Property Paid Price for specific property types in the last three years are:
| Property Type | Average Sold Price | Sold Properties |
|---|---|---|
| Semi Detached House | £194,029.00 | 17 Semi Detached Houses |
| Detached House | £282,722.00 | 9 Detached Houses |
| Terraced House | £159,944.00 | 9 Terraced Houses |
| Flat | £74,650.00 | 20 Flats |

