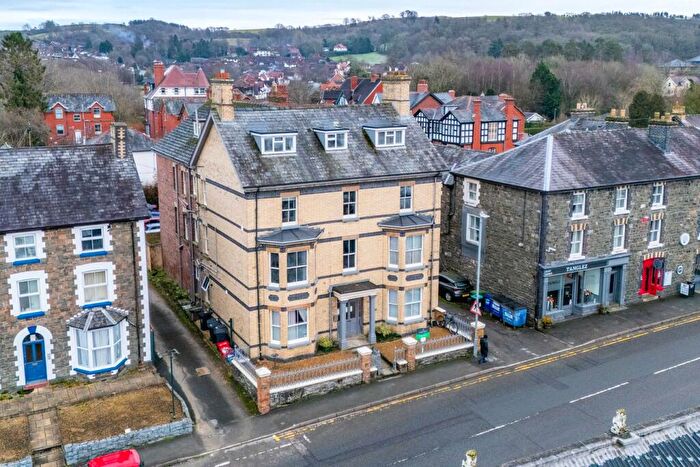
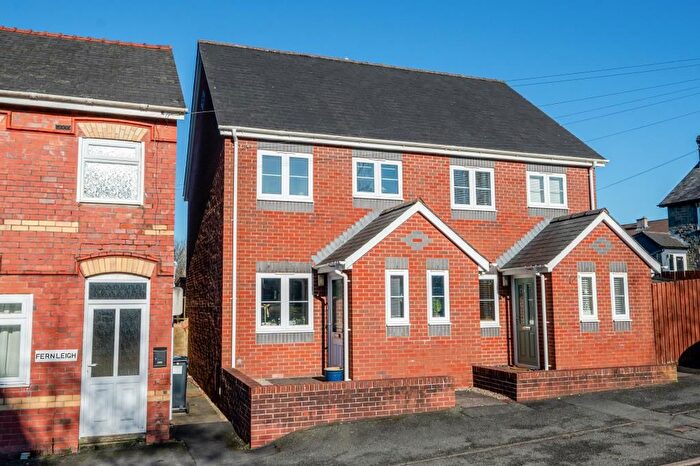
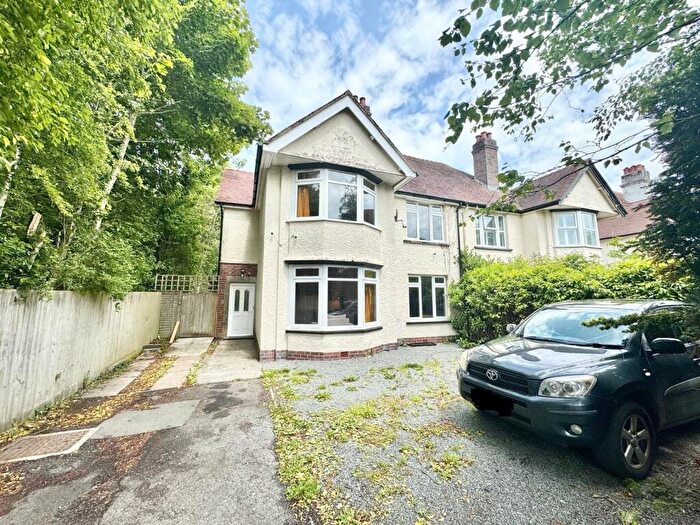
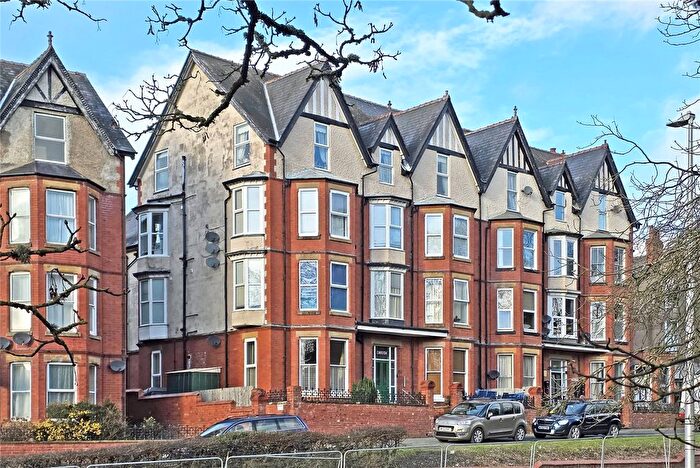
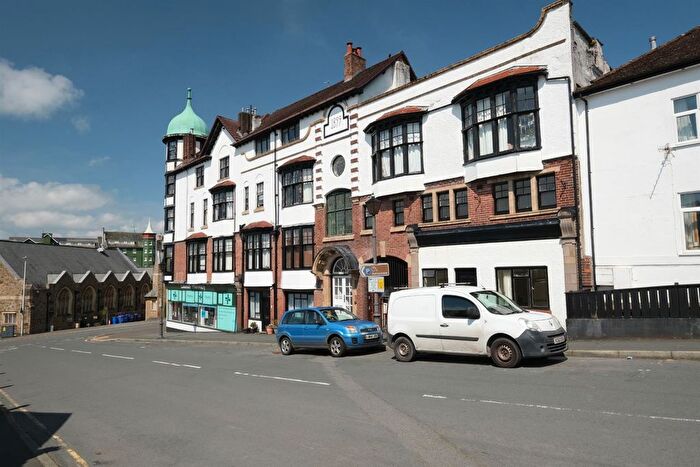
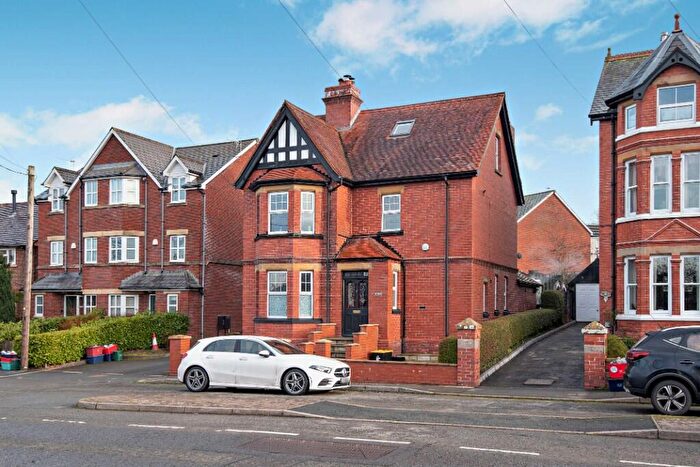
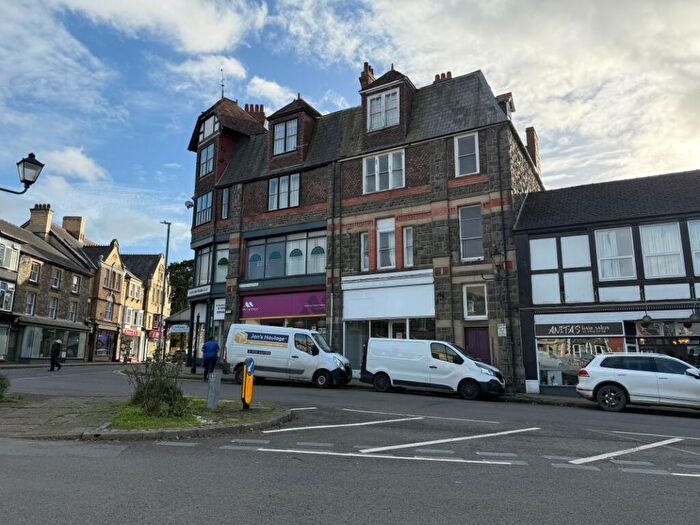
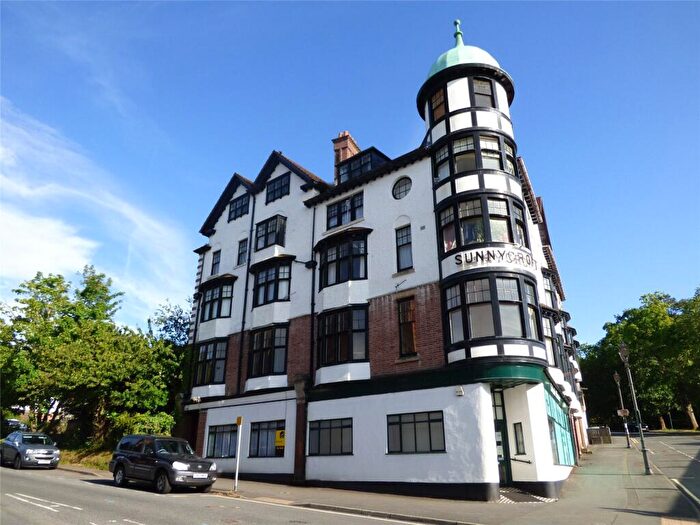
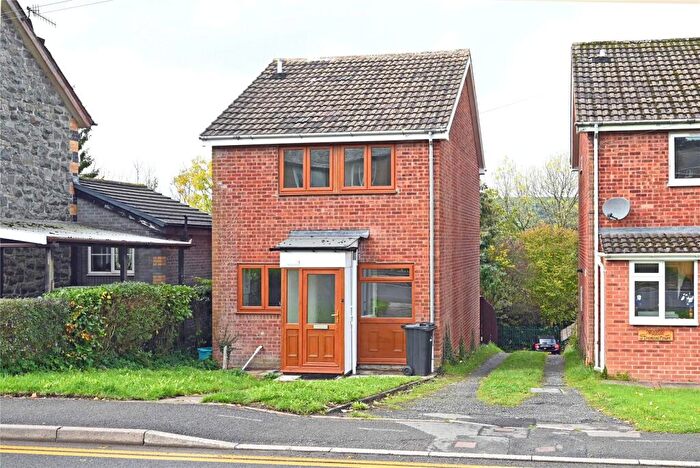
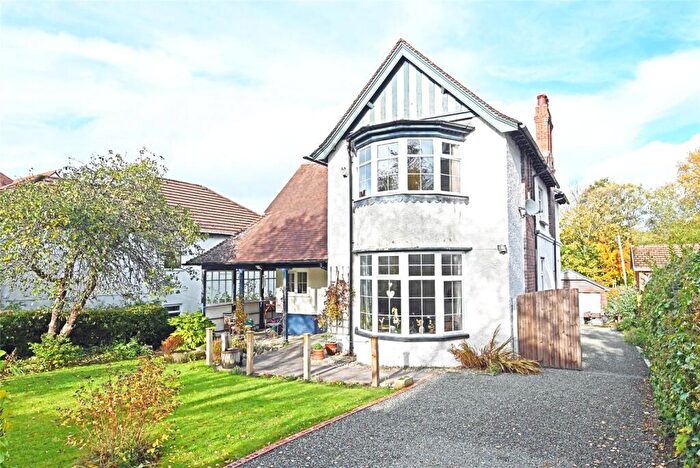
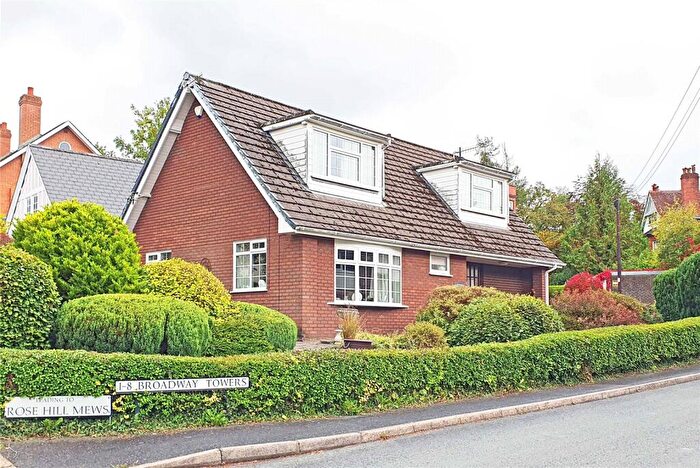
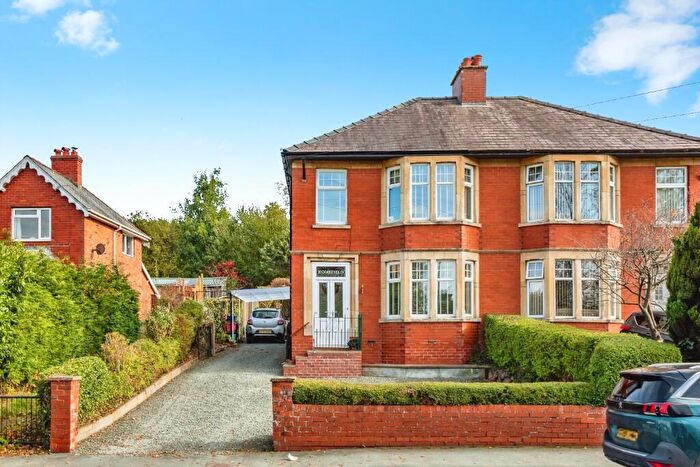
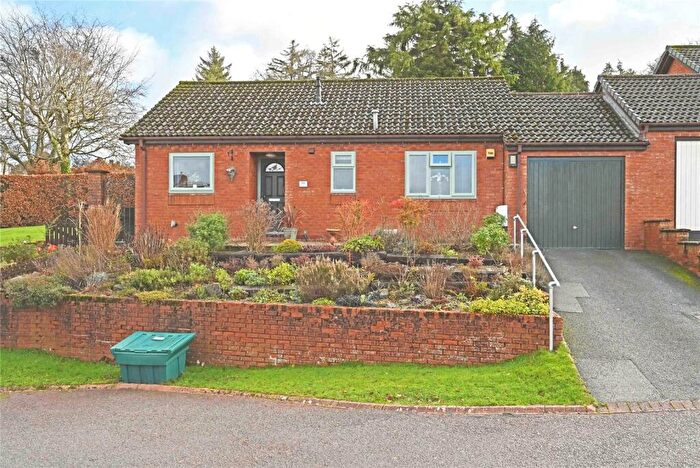
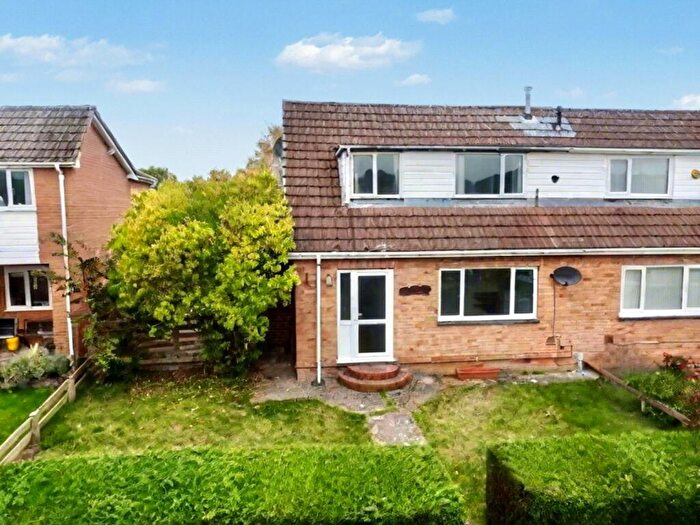
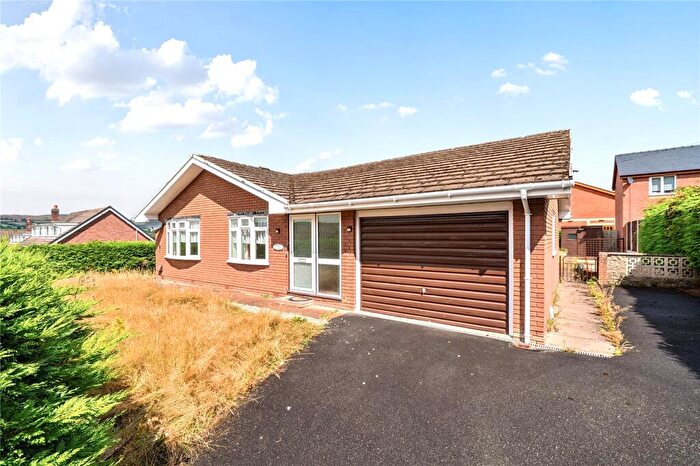
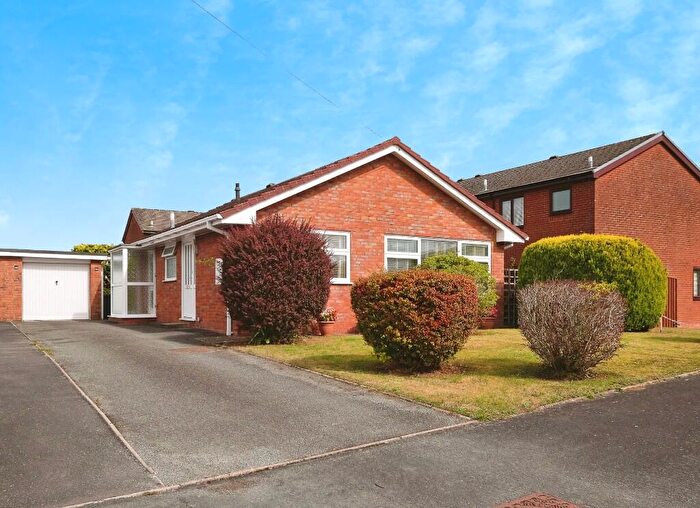
Houses for sale & to rent in Llandrindod North, Llandrindod Wells
House Prices in Llandrindod North
Properties in Llandrindod North have an average house price of £188,943.00 and had 90 Property Transactions within the last 3 years¹.
Llandrindod North is an area in Llandrindod Wells, Powys - Powys with 894 households², where the most expensive property was sold for £305,000.00.
Properties for sale in Llandrindod North
Roads and Postcodes in Llandrindod North
Navigate through our locations to find the location of your next house in Llandrindod North, Llandrindod Wells for sale or to rent.
| Streets | Postcodes |
|---|---|
| Afon Way | LD1 5AJ |
| Almond Avenue | LD1 6DH |
| Brickfield Cottages | LD1 6DE |
| Brookland Road | LD1 6DB LD1 6DD LD1 6DQ LD1 6ER |
| Camddwr Rise | LD1 5BF |
| Clar Court | LD1 6DZ |
| Clywedog Drive | LD1 5BZ |
| Crabtree Green | LD1 6EP |
| Cumbria Place | LD1 5BS |
| Ddole Road | LD1 6PE LD1 6PF |
| Ddole Road Industrial Estate | LD1 6DF |
| Dulas Bank | LD1 5AF |
| Finch Court | LD1 6BP |
| Heart Of Wales Business Park | LD1 5AB |
| Heighway Court | LD1 6ES |
| Hernog Close | LD1 5BA |
| Hillcrest Avenue | LD1 6DL |
| Hillcrest Close | LD1 6BW |
| Hillcrest Drive | LD1 6DG |
| Hillcrest Rise | LD1 6BN |
| Holcombe Avenue | LD1 6DR LD1 6DW |
| Holcombe Drive | LD1 6DN LD1 6DP |
| Ithon Close | LD1 6BD |
| Ithon View | LD1 5BX |
| Laurel Gardens | LD1 6BX |
| Llanfawr Close | LD1 5YE |
| Llethyr Bryn | LD1 6BB |
| Lon Cwm | LD1 6BE |
| Maple Terrace | LD1 5BP |
| Minerva Close | LD1 6DJ |
| Nelson Street | LD1 6BT LD1 6BS |
| New Street | LD1 6BU |
| North Avenue | LD1 6BY LD1 6DA |
| Noyadd Close | LD1 5YF |
| Penybryn | LD1 6DS |
| Quarry Lane | LD1 5LB LD1 5LH |
| Rainbow View | LD1 5AN |
| Station Yard | LD1 5BE |
| The Rise | LD1 5YD |
| Trefonen Avenue | LD1 5YB |
| Trefonen Lane | LD1 5BQ |
| Trefonen Way | LD1 5YA |
| Tremont Road | LD1 5BG LD1 5BH LD1 5BJ LD1 5BL LD1 5BN LD1 5BT LD1 5BU LD1 5BW LD1 5BY LD1 5DA LD1 5DB LD1 5EB LD1 5AD |
| Walnut Close | LD1 5PE |
| Waterloo Road | LD1 6BL |
| LD1 5DF LD1 5EP LD1 5PF LD1 6EJ |
Transport near Llandrindod North
-
Llandrindod Station
-
Pen-Y-Bont Station
-
Dolau Station
-
Builth Road Station
-
Cilmeri Station
-
Llanbister Road Station
- FAQ
- Price Paid By Year
- Property Type Price
Frequently asked questions about Llandrindod North
What is the average price for a property for sale in Llandrindod North?
The average price for a property for sale in Llandrindod North is £188,943. This amount is 18% lower than the average price in Llandrindod Wells. There are 502 property listings for sale in Llandrindod North.
What streets have the most expensive properties for sale in Llandrindod North?
The streets with the most expensive properties for sale in Llandrindod North are Crabtree Green at an average of £285,500, Hillcrest Avenue at an average of £270,000 and Clywedog Drive at an average of £255,000.
What streets have the most affordable properties for sale in Llandrindod North?
The streets with the most affordable properties for sale in Llandrindod North are Trefonen Way at an average of £118,600, The Rise at an average of £120,000 and Trefonen Avenue at an average of £120,500.
Which train stations are available in or near Llandrindod North?
Some of the train stations available in or near Llandrindod North are Llandrindod, Pen-Y-Bont and Dolau.
Property Price Paid in Llandrindod North by Year
The average sold property price by year was:
| Year | Average Sold Price | Price Change |
Sold Properties
|
|---|---|---|---|
| 2025 | £199,820 | 3% |
35 Properties |
| 2024 | £193,588 | 16% |
34 Properties |
| 2023 | £163,296 | -21% |
21 Properties |
| 2022 | £197,825 | 14% |
29 Properties |
| 2021 | £169,418 | 15% |
51 Properties |
| 2020 | £143,275 | -2% |
28 Properties |
| 2019 | £145,707 | 1% |
41 Properties |
| 2018 | £144,883 | 6% |
31 Properties |
| 2017 | £136,353 | 7% |
40 Properties |
| 2016 | £127,219 | -6% |
35 Properties |
| 2015 | £135,296 | 5% |
57 Properties |
| 2014 | £127,875 | -4% |
41 Properties |
| 2013 | £133,190 | 7% |
25 Properties |
| 2012 | £124,164 | -6% |
21 Properties |
| 2011 | £131,938 | 0,1% |
19 Properties |
| 2010 | £131,826 | -4% |
23 Properties |
| 2009 | £136,555 | 11% |
27 Properties |
| 2008 | £121,401 | -14% |
31 Properties |
| 2007 | £138,594 | 15% |
60 Properties |
| 2006 | £118,067 | -4% |
47 Properties |
| 2005 | £123,266 | 13% |
50 Properties |
| 2004 | £107,541 | 20% |
63 Properties |
| 2003 | £86,455 | 30% |
63 Properties |
| 2002 | £60,473 | 14% |
32 Properties |
| 2001 | £52,153 | 13% |
32 Properties |
| 2000 | £45,627 | 1% |
29 Properties |
| 1999 | £44,973 | -6% |
30 Properties |
| 1998 | £47,598 | 11% |
28 Properties |
| 1997 | £42,312 | -18% |
36 Properties |
| 1996 | £49,787 | 20% |
16 Properties |
| 1995 | £39,890 | - |
11 Properties |
Property Price per Property Type in Llandrindod North
Here you can find historic sold price data in order to help with your property search.
The average Property Paid Price for specific property types in the last three years are:
| Property Type | Average Sold Price | Sold Properties |
|---|---|---|
| Semi Detached House | £196,805.00 | 36 Semi Detached Houses |
| Detached House | £226,910.00 | 26 Detached Houses |
| Terraced House | £146,194.00 | 27 Terraced Houses |
| Flat | £73,000.00 | 1 Flat |

