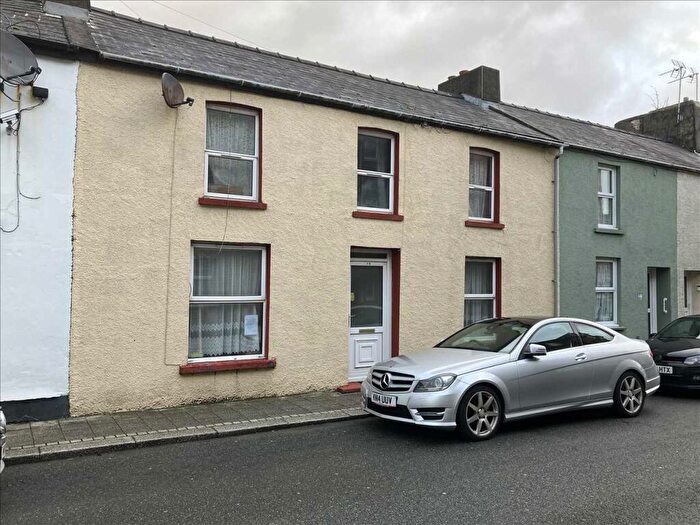
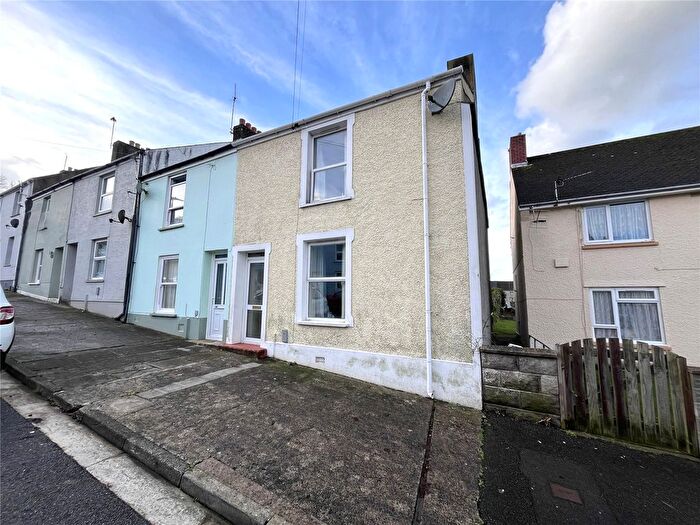
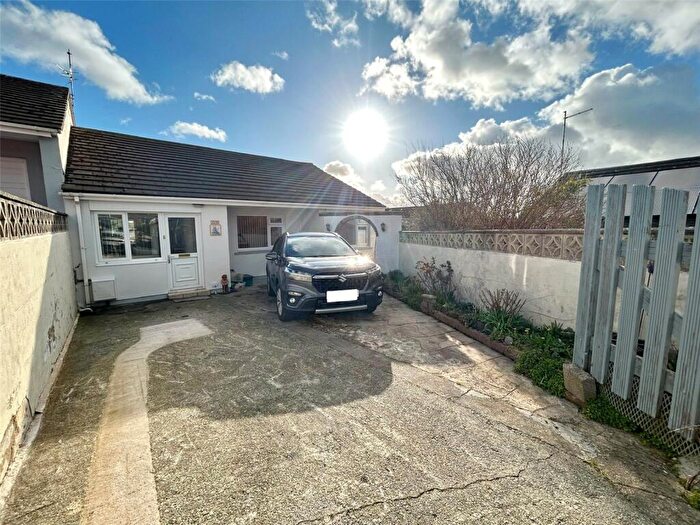
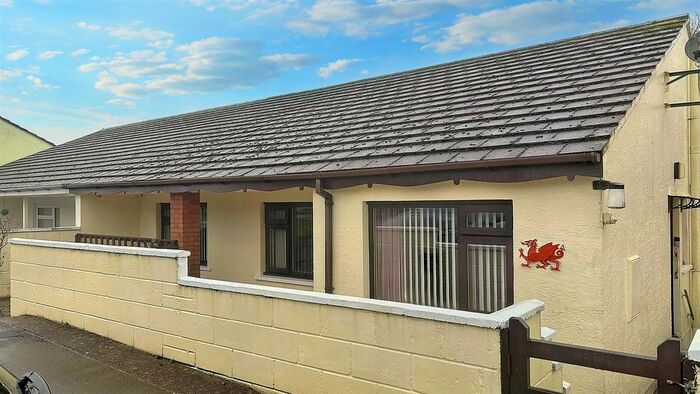
Houses for sale & to rent in Neyland: West, Milford Haven
House Prices in Neyland: West
Properties in Neyland: West have an average house price of £195,267.00 and had 93 Property Transactions within the last 3 years¹.
Neyland: West is an area in Milford Haven, Sir Benfro - Pembrokeshire with 919 households², where the most expensive property was sold for £450,000.00.
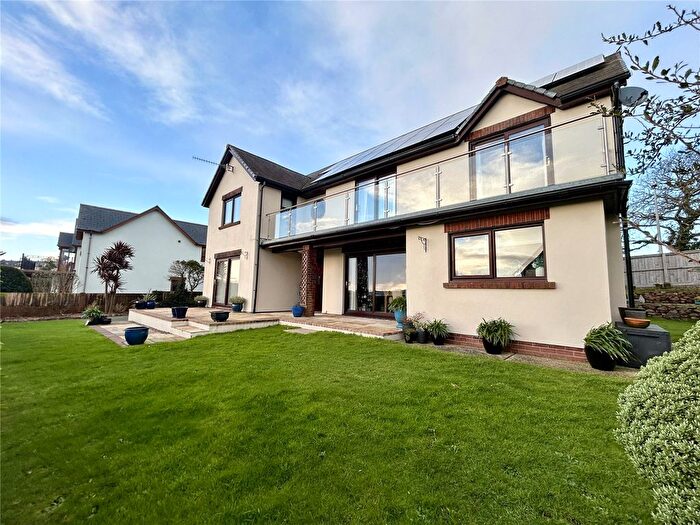
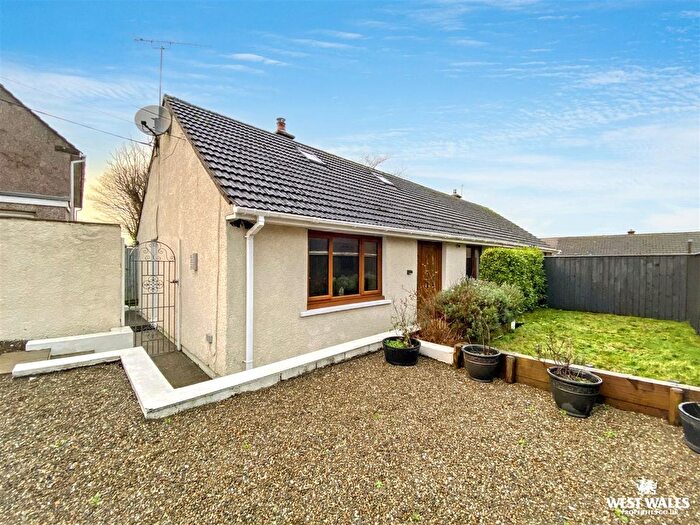
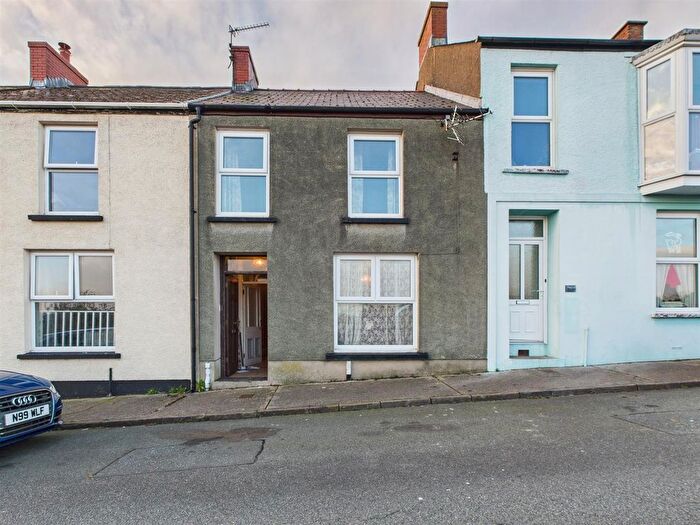
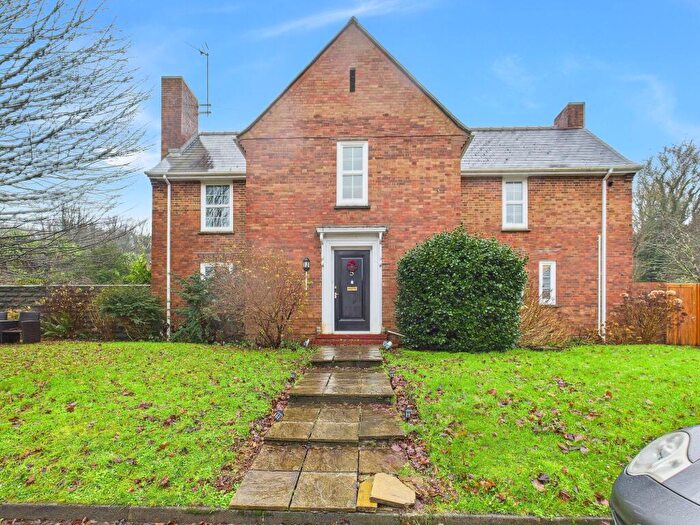
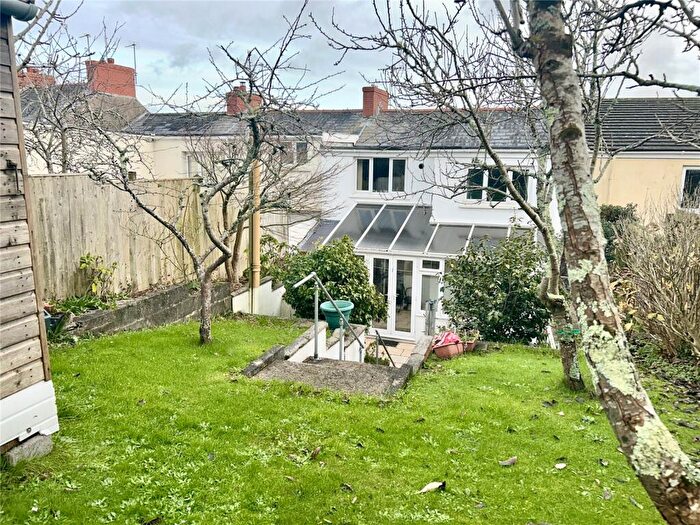
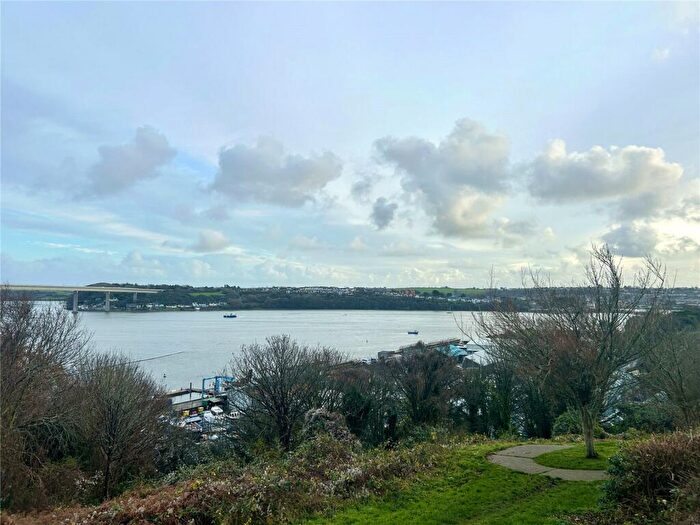
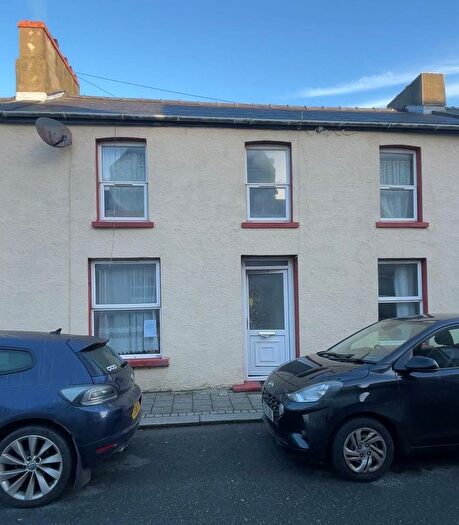
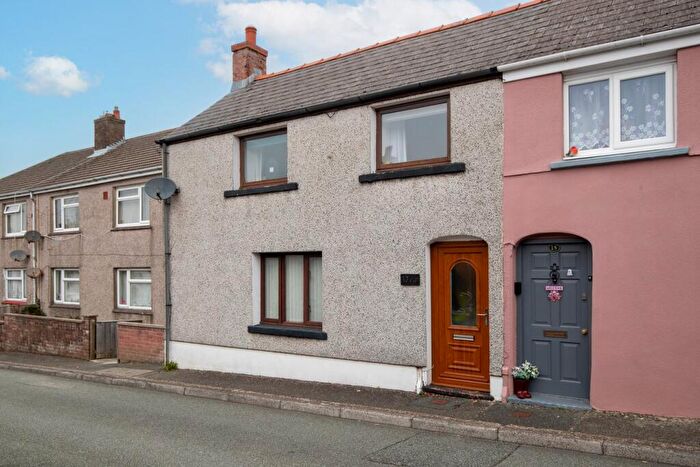
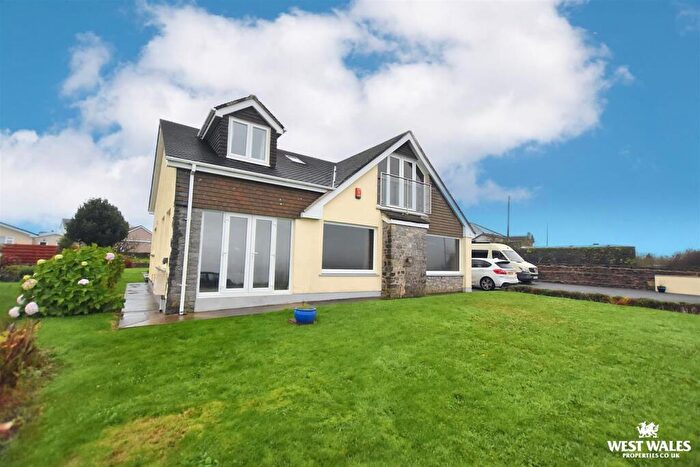
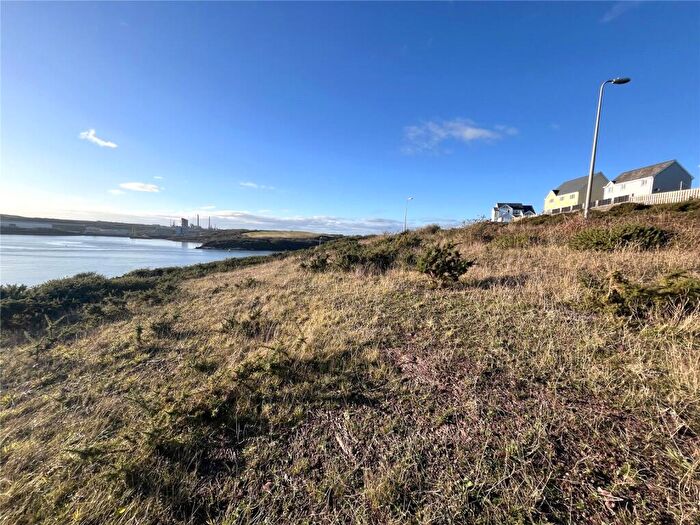
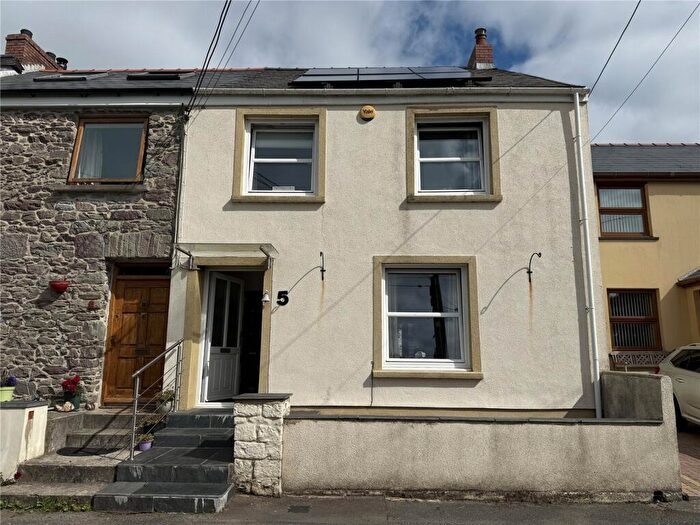
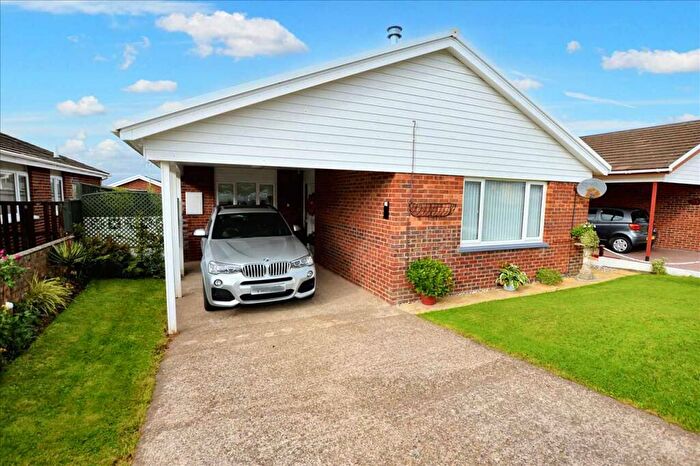
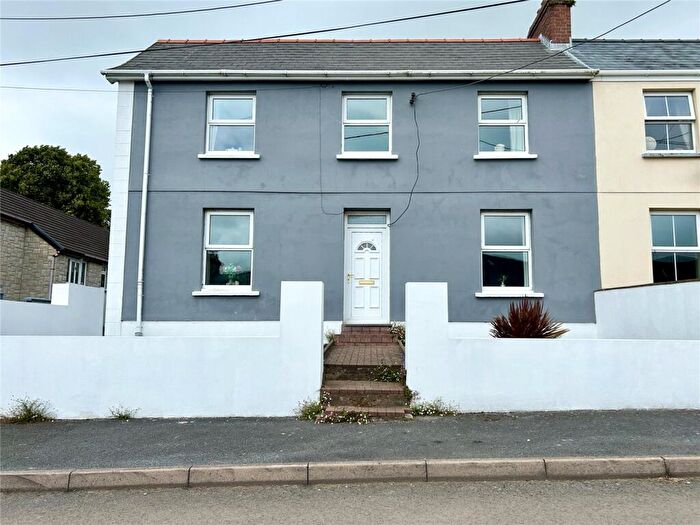
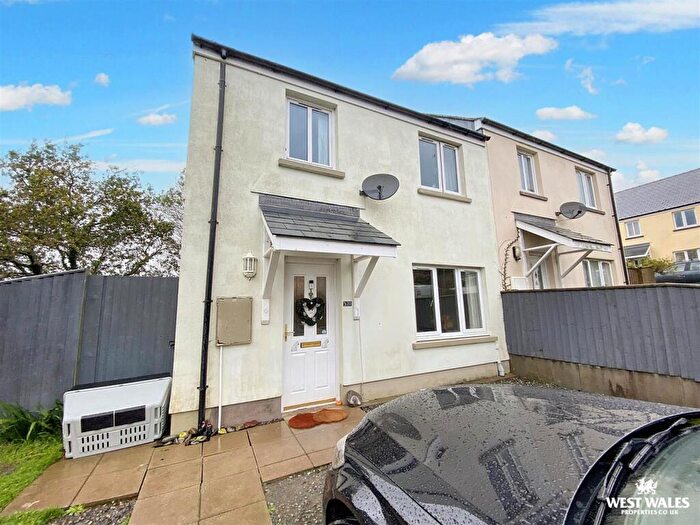
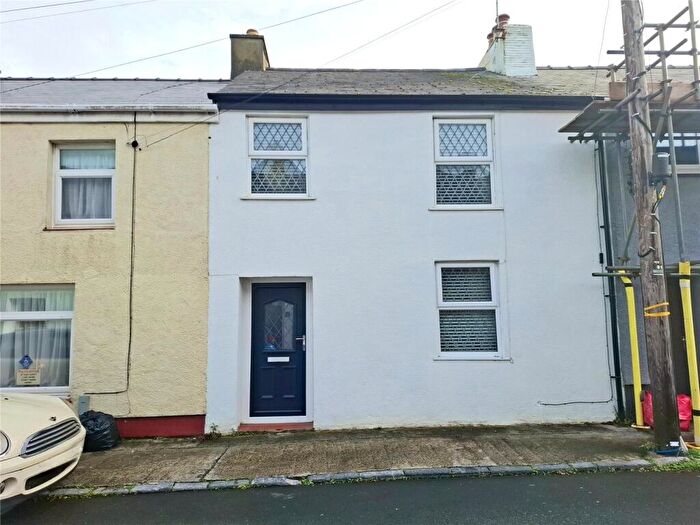
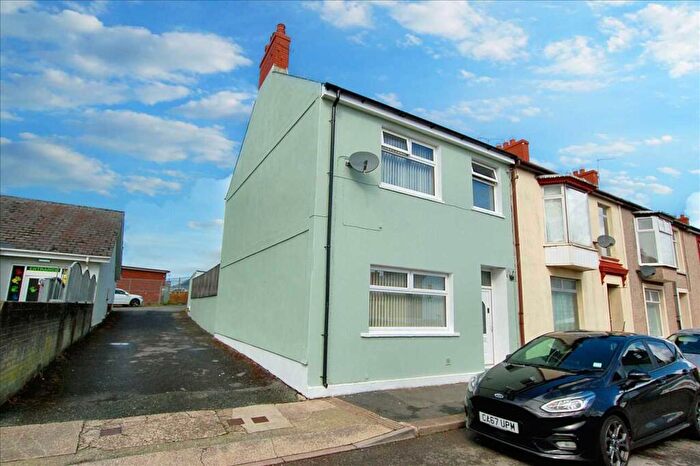
Properties for sale in Neyland: West
Roads and Postcodes in Neyland: West
Navigate through our locations to find the location of your next house in Neyland: West, Milford Haven for sale or to rent.
| Streets | Postcodes |
|---|---|
| Alban Crescent | SA73 1DY |
| Belle Vue Terrace | SA73 1TN |
| Charles Street | SA73 1SA |
| Church Lake Terrace | SA73 1RX |
| Church Road | SA73 1EA SA73 1EB SA73 1EE |
| Churchway | SA73 1QL |
| Cleddau Avenue | SA73 1UE |
| Crossways | SA73 1QX SA73 1QY |
| George Street | SA73 1RR |
| Gordon Parry Close | SA73 1RL |
| Gordon Parry Road | SA73 1PU |
| Gothic Road | SA73 1RT |
| Green Lane | SA73 1DS |
| Harbour Close | SA73 1UG |
| Havenbridge Road | SA73 1QZ |
| Hazel Bank Hill | SA73 1EL |
| Hazel Grove | SA73 1EW |
| Hazelbank | SA73 1EN |
| Hazelbeach Road | SA73 1DX |
| Honeyborough Green | SA73 1RG |
| Honeyborough Road | SA73 1RE SA73 1RF |
| Isambard Gardens | SA73 1UJ |
| James Street | SA73 1RP |
| Kensington Road | SA73 1TL |
| Leonardston Road | SA73 1EP SA73 1ER |
| Leonardston View | SA73 1ED |
| Lighthouse Drive | SA73 1EF |
| Little Honeyborough Lane | SA73 1QT |
| Main Road | SA73 1DP SA73 1DU |
| Mastlebridge | SA73 1QS |
| Meadow Way | SA73 1BR |
| Military Road | SA73 1FA |
| Neyland | SA73 1QN |
| Neyland Heights | SA73 1RQ |
| Neyland Vale | SA73 1QP |
| Phillips Walk | SA73 1QW |
| Promenade Drive | SA73 1QD |
| Riverside Avenue | SA73 1TS SA73 1UD |
| Rock Cottages | SA73 1RS |
| St Marys Park | SA73 1HP SA73 1HS SA73 1HU SA73 1HX SA73 1HR |
| The Promenade | SA73 1QF |
| Trinity Place | SA73 1QJ |
| Vale Road | SA73 1RU |
| Victoria Court | SA73 1PT |
| Water Street | SA73 1RJ |
| Waterston Road | SA73 1EH SA73 1EJ SA73 1DR |
| Well Road | SA73 1DT |
| West Lane | SA73 1RH |
| Woodlands Park | SA73 1RY |
| SA73 1HN SA73 1JF SA73 1QU SA73 1EG SA73 1HJ SA73 1HL SA73 1JD SA73 1JE |
Transport near Neyland: West
- FAQ
- Price Paid By Year
- Property Type Price
Frequently asked questions about Neyland: West
What is the average price for a property for sale in Neyland: West?
The average price for a property for sale in Neyland: West is £195,267. This amount is 3% higher than the average price in Milford Haven. There are 683 property listings for sale in Neyland: West.
What streets have the most expensive properties for sale in Neyland: West?
The streets with the most expensive properties for sale in Neyland: West are Hazel Grove at an average of £315,166, Neyland Vale at an average of £309,000 and Little Honeyborough Lane at an average of £300,900.
What streets have the most affordable properties for sale in Neyland: West?
The streets with the most affordable properties for sale in Neyland: West are Vale Road at an average of £126,666, Kensington Road at an average of £126,777 and Honeyborough Green at an average of £143,600.
Which train stations are available in or near Neyland: West?
Some of the train stations available in or near Neyland: West are Pembroke Dock, Milford Haven and Johnston (Dyfed).
Property Price Paid in Neyland: West by Year
The average sold property price by year was:
| Year | Average Sold Price | Price Change |
Sold Properties
|
|---|---|---|---|
| 2025 | £178,282 | -10% |
14 Properties |
| 2024 | £196,700 | -4% |
22 Properties |
| 2023 | £203,999 | 4% |
22 Properties |
| 2022 | £195,671 | 7% |
35 Properties |
| 2021 | £182,559 | -1% |
42 Properties |
| 2020 | £184,605 | 8% |
28 Properties |
| 2019 | £170,110 | 3% |
31 Properties |
| 2018 | £165,456 | 7% |
33 Properties |
| 2017 | £153,137 | 5% |
29 Properties |
| 2016 | £145,178 | -10% |
28 Properties |
| 2015 | £159,770 | 7% |
34 Properties |
| 2014 | £149,167 | 14% |
28 Properties |
| 2013 | £127,821 | -13% |
14 Properties |
| 2012 | £144,343 | -15% |
16 Properties |
| 2011 | £165,656 | 5% |
8 Properties |
| 2010 | £156,650 | 4% |
20 Properties |
| 2009 | £151,028 | -10% |
14 Properties |
| 2008 | £165,448 | 9% |
13 Properties |
| 2007 | £150,005 | 1% |
27 Properties |
| 2006 | £148,617 | 16% |
44 Properties |
| 2005 | £124,902 | 7% |
24 Properties |
| 2004 | £116,275 | 14% |
27 Properties |
| 2003 | £100,519 | 26% |
34 Properties |
| 2002 | £74,346 | 15% |
40 Properties |
| 2001 | £62,942 | 13% |
41 Properties |
| 2000 | £54,982 | 13% |
25 Properties |
| 1999 | £47,901 | -11% |
30 Properties |
| 1998 | £53,096 | 1% |
25 Properties |
| 1997 | £52,520 | 30% |
27 Properties |
| 1996 | £36,666 | -26% |
16 Properties |
| 1995 | £46,114 | - |
17 Properties |
Property Price per Property Type in Neyland: West
Here you can find historic sold price data in order to help with your property search.
The average Property Paid Price for specific property types in the last three years are:
| Property Type | Average Sold Price | Sold Properties |
|---|---|---|
| Semi Detached House | £189,128.00 | 39 Semi Detached Houses |
| Detached House | £279,904.00 | 22 Detached Houses |
| Terraced House | £149,429.00 | 29 Terraced Houses |
| Flat | £97,500.00 | 3 Flats |

